Zip Codes with the Highest Percentage of Population Employed in Health Care & Social Assistance in Washington
RELATED REPORTS & OPTIONS
Health Care & Social Assistance
Washington
Compare Zip Codes
Map of Zip Codes with the Highest Percentage of Population Employed in Health Care & Social Assistance in Washington
0.0%
100.0%
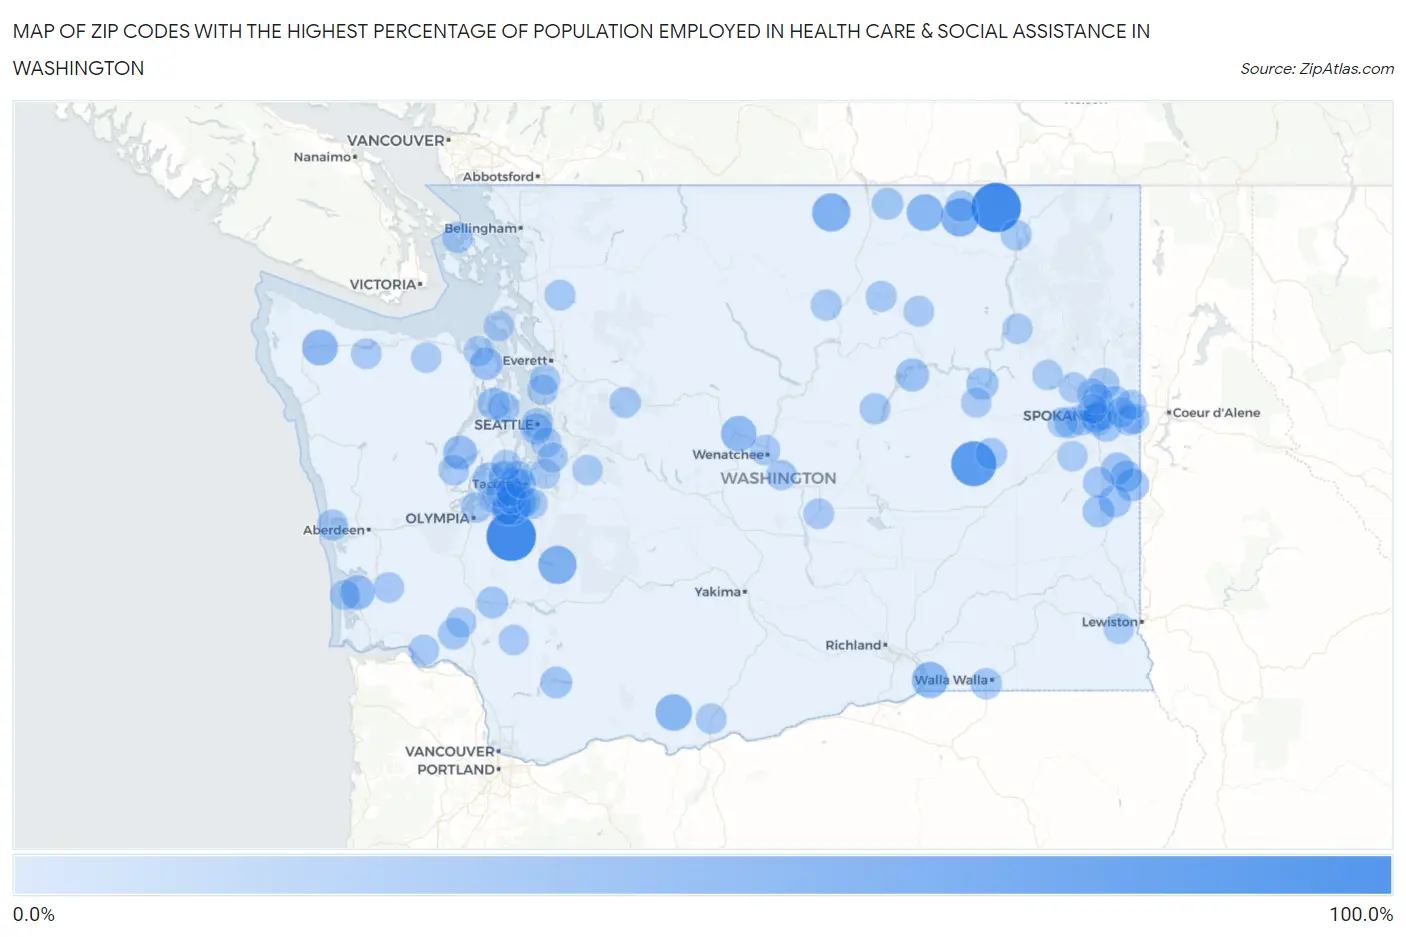
Zip Codes with the Highest Percentage of Population Employed in Health Care & Social Assistance in Washington
| Zip Code | % Employed | vs State | vs National | |
| 1. | 98558 | 100.0% | 13.0% (+87.0)#1 | 13.9% (+86.1)#34 |
| 2. | 99160 | 100.0% | 13.0% (+87.0)#2 | 13.9% (+86.1)#40 |
| 3. | 99144 | 80.0% | 13.0% (+67.0)#3 | 13.9% (+66.1)#73 |
| 4. | 98827 | 50.4% | 13.0% (+37.4)#4 | 13.9% (+36.5)#211 |
| 5. | 98430 | 50.0% | 13.0% (+37.0)#5 | 13.9% (+36.1)#213 |
| 6. | 98330 | 50.0% | 13.0% (+37.0)#6 | 13.9% (+36.1)#227 |
| 7. | 99150 | 49.3% | 13.0% (+36.3)#7 | 13.9% (+35.4)#238 |
| 8. | 98859 | 43.7% | 13.0% (+30.6)#8 | 13.9% (+29.7)#322 |
| 9. | 98670 | 42.9% | 13.0% (+29.8)#9 | 13.9% (+28.9)#338 |
| 10. | 99363 | 41.9% | 13.0% (+28.9)#10 | 13.9% (+28.0)#359 |
| 11. | 98305 | 39.8% | 13.0% (+26.7)#11 | 13.9% (+25.8)#405 |
| 12. | 98821 | 38.8% | 13.0% (+25.8)#12 | 13.9% (+24.9)#429 |
| 13. | 98527 | 35.1% | 13.0% (+22.0)#13 | 13.9% (+21.1)#595 |
| 14. | 98588 | 32.0% | 13.0% (+19.0)#14 | 13.9% (+18.1)#778 |
| 15. | 98438 | 30.7% | 13.0% (+17.6)#15 | 13.9% (+16.7)#881 |
| 16. | 99123 | 28.5% | 13.0% (+15.4)#16 | 13.9% (+14.5)#1,123 |
| 17. | 99033 | 26.7% | 13.0% (+13.6)#17 | 13.9% (+12.7)#1,396 |
| 18. | 98325 | 26.6% | 13.0% (+13.6)#18 | 13.9% (+12.7)#1,404 |
| 19. | 99039 | 25.8% | 13.0% (+12.8)#19 | 13.9% (+11.9)#1,548 |
| 20. | 98349 | 25.0% | 13.0% (+12.0)#20 | 13.9% (+11.1)#1,706 |
| 21. | 99158 | 24.9% | 13.0% (+11.9)#21 | 13.9% (+11.0)#1,759 |
| 22. | 98315 | 24.6% | 13.0% (+11.5)#22 | 13.9% (+10.6)#1,844 |
| 23. | 99176 | 24.4% | 13.0% (+11.4)#23 | 13.9% (+10.5)#1,888 |
| 24. | 99147 | 23.8% | 13.0% (+10.8)#24 | 13.9% (+9.87)#2,045 |
| 25. | 99018 | 23.4% | 13.0% (+10.3)#25 | 13.9% (+9.43)#2,190 |
| 26. | 98844 | 22.9% | 13.0% (+9.85)#26 | 13.9% (+8.95)#2,385 |
| 27. | 98616 | 22.7% | 13.0% (+9.69)#27 | 13.9% (+8.79)#2,456 |
| 28. | 98542 | 22.6% | 13.0% (+9.61)#28 | 13.9% (+8.71)#2,492 |
| 29. | 99005 | 22.2% | 13.0% (+9.15)#29 | 13.9% (+8.25)#2,706 |
| 30. | 99203 | 22.2% | 13.0% (+9.13)#30 | 13.9% (+8.23)#2,714 |
| 31. | 98581 | 22.0% | 13.0% (+9.00)#31 | 13.9% (+8.10)#2,784 |
| 32. | 98164 | 21.8% | 13.0% (+8.79)#32 | 13.9% (+7.89)#2,896 |
| 33. | 99118 | 21.7% | 13.0% (+8.62)#33 | 13.9% (+7.72)#2,979 |
| 34. | 99134 | 21.6% | 13.0% (+8.60)#34 | 13.9% (+7.70)#2,994 |
| 35. | 98134 | 21.5% | 13.0% (+8.49)#35 | 13.9% (+7.59)#3,046 |
| 36. | 99170 | 21.2% | 13.0% (+8.15)#36 | 13.9% (+7.25)#3,248 |
| 37. | 98345 | 21.2% | 13.0% (+8.13)#37 | 13.9% (+7.23)#3,262 |
| 38. | 99011 | 20.9% | 13.0% (+7.90)#38 | 13.9% (+7.00)#3,415 |
| 39. | 99324 | 20.9% | 13.0% (+7.86)#39 | 13.9% (+6.96)#3,443 |
| 40. | 98569 | 20.2% | 13.0% (+7.15)#40 | 13.9% (+6.25)#3,944 |
| 41. | 99223 | 20.1% | 13.0% (+7.09)#41 | 13.9% (+6.19)#3,980 |
| 42. | 99115 | 20.1% | 13.0% (+7.06)#42 | 13.9% (+6.16)#4,005 |
| 43. | 98829 | 19.8% | 13.0% (+6.81)#43 | 13.9% (+5.91)#4,197 |
| 44. | 99202 | 19.7% | 13.0% (+6.69)#44 | 13.9% (+5.79)#4,291 |
| 45. | 98224 | 19.6% | 13.0% (+6.61)#45 | 13.9% (+5.71)#4,364 |
| 46. | 98841 | 19.6% | 13.0% (+6.53)#46 | 13.9% (+5.63)#4,432 |
| 47. | 99141 | 19.4% | 13.0% (+6.38)#47 | 13.9% (+5.48)#4,589 |
| 48. | 99217 | 19.4% | 13.0% (+6.32)#48 | 13.9% (+5.42)#4,644 |
| 49. | 98407 | 19.1% | 13.0% (+6.11)#49 | 13.9% (+5.21)#4,841 |
| 50. | 98465 | 19.1% | 13.0% (+6.06)#50 | 13.9% (+5.16)#4,886 |
| 51. | 98297 | 19.0% | 13.0% (+6.01)#51 | 13.9% (+5.11)#4,947 |
| 52. | 99224 | 19.0% | 13.0% (+5.91)#52 | 13.9% (+5.01)#5,035 |
| 53. | 98274 | 18.9% | 13.0% (+5.87)#53 | 13.9% (+4.98)#5,087 |
| 54. | 99016 | 18.9% | 13.0% (+5.86)#54 | 13.9% (+4.97)#5,097 |
| 55. | 99019 | 18.9% | 13.0% (+5.84)#55 | 13.9% (+4.94)#5,115 |
| 56. | 99155 | 18.5% | 13.0% (+5.44)#56 | 13.9% (+4.55)#5,568 |
| 57. | 98592 | 18.5% | 13.0% (+5.44)#57 | 13.9% (+4.54)#5,581 |
| 58. | 98620 | 18.4% | 13.0% (+5.40)#58 | 13.9% (+4.50)#5,643 |
| 59. | 99208 | 18.4% | 13.0% (+5.40)#59 | 13.9% (+4.50)#5,645 |
| 60. | 98303 | 18.3% | 13.0% (+5.22)#60 | 13.9% (+4.33)#5,860 |
| 61. | 98335 | 18.2% | 13.0% (+5.19)#61 | 13.9% (+4.29)#5,910 |
| 62. | 98824 | 18.2% | 13.0% (+5.14)#62 | 13.9% (+4.25)#5,969 |
| 63. | 98368 | 18.1% | 13.0% (+5.10)#63 | 13.9% (+4.21)#6,019 |
| 64. | 98506 | 18.0% | 13.0% (+5.01)#64 | 13.9% (+4.11)#6,124 |
| 65. | 98363 | 17.9% | 13.0% (+4.88)#65 | 13.9% (+3.98)#6,300 |
| 66. | 98433 | 17.9% | 13.0% (+4.83)#66 | 13.9% (+3.93)#6,366 |
| 67. | 99204 | 17.8% | 13.0% (+4.81)#67 | 13.9% (+3.91)#6,397 |
| 68. | 98577 | 17.8% | 13.0% (+4.73)#68 | 13.9% (+3.83)#6,519 |
| 69. | 98388 | 17.7% | 13.0% (+4.70)#69 | 13.9% (+3.80)#6,570 |
| 70. | 98612 | 17.7% | 13.0% (+4.64)#70 | 13.9% (+3.74)#6,665 |
| 71. | 98036 | 17.5% | 13.0% (+4.49)#71 | 13.9% (+3.60)#6,883 |
| 72. | 98828 | 17.4% | 13.0% (+4.37)#72 | 13.9% (+3.47)#7,087 |
| 73. | 98649 | 17.4% | 13.0% (+4.34)#73 | 13.9% (+3.44)#7,127 |
| 74. | 98801 | 17.3% | 13.0% (+4.31)#74 | 13.9% (+3.41)#7,176 |
| 75. | 99403 | 17.3% | 13.0% (+4.24)#75 | 13.9% (+3.34)#7,264 |
| 76. | 99218 | 17.3% | 13.0% (+4.21)#76 | 13.9% (+3.32)#7,301 |
| 77. | 99216 | 17.2% | 13.0% (+4.21)#77 | 13.9% (+3.31)#7,309 |
| 78. | 98362 | 17.2% | 13.0% (+4.16)#78 | 13.9% (+3.26)#7,391 |
| 79. | 99027 | 17.2% | 13.0% (+4.14)#79 | 13.9% (+3.24)#7,427 |
| 80. | 98444 | 17.1% | 13.0% (+4.08)#80 | 13.9% (+3.18)#7,528 |
| 81. | 98498 | 17.1% | 13.0% (+4.06)#81 | 13.9% (+3.16)#7,566 |
| 82. | 98178 | 17.0% | 13.0% (+3.93)#82 | 13.9% (+3.03)#7,774 |
| 83. | 99026 | 16.9% | 13.0% (+3.85)#83 | 13.9% (+2.96)#7,890 |
| 84. | 98467 | 16.9% | 13.0% (+3.84)#84 | 13.9% (+2.94)#7,925 |
| 85. | 99022 | 16.8% | 13.0% (+3.75)#85 | 13.9% (+2.86)#8,053 |
| 86. | 98593 | 16.8% | 13.0% (+3.75)#86 | 13.9% (+2.85)#8,057 |
| 87. | 98087 | 16.8% | 13.0% (+3.75)#87 | 13.9% (+2.85)#8,065 |
| 88. | 99013 | 16.8% | 13.0% (+3.74)#88 | 13.9% (+2.84)#8,089 |
| 89. | 98051 | 16.7% | 13.0% (+3.70)#89 | 13.9% (+2.80)#8,145 |
| 90. | 98640 | 16.7% | 13.0% (+3.67)#90 | 13.9% (+2.78)#8,172 |
| 91. | 98001 | 16.6% | 13.0% (+3.59)#91 | 13.9% (+2.69)#8,337 |
| 92. | 98446 | 16.6% | 13.0% (+3.57)#92 | 13.9% (+2.67)#8,360 |
| 93. | 99117 | 16.6% | 13.0% (+3.54)#93 | 13.9% (+2.64)#8,409 |
| 94. | 99004 | 16.5% | 13.0% (+3.45)#94 | 13.9% (+2.55)#8,591 |
| 95. | 98031 | 16.5% | 13.0% (+3.44)#95 | 13.9% (+2.54)#8,604 |
| 96. | 99137 | 16.5% | 13.0% (+3.43)#96 | 13.9% (+2.53)#8,615 |
| 97. | 99205 | 16.4% | 13.0% (+3.41)#97 | 13.9% (+2.51)#8,655 |
| 98. | 98405 | 16.4% | 13.0% (+3.38)#98 | 13.9% (+2.48)#8,706 |
| 99. | 98332 | 16.4% | 13.0% (+3.38)#99 | 13.9% (+2.48)#8,711 |
| 100. | 98239 | 16.4% | 13.0% (+3.36)#100 | 13.9% (+2.47)#8,735 |
Common Questions
What are the Top 10 Zip Codes with the Highest Percentage of Population Employed in Health Care & Social Assistance in Washington?
Top 10 Zip Codes with the Highest Percentage of Population Employed in Health Care & Social Assistance in Washington are:
What zip code has the Highest Percentage of Population Employed in Health Care & Social Assistance in Washington?
98558 has the Highest Percentage of Population Employed in Health Care & Social Assistance in Washington with 100.0%.
What is the Percentage of Population Employed in Health Care & Social Assistance in the State of Washington?
Percentage of Population Employed in Health Care & Social Assistance in Washington is 13.0%.
What is the Percentage of Population Employed in Health Care & Social Assistance in the United States?
Percentage of Population Employed in Health Care & Social Assistance in the United States is 13.9%.