Cities with the Highest Percentage of Armenian Population in Massachusetts
RELATED REPORTS & OPTIONS
Armenian
Massachusetts
Compare Cities
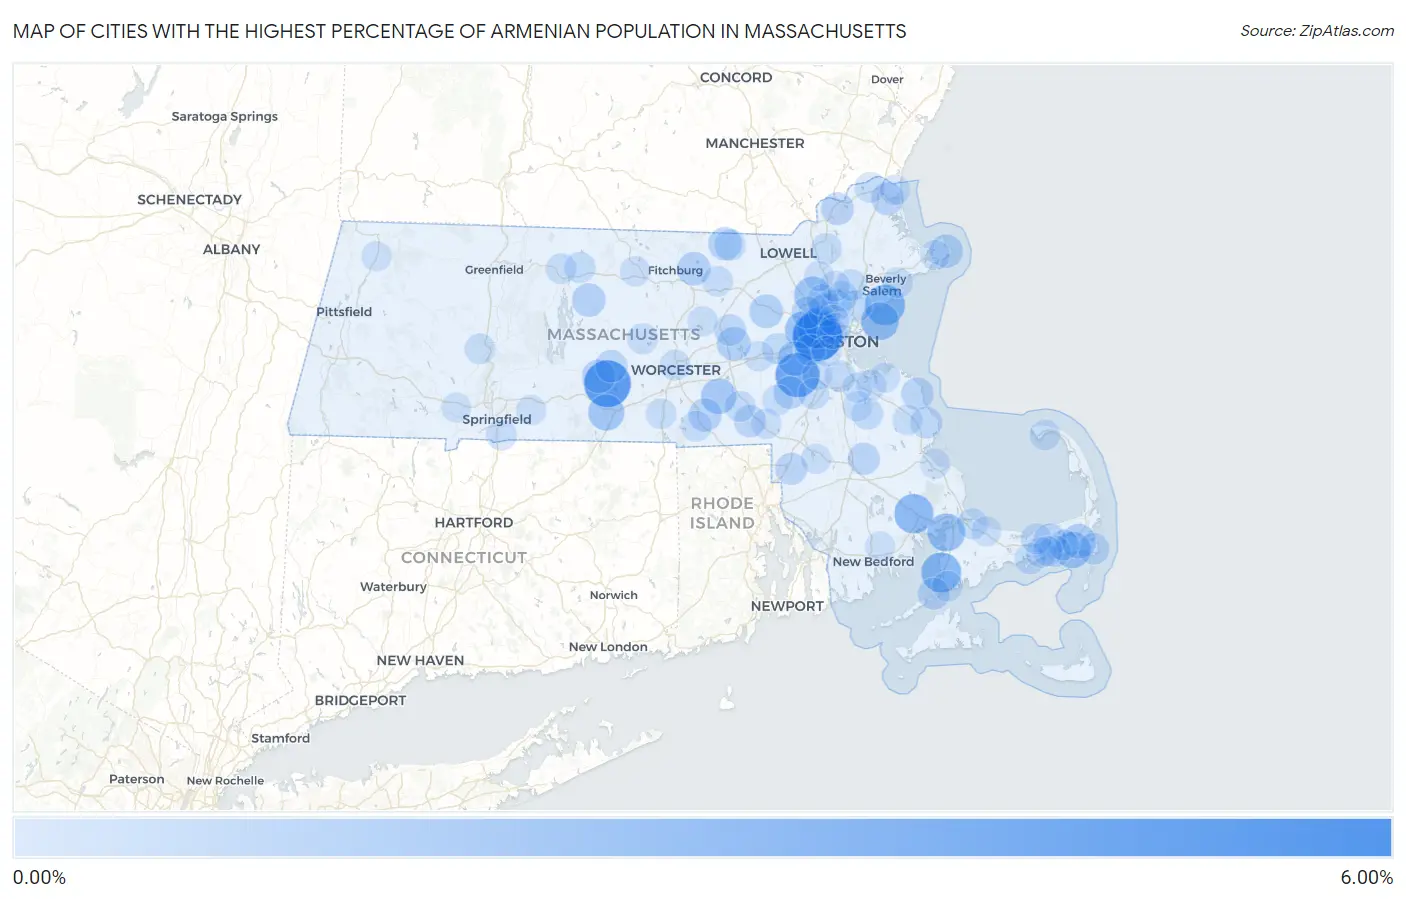
Map of Cities with the Highest Percentage of Armenian Population in Massachusetts
0.00%
6.00%
Cities with the Highest Percentage of Armenian Population in Massachusetts
| City | Armenian | vs State | vs National | |
| 1. | Watertown Town | 5.41% | 0.39%(+5.02)#1 | 0.14%(+5.27)#25 |
| 2. | Brookfield | 4.64% | 0.39%(+4.25)#2 | 0.14%(+4.50)#36 |
| 3. | Dover | 3.94% | 0.39%(+3.55)#3 | 0.14%(+3.80)#49 |
| 4. | Swampscott | 2.89% | 0.39%(+2.50)#4 | 0.14%(+2.75)#68 |
| 5. | West Falmouth | 2.79% | 0.39%(+2.40)#5 | 0.14%(+2.65)#70 |
| 6. | Belmont | 2.74% | 0.39%(+2.35)#6 | 0.14%(+2.60)#74 |
| 7. | West Wareham | 2.61% | 0.39%(+2.22)#7 | 0.14%(+2.47)#80 |
| 8. | Bourne | 2.24% | 0.39%(+1.85)#8 | 0.14%(+2.11)#96 |
| 9. | Nahant | 2.19% | 0.39%(+1.80)#9 | 0.14%(+2.05)#101 |
| 10. | Waltham | 2.14% | 0.39%(+1.75)#10 | 0.14%(+2.00)#103 |
| 11. | Burlington | 1.94% | 0.39%(+1.55)#11 | 0.14%(+1.80)#123 |
| 12. | Harwich Port | 1.87% | 0.39%(+1.47)#12 | 0.14%(+1.73)#129 |
| 13. | Fiskdale | 1.80% | 0.39%(+1.41)#13 | 0.14%(+1.67)#139 |
| 14. | Upton | 1.62% | 0.39%(+1.23)#14 | 0.14%(+1.48)#161 |
| 15. | Wellesley | 1.40% | 0.39%(+1.01)#15 | 0.14%(+1.27)#199 |
| 16. | East Harwich | 1.37% | 0.39%(+0.978)#16 | 0.14%(+1.23)#206 |
| 17. | Marlborough | 1.17% | 0.39%(+0.775)#17 | 0.14%(+1.03)#251 |
| 18. | West Concord | 1.13% | 0.39%(+0.739)#18 | 0.14%(+0.995)#263 |
| 19. | Lunenburg | 1.12% | 0.39%(+0.724)#19 | 0.14%(+0.980)#268 |
| 20. | West Brookfield | 1.11% | 0.39%(+0.717)#20 | 0.14%(+0.973)#270 |
| 21. | Rockport | 1.09% | 0.39%(+0.700)#21 | 0.14%(+0.955)#274 |
| 22. | Petersham | 1.09% | 0.39%(+0.699)#22 | 0.14%(+0.954)#275 |
| 23. | Arlington | 1.04% | 0.39%(+0.651)#23 | 0.14%(+0.906)#291 |
| 24. | Pepperell | 1.04% | 0.39%(+0.651)#24 | 0.14%(+0.906)#293 |
| 25. | Whitinsville | 1.00% | 0.39%(+0.611)#25 | 0.14%(+0.867)#310 |
| 26. | Winchester | 1.00% | 0.39%(+0.603)#26 | 0.14%(+0.858)#317 |
| 27. | South Dennis | 0.97% | 0.39%(+0.575)#27 | 0.14%(+0.830)#335 |
| 28. | Haverhill | 0.89% | 0.39%(+0.503)#28 | 0.14%(+0.758)#366 |
| 29. | Newburyport | 0.88% | 0.39%(+0.485)#29 | 0.14%(+0.740)#377 |
| 30. | Medfield | 0.87% | 0.39%(+0.478)#30 | 0.14%(+0.734)#378 |
| 31. | North Brookfield | 0.82% | 0.39%(+0.428)#31 | 0.14%(+0.684)#403 |
| 32. | Scituate | 0.79% | 0.39%(+0.398)#32 | 0.14%(+0.653)#422 |
| 33. | Bridgewater Town | 0.75% | 0.39%(+0.361)#33 | 0.14%(+0.617)#439 |
| 34. | Attleboro | 0.74% | 0.39%(+0.343)#34 | 0.14%(+0.598)#452 |
| 35. | Bellingham | 0.71% | 0.39%(+0.320)#35 | 0.14%(+0.575)#475 |
| 36. | Lexington | 0.71% | 0.39%(+0.318)#36 | 0.14%(+0.573)#477 |
| 37. | Woods Hole | 0.71% | 0.39%(+0.313)#37 | 0.14%(+0.569)#480 |
| 38. | Marshfield | 0.68% | 0.39%(+0.286)#38 | 0.14%(+0.541)#498 |
| 39. | Hudson | 0.67% | 0.39%(+0.279)#39 | 0.14%(+0.534)#504 |
| 40. | Chatham | 0.61% | 0.39%(+0.219)#40 | 0.14%(+0.474)#561 |
| 41. | North Attleborough | 0.58% | 0.39%(+0.187)#41 | 0.14%(+0.442)#596 |
| 42. | Dennis Port | 0.58% | 0.39%(+0.183)#42 | 0.14%(+0.439)#605 |
| 43. | Somerville | 0.57% | 0.39%(+0.178)#43 | 0.14%(+0.433)#611 |
| 44. | Abington | 0.56% | 0.39%(+0.166)#44 | 0.14%(+0.422)#619 |
| 45. | East Pepperell | 0.55% | 0.39%(+0.158)#45 | 0.14%(+0.413)#628 |
| 46. | Saugus | 0.55% | 0.39%(+0.157)#46 | 0.14%(+0.413)#631 |
| 47. | Cochituate | 0.53% | 0.39%(+0.141)#47 | 0.14%(+0.396)#647 |
| 48. | Stoneham | 0.53% | 0.39%(+0.138)#48 | 0.14%(+0.394)#652 |
| 49. | Lynnfield | 0.53% | 0.39%(+0.134)#49 | 0.14%(+0.389)#655 |
| 50. | Milton | 0.52% | 0.39%(+0.128)#50 | 0.14%(+0.383)#664 |
| 51. | Woburn | 0.51% | 0.39%(+0.120)#51 | 0.14%(+0.375)#670 |
| 52. | Andover | 0.51% | 0.39%(+0.117)#52 | 0.14%(+0.373)#674 |
| 53. | West Yarmouth | 0.51% | 0.39%(+0.116)#53 | 0.14%(+0.371)#675 |
| 54. | Norwood | 0.50% | 0.39%(+0.112)#54 | 0.14%(+0.367)#679 |
| 55. | Athol | 0.49% | 0.39%(+0.100)#55 | 0.14%(+0.355)#694 |
| 56. | Sandwich | 0.47% | 0.39%(+0.083)#56 | 0.14%(+0.338)#716 |
| 57. | Newton | 0.47% | 0.39%(+0.075)#57 | 0.14%(+0.330)#729 |
| 58. | Milford | 0.46% | 0.39%(+0.065)#58 | 0.14%(+0.320)#748 |
| 59. | Northwest Harwich | 0.44% | 0.39%(+0.049)#59 | 0.14%(+0.305)#768 |
| 60. | East Douglas | 0.43% | 0.39%(+0.037)#60 | 0.14%(+0.292)#796 |
| 61. | Longmeadow | 0.42% | 0.39%(+0.026)#61 | 0.14%(+0.281)#812 |
| 62. | Wakefield | 0.42% | 0.39%(+0.025)#62 | 0.14%(+0.281)#813 |
| 63. | Rutland | 0.41% | 0.39%(+0.022)#63 | 0.14%(+0.277)#823 |
| 64. | Worcester | 0.41% | 0.39%(+0.017)#64 | 0.14%(+0.272)#837 |
| 65. | Devens | 0.40% | 0.39%(+0.005)#65 | 0.14%(+0.260)#858 |
| 66. | South Yarmouth | 0.39% | 0.39%(-0.003)#66 | 0.14%(+0.253)#874 |
| 67. | Falmouth | 0.39% | 0.39%(-0.006)#67 | 0.14%(+0.249)#881 |
| 68. | Yarmouth Port | 0.39% | 0.39%(-0.007)#68 | 0.14%(+0.248)#885 |
| 69. | Provincetown | 0.38% | 0.39%(-0.014)#69 | 0.14%(+0.242)#901 |
| 70. | Orange | 0.38% | 0.39%(-0.017)#70 | 0.14%(+0.238)#911 |
| 71. | Northampton | 0.37% | 0.39%(-0.024)#71 | 0.14%(+0.231)#932 |
| 72. | Millis Clicquot | 0.36% | 0.39%(-0.032)#72 | 0.14%(+0.223)#949 |
| 73. | Amesbury Town | 0.35% | 0.39%(-0.039)#73 | 0.14%(+0.216)#964 |
| 74. | Beverly | 0.35% | 0.39%(-0.041)#74 | 0.14%(+0.214)#970 |
| 75. | Oxford | 0.35% | 0.39%(-0.041)#75 | 0.14%(+0.214)#971 |
| 76. | Reading | 0.35% | 0.39%(-0.042)#76 | 0.14%(+0.213)#974 |
| 77. | Franklin Town | 0.33% | 0.39%(-0.060)#77 | 0.14%(+0.196)#1,010 |
| 78. | Cambridge | 0.33% | 0.39%(-0.061)#78 | 0.14%(+0.194)#1,012 |
| 79. | North Pembroke | 0.33% | 0.39%(-0.064)#79 | 0.14%(+0.192)#1,017 |
| 80. | Dedham | 0.33% | 0.39%(-0.066)#80 | 0.14%(+0.189)#1,023 |
| 81. | Weymouth Town | 0.32% | 0.39%(-0.075)#81 | 0.14%(+0.181)#1,047 |
| 82. | Medford | 0.29% | 0.39%(-0.104)#82 | 0.14%(+0.151)#1,126 |
| 83. | Gardner | 0.28% | 0.39%(-0.113)#83 | 0.14%(+0.143)#1,156 |
| 84. | Brookline | 0.28% | 0.39%(-0.115)#84 | 0.14%(+0.141)#1,162 |
| 85. | Clinton | 0.27% | 0.39%(-0.121)#85 | 0.14%(+0.135)#1,173 |
| 86. | Norton Center | 0.27% | 0.39%(-0.121)#86 | 0.14%(+0.134)#1,175 |
| 87. | Salisbury | 0.27% | 0.39%(-0.127)#87 | 0.14%(+0.129)#1,203 |
| 88. | Wilbraham | 0.26% | 0.39%(-0.132)#88 | 0.14%(+0.123)#1,218 |
| 89. | Framingham | 0.26% | 0.39%(-0.135)#89 | 0.14%(+0.121)#1,226 |
| 90. | Holbrook | 0.26% | 0.39%(-0.137)#90 | 0.14%(+0.119)#1,241 |
| 91. | Wilmington | 0.25% | 0.39%(-0.147)#91 | 0.14%(+0.109)#1,279 |
| 92. | East Sandwich | 0.24% | 0.39%(-0.155)#92 | 0.14%(+0.101)#1,304 |
| 93. | Braintree Town | 0.24% | 0.39%(-0.155)#93 | 0.14%(+0.100)#1,306 |
| 94. | Hingham | 0.23% | 0.39%(-0.160)#94 | 0.14%(+0.095)#1,325 |
| 95. | Westfield | 0.23% | 0.39%(-0.164)#95 | 0.14%(+0.091)#1,340 |
| 96. | Gloucester | 0.23% | 0.39%(-0.164)#96 | 0.14%(+0.091)#1,341 |
| 97. | Adams | 0.23% | 0.39%(-0.165)#97 | 0.14%(+0.090)#1,345 |
| 98. | Plymouth | 0.22% | 0.39%(-0.170)#98 | 0.14%(+0.085)#1,371 |
| 99. | Acushnet Center | 0.22% | 0.39%(-0.171)#99 | 0.14%(+0.084)#1,376 |
| 100. | West Dennis | 0.22% | 0.39%(-0.173)#100 | 0.14%(+0.083)#1,382 |
Common Questions
What are the Top 10 Cities with the Highest Percentage of Armenian Population in Massachusetts?
Top 10 Cities with the Highest Percentage of Armenian Population in Massachusetts are:
#1
5.41%
#2
4.64%
#3
3.94%
#4
2.89%
#5
2.79%
#6
2.74%
#7
2.61%
#8
2.24%
#9
2.19%
#10
2.14%
What city has the Highest Percentage of Armenian Population in Massachusetts?
Watertown Town has the Highest Percentage of Armenian Population in Massachusetts with 5.41%.
What is the Percentage of Armenian Population in the State of Massachusetts?
Percentage of Armenian Population in Massachusetts is 0.39%.
What is the Percentage of Armenian Population in the United States?
Percentage of Armenian Population in the United States is 0.14%.