Cities with the Highest Percentage of Armenian Population in the United States
RELATED REPORTS & OPTIONS
Armenian
United States
Compare Cities
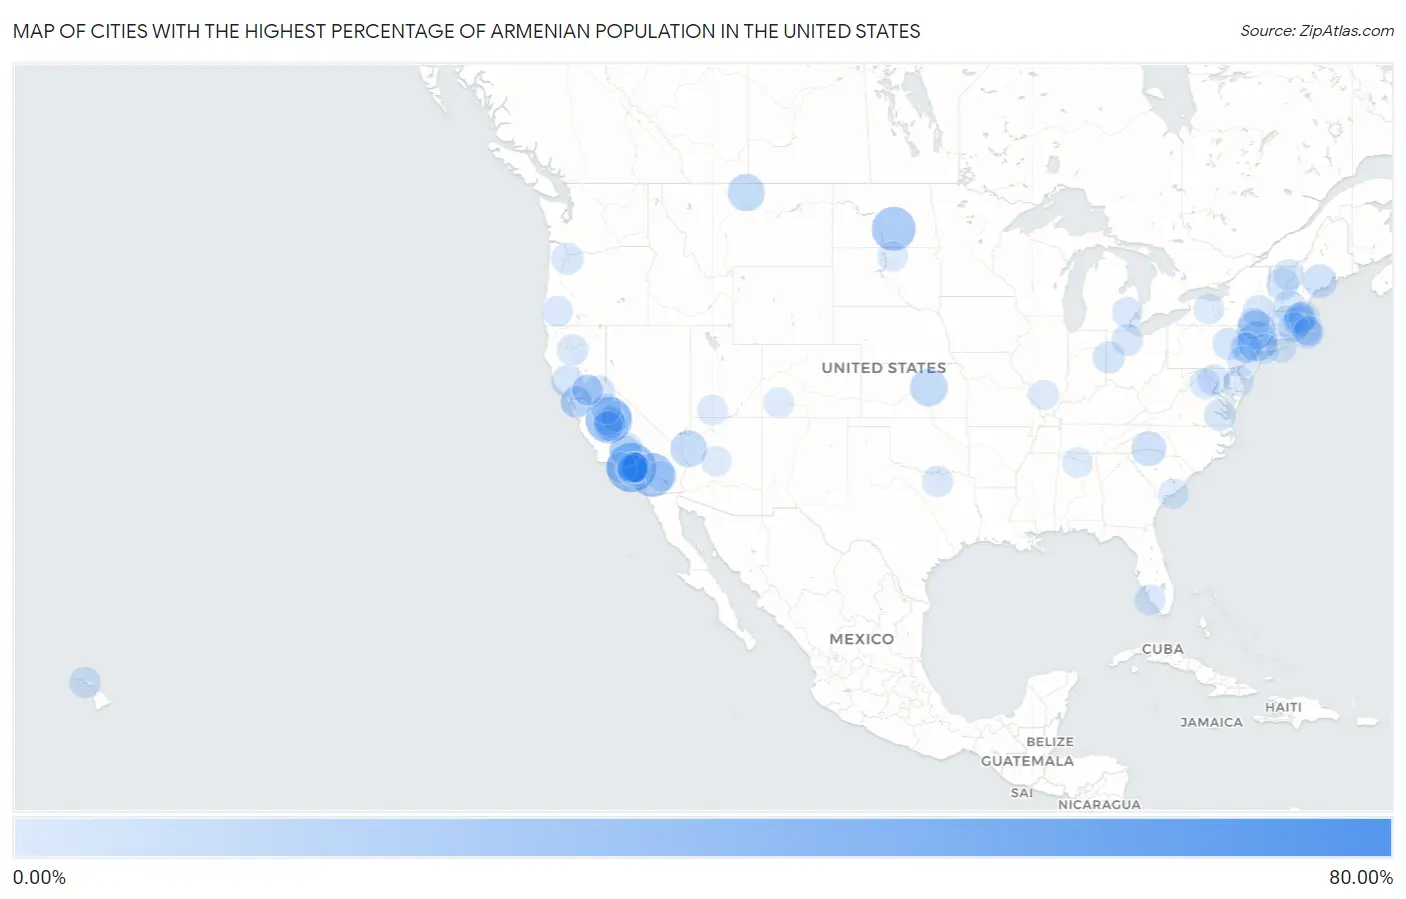
Map of Cities with the Highest Percentage of Armenian Population in the United States
0.00%
80.00%
Cities with the Highest Percentage of Armenian Population in the United States
| City | Armenian | vs State | vs National | |
| 1. | Strawberry Cdp Tuolumne County | 71.88% | 0.63%(+71.2)#1 | 0.14%(+71.7)#1 |
| 2. | Glendale | 34.51% | 0.63%(+33.9)#2 | 0.14%(+34.4)#2 |
| 3. | Fort Washington | 29.11% | 0.63%(+28.5)#3 | 0.14%(+29.0)#3 |
| 4. | Algiers | 27.43% | 0.099%(+27.3)#1 | 0.14%(+27.3)#4 |
| 5. | Dawson | 25.00% | 0.0098%(+25.0)#1 | 0.14%(+24.9)#5 |
| 6. | Mountain Center | 25.00% | 0.63%(+24.4)#4 | 0.14%(+24.9)#6 |
| 7. | Tuxedo Park | 17.57% | 0.12%(+17.4)#1 | 0.14%(+17.4)#7 |
| 8. | Olde Stockdale | 16.02% | 0.63%(+15.4)#5 | 0.14%(+15.9)#8 |
| 9. | Kerhonkson | 15.85% | 0.12%(+15.7)#2 | 0.14%(+15.7)#9 |
| 10. | Carlton | 14.29% | 0.020%(+14.3)#1 | 0.14%(+14.1)#10 |
| 11. | Kremlin | 13.64% | 0.065%(+13.6)#1 | 0.14%(+13.5)#11 |
| 12. | Lisbon | 12.90% | 0.068%(+12.8)#1 | 0.14%(+12.8)#12 |
| 13. | So Hi | 12.84% | 0.075%(+12.8)#1 | 0.14%(+12.7)#13 |
| 14. | Tyner | 12.77% | 0.022%(+12.8)#1 | 0.14%(+12.6)#14 |
| 15. | Henrietta | 9.68% | 0.036%(+9.64)#1 | 0.14%(+9.54)#15 |
| 16. | Woodbourne | 9.19% | 0.12%(+9.07)#3 | 0.14%(+9.05)#16 |
| 17. | Rose Hills | 7.84% | 0.63%(+7.21)#6 | 0.14%(+7.70)#17 |
| 18. | Farmingdale | 7.77% | 0.11%(+7.67)#1 | 0.14%(+7.64)#18 |
| 19. | La Crescenta Montrose | 7.19% | 0.63%(+6.57)#7 | 0.14%(+7.05)#19 |
| 20. | Altadena | 6.86% | 0.63%(+6.24)#8 | 0.14%(+6.73)#20 |
| 21. | Keene | 6.44% | 0.63%(+5.81)#9 | 0.14%(+6.30)#21 |
| 22. | La Canada Flintridge | 5.78% | 0.63%(+5.15)#10 | 0.14%(+5.64)#22 |
| 23. | East Barre | 5.72% | 0.099%(+5.62)#2 | 0.14%(+5.58)#23 |
| 24. | Clearlake Oaks | 5.64% | 0.63%(+5.02)#11 | 0.14%(+5.50)#24 |
| 25. | Watertown Town | 5.41% | 0.39%(+5.02)#1 | 0.14%(+5.27)#25 |
| 26. | New Weston | 5.38% | 0.042%(+5.33)#1 | 0.14%(+5.24)#26 |
| 27. | Foundryville | 5.21% | 0.075%(+5.13)#1 | 0.14%(+5.07)#27 |
| 28. | Duane Lake | 5.07% | 0.12%(+4.95)#4 | 0.14%(+4.93)#28 |
| 29. | Buckhorn | 5.04% | 0.63%(+4.41)#12 | 0.14%(+4.90)#29 |
| 30. | Hancock | 5.03% | 0.26%(+4.76)#1 | 0.14%(+4.89)#30 |
| 31. | Hartland | 4.97% | 0.13%(+4.84)#1 | 0.14%(+4.83)#31 |
| 32. | Surry | 4.95% | 0.079%(+4.88)#1 | 0.14%(+4.82)#32 |
| 33. | Quasset Lake | 4.92% | 0.14%(+4.78)#1 | 0.14%(+4.78)#33 |
| 34. | Stafford | 4.66% | 0.079%(+4.58)#1 | 0.14%(+4.52)#34 |
| 35. | San Pasqual | 4.65% | 0.63%(+4.03)#13 | 0.14%(+4.52)#35 |
| 36. | Brookfield | 4.64% | 0.39%(+4.25)#2 | 0.14%(+4.50)#36 |
| 37. | East Burke | 4.55% | 0.099%(+4.45)#3 | 0.14%(+4.41)#37 |
| 38. | Olowalu | 4.55% | 0.022%(+4.52)#1 | 0.14%(+4.41)#38 |
| 39. | Kingsburg | 4.48% | 0.63%(+3.85)#14 | 0.14%(+4.34)#39 |
| 40. | Pine Hill | 4.44% | 0.12%(+4.32)#5 | 0.14%(+4.31)#40 |
| 41. | Shell Ridge | 4.42% | 0.63%(+3.79)#15 | 0.14%(+4.28)#41 |
| 42. | Kansas | 4.35% | 0.042%(+4.31)#2 | 0.14%(+4.21)#42 |
| 43. | East Pasadena | 4.27% | 0.63%(+3.65)#16 | 0.14%(+4.14)#43 |
| 44. | Fowler | 4.27% | 0.63%(+3.64)#17 | 0.14%(+4.13)#44 |
| 45. | Sunnyside | 4.18% | 0.63%(+3.56)#18 | 0.14%(+4.05)#45 |
| 46. | Stallion Springs | 4.13% | 0.63%(+3.51)#19 | 0.14%(+3.99)#46 |
| 47. | Mountain Gate | 4.03% | 0.63%(+3.40)#20 | 0.14%(+3.89)#47 |
| 48. | Milltown Borough | 3.99% | 0.16%(+3.83)#1 | 0.14%(+3.85)#48 |
| 49. | Dover | 3.94% | 0.39%(+3.55)#3 | 0.14%(+3.80)#49 |
| 50. | Darnestown | 3.61% | 0.068%(+3.54)#2 | 0.14%(+3.48)#50 |
| 51. | Shaver Lake | 3.59% | 0.63%(+2.97)#21 | 0.14%(+3.46)#51 |
| 52. | Old Tappan Borough | 3.56% | 0.16%(+3.41)#2 | 0.14%(+3.43)#52 |
| 53. | Milbridge | 3.53% | 0.11%(+3.43)#2 | 0.14%(+3.40)#53 |
| 54. | Rolling Hills | 3.53% | 0.63%(+2.90)#22 | 0.14%(+3.39)#54 |
| 55. | Beaver Meadows Borough | 3.50% | 0.075%(+3.42)#2 | 0.14%(+3.36)#55 |
| 56. | Weston | 3.48% | 0.022%(+3.46)#1 | 0.14%(+3.34)#56 |
| 57. | Saunders Lake | 3.45% | 0.079%(+3.38)#2 | 0.14%(+3.32)#57 |
| 58. | Castle Hill | 3.37% | 0.63%(+2.74)#23 | 0.14%(+3.23)#58 |
| 59. | Bayview Cdp Contra Costa County | 3.36% | 0.63%(+2.74)#24 | 0.14%(+3.22)#59 |
| 60. | Mather | 3.31% | 0.63%(+2.68)#25 | 0.14%(+3.17)#60 |
| 61. | Mariposa | 3.30% | 0.63%(+2.68)#26 | 0.14%(+3.16)#61 |
| 62. | Spring Valley Cdp Lake County | 3.26% | 0.63%(+2.64)#27 | 0.14%(+3.13)#62 |
| 63. | Mariah Hill | 3.25% | 0.022%(+3.23)#2 | 0.14%(+3.12)#63 |
| 64. | Lely | 3.24% | 0.057%(+3.18)#1 | 0.14%(+3.10)#64 |
| 65. | Thermal | 3.18% | 0.63%(+2.55)#28 | 0.14%(+3.04)#65 |
| 66. | Lake Angelus | 3.14% | 0.13%(+3.01)#2 | 0.14%(+3.00)#66 |
| 67. | Lake Sherwood | 2.97% | 0.63%(+2.34)#29 | 0.14%(+2.83)#67 |
| 68. | Swampscott | 2.89% | 0.39%(+2.50)#4 | 0.14%(+2.75)#68 |
| 69. | Rancho Cordova | 2.86% | 0.63%(+2.24)#30 | 0.14%(+2.73)#69 |
| 70. | West Falmouth | 2.79% | 0.39%(+2.40)#5 | 0.14%(+2.65)#70 |
| 71. | Glendale | 2.78% | 0.079%(+2.70)#3 | 0.14%(+2.64)#71 |
| 72. | Ophir | 2.78% | 0.082%(+2.70)#1 | 0.14%(+2.64)#72 |
| 73. | Lima | 2.76% | 0.12%(+2.64)#6 | 0.14%(+2.63)#73 |
| 74. | Belmont | 2.74% | 0.39%(+2.35)#6 | 0.14%(+2.60)#74 |
| 75. | Java | 2.72% | 0.013%(+2.71)#1 | 0.14%(+2.58)#75 |
| 76. | Alton | 2.72% | 0.081%(+2.64)#1 | 0.14%(+2.58)#76 |
| 77. | Marshall | 2.67% | 0.079%(+2.59)#2 | 0.14%(+2.53)#77 |
| 78. | Caruthers | 2.67% | 0.63%(+2.04)#31 | 0.14%(+2.53)#78 |
| 79. | Plandome Heights | 2.67% | 0.12%(+2.54)#7 | 0.14%(+2.53)#79 |
| 80. | West Wareham | 2.61% | 0.39%(+2.22)#7 | 0.14%(+2.47)#80 |
| 81. | Montebello | 2.61% | 0.63%(+1.98)#32 | 0.14%(+2.47)#81 |
| 82. | Brookfield | 2.58% | 0.16%(+2.43)#3 | 0.14%(+2.45)#82 |
| 83. | Crouch Mesa | 2.57% | 0.030%(+2.54)#1 | 0.14%(+2.43)#83 |
| 84. | Chepachet | 2.51% | 0.46%(+2.05)#1 | 0.14%(+2.37)#84 |
| 85. | Baywood Park | 2.49% | 0.63%(+1.86)#33 | 0.14%(+2.35)#85 |
| 86. | Vienna | 2.48% | 0.16%(+2.32)#4 | 0.14%(+2.34)#86 |
| 87. | Fort Washington | 2.44% | 0.075%(+2.36)#3 | 0.14%(+2.30)#87 |
| 88. | Governors | 2.43% | 0.036%(+2.40)#2 | 0.14%(+2.30)#88 |
| 89. | Dewey Humboldt | 2.41% | 0.075%(+2.33)#2 | 0.14%(+2.27)#89 |
| 90. | Somerville | 2.38% | 0.0058%(+2.38)#1 | 0.14%(+2.25)#90 |
| 91. | Kiawah Island | 2.35% | 0.051%(+2.30)#1 | 0.14%(+2.21)#91 |
| 92. | Radom | 2.31% | 0.073%(+2.23)#1 | 0.14%(+2.17)#92 |
| 93. | Pasadena | 2.30% | 0.63%(+1.67)#34 | 0.14%(+2.16)#93 |
| 94. | La Verne | 2.29% | 0.63%(+1.66)#35 | 0.14%(+2.15)#94 |
| 95. | Harrington Park Borough | 2.26% | 0.16%(+2.10)#5 | 0.14%(+2.12)#95 |
| 96. | Bourne | 2.24% | 0.39%(+1.85)#8 | 0.14%(+2.11)#96 |
| 97. | Hampton Bays | 2.24% | 0.12%(+2.11)#8 | 0.14%(+2.10)#97 |
| 98. | Brookside | 2.23% | 0.16%(+2.07)#6 | 0.14%(+2.09)#98 |
| 99. | Duarte | 2.20% | 0.63%(+1.58)#36 | 0.14%(+2.07)#99 |
| 100. | Frederica | 2.20% | 0.027%(+2.17)#1 | 0.14%(+2.06)#100 |
Common Questions
What are the Top 10 Cities with the Highest Percentage of Armenian Population in the United States?
Top 10 Cities with the Highest Percentage of Armenian Population in the United States are:
#1
34.51%
#2
29.11%
#3
25.00%
#4
25.00%
#5
17.57%
#6
15.85%
#7
14.29%
#8
13.64%
#9
12.84%
#10
9.68%
What city has the Highest Percentage of Armenian Population in the United States?
Glendale has the Highest Percentage of Armenian Population in the United States with 34.51%.
What is the Percentage of Armenian Population in the United States?
Percentage of Armenian Population in the United States is 0.14%.