Cities with the Highest Percentage of Armenian Population in New York
RELATED REPORTS & OPTIONS
Armenian
New York
Compare Cities
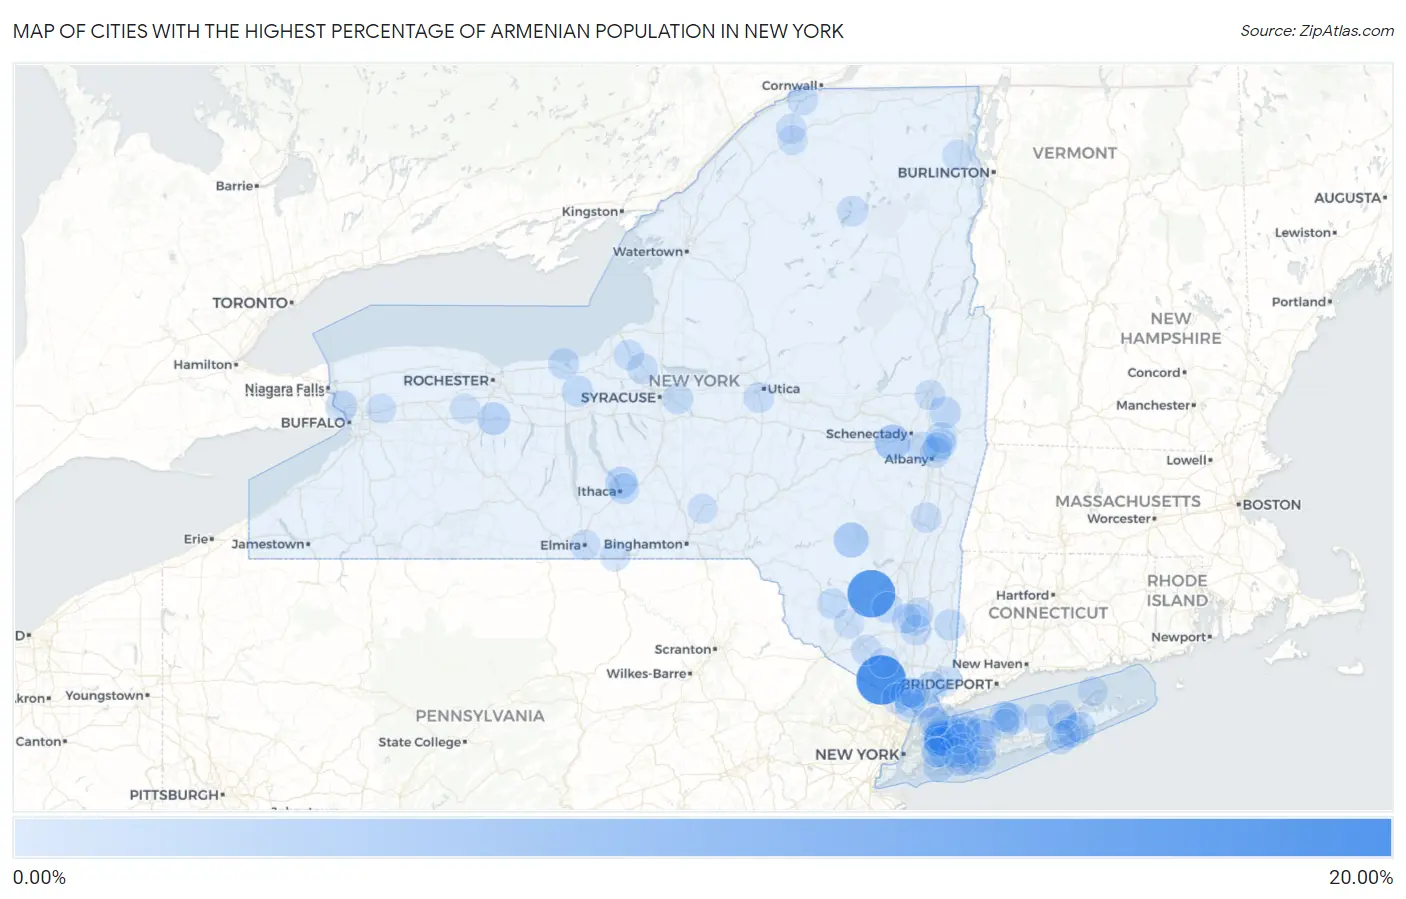
Map of Cities with the Highest Percentage of Armenian Population in New York
0.00%
20.00%
Cities with the Highest Percentage of Armenian Population in New York
| City | Armenian | vs State | vs National | |
| 1. | Tuxedo Park | 17.57% | 0.12%(+17.4)#1 | 0.14%(+17.4)#7 |
| 2. | Kerhonkson | 15.85% | 0.12%(+15.7)#2 | 0.14%(+15.7)#9 |
| 3. | Woodbourne | 9.19% | 0.12%(+9.07)#3 | 0.14%(+9.05)#16 |
| 4. | Duane Lake | 5.07% | 0.12%(+4.95)#4 | 0.14%(+4.93)#28 |
| 5. | Pine Hill | 4.44% | 0.12%(+4.32)#5 | 0.14%(+4.31)#40 |
| 6. | Lima | 2.76% | 0.12%(+2.64)#6 | 0.14%(+2.63)#73 |
| 7. | Plandome Heights | 2.67% | 0.12%(+2.54)#7 | 0.14%(+2.53)#79 |
| 8. | Hampton Bays | 2.24% | 0.12%(+2.11)#8 | 0.14%(+2.10)#97 |
| 9. | Lansing | 2.02% | 0.12%(+1.90)#9 | 0.14%(+1.88)#113 |
| 10. | Garden City | 1.96% | 0.12%(+1.84)#10 | 0.14%(+1.82)#119 |
| 11. | Munsey Park | 1.90% | 0.12%(+1.78)#11 | 0.14%(+1.76)#126 |
| 12. | Chappaqua | 1.88% | 0.12%(+1.76)#12 | 0.14%(+1.75)#127 |
| 13. | Port Jefferson | 1.81% | 0.12%(+1.69)#13 | 0.14%(+1.68)#137 |
| 14. | Stillwater | 1.77% | 0.12%(+1.64)#14 | 0.14%(+1.63)#144 |
| 15. | Grandyle Village | 1.72% | 0.12%(+1.60)#15 | 0.14%(+1.58)#150 |
| 16. | Quiogue | 1.65% | 0.12%(+1.53)#16 | 0.14%(+1.51)#157 |
| 17. | Bardonia | 1.60% | 0.12%(+1.48)#17 | 0.14%(+1.46)#163 |
| 18. | Pawling | 1.58% | 0.12%(+1.46)#18 | 0.14%(+1.45)#165 |
| 19. | Colonie | 1.53% | 0.12%(+1.41)#19 | 0.14%(+1.40)#169 |
| 20. | Tappan | 1.50% | 0.12%(+1.37)#20 | 0.14%(+1.36)#177 |
| 21. | Clyde | 1.48% | 0.12%(+1.36)#21 | 0.14%(+1.35)#181 |
| 22. | Wappingers Falls | 1.42% | 0.12%(+1.30)#22 | 0.14%(+1.28)#194 |
| 23. | Hewlett Bay Park | 1.42% | 0.12%(+1.29)#23 | 0.14%(+1.28)#196 |
| 24. | Plandome | 1.39% | 0.12%(+1.27)#24 | 0.14%(+1.25)#201 |
| 25. | Plainedge | 1.38% | 0.12%(+1.26)#25 | 0.14%(+1.25)#202 |
| 26. | Menands | 1.37% | 0.12%(+1.25)#26 | 0.14%(+1.24)#204 |
| 27. | Sodus Point | 1.37% | 0.12%(+1.25)#27 | 0.14%(+1.23)#207 |
| 28. | Shinnecock Hills | 1.31% | 0.12%(+1.19)#28 | 0.14%(+1.17)#217 |
| 29. | Port Washington North | 1.26% | 0.12%(+1.14)#29 | 0.14%(+1.13)#232 |
| 30. | Gardiner | 1.26% | 0.12%(+1.13)#30 | 0.14%(+1.12)#233 |
| 31. | Fayetteville | 1.22% | 0.12%(+1.10)#31 | 0.14%(+1.09)#239 |
| 32. | Laurel Hollow | 1.22% | 0.12%(+1.10)#32 | 0.14%(+1.08)#242 |
| 33. | Forest Home | 1.17% | 0.12%(+1.05)#33 | 0.14%(+1.04)#250 |
| 34. | Waterford | 1.14% | 0.12%(+1.01)#34 | 0.14%(+0.999)#260 |
| 35. | South Fallsburg | 1.14% | 0.12%(+1.01)#35 | 0.14%(+0.998)#261 |
| 36. | Chestnut Ridge | 1.12% | 0.12%(+0.999)#36 | 0.14%(+0.985)#265 |
| 37. | Old Brookville | 1.09% | 0.12%(+0.968)#37 | 0.14%(+0.954)#276 |
| 38. | Latham | 1.07% | 0.12%(+0.946)#38 | 0.14%(+0.932)#281 |
| 39. | Phoenix | 1.07% | 0.12%(+0.943)#39 | 0.14%(+0.929)#282 |
| 40. | Fishkill | 1.06% | 0.12%(+0.934)#40 | 0.14%(+0.919)#286 |
| 41. | Plandome Manor | 1.05% | 0.12%(+0.930)#41 | 0.14%(+0.916)#288 |
| 42. | Tupper Lake | 1.03% | 0.12%(+0.911)#42 | 0.14%(+0.897)#297 |
| 43. | Port Washington | 1.00% | 0.12%(+0.882)#43 | 0.14%(+0.868)#307 |
| 44. | Washington Mills | 0.99% | 0.12%(+0.872)#44 | 0.14%(+0.858)#318 |
| 45. | Matinecock | 0.99% | 0.12%(+0.870)#45 | 0.14%(+0.856)#321 |
| 46. | New Hamburg | 0.98% | 0.12%(+0.854)#46 | 0.14%(+0.840)#328 |
| 47. | Upper Brookville | 0.96% | 0.12%(+0.834)#47 | 0.14%(+0.820)#343 |
| 48. | Copiague | 0.93% | 0.12%(+0.807)#48 | 0.14%(+0.793)#353 |
| 49. | Massena | 0.93% | 0.12%(+0.807)#49 | 0.14%(+0.793)#354 |
| 50. | Rye | 0.91% | 0.12%(+0.789)#50 | 0.14%(+0.775)#362 |
| 51. | Massapequa | 0.85% | 0.12%(+0.724)#51 | 0.14%(+0.710)#388 |
| 52. | Fulton | 0.84% | 0.12%(+0.721)#52 | 0.14%(+0.707)#389 |
| 53. | Troy | 0.83% | 0.12%(+0.704)#53 | 0.14%(+0.690)#398 |
| 54. | Northville | 0.82% | 0.12%(+0.697)#54 | 0.14%(+0.683)#404 |
| 55. | Goshen | 0.82% | 0.12%(+0.696)#55 | 0.14%(+0.682)#405 |
| 56. | Old Field | 0.78% | 0.12%(+0.661)#56 | 0.14%(+0.647)#424 |
| 57. | Elmira | 0.72% | 0.12%(+0.598)#57 | 0.14%(+0.584)#464 |
| 58. | Peru | 0.72% | 0.12%(+0.596)#58 | 0.14%(+0.582)#466 |
| 59. | Athens | 0.71% | 0.12%(+0.591)#59 | 0.14%(+0.577)#469 |
| 60. | Elmsford | 0.71% | 0.12%(+0.590)#60 | 0.14%(+0.576)#473 |
| 61. | Waverly | 0.69% | 0.12%(+0.565)#61 | 0.14%(+0.551)#489 |
| 62. | Cold Spring Harbor | 0.64% | 0.12%(+0.515)#62 | 0.14%(+0.501)#535 |
| 63. | Orangeburg | 0.63% | 0.12%(+0.509)#63 | 0.14%(+0.495)#539 |
| 64. | Elwood | 0.63% | 0.12%(+0.506)#64 | 0.14%(+0.492)#541 |
| 65. | Norwood | 0.62% | 0.12%(+0.501)#65 | 0.14%(+0.487)#547 |
| 66. | East Meadow | 0.62% | 0.12%(+0.493)#66 | 0.14%(+0.479)#553 |
| 67. | Lloyd Harbor | 0.62% | 0.12%(+0.493)#67 | 0.14%(+0.479)#554 |
| 68. | Roessleville | 0.61% | 0.12%(+0.490)#68 | 0.14%(+0.476)#557 |
| 69. | East Northport | 0.61% | 0.12%(+0.488)#69 | 0.14%(+0.474)#560 |
| 70. | Larchmont | 0.61% | 0.12%(+0.488)#70 | 0.14%(+0.474)#562 |
| 71. | Saratoga Springs | 0.57% | 0.12%(+0.445)#71 | 0.14%(+0.431)#612 |
| 72. | Watervliet | 0.56% | 0.12%(+0.439)#72 | 0.14%(+0.425)#616 |
| 73. | Wading River | 0.56% | 0.12%(+0.433)#73 | 0.14%(+0.419)#622 |
| 74. | Babylon | 0.55% | 0.12%(+0.427)#74 | 0.14%(+0.413)#630 |
| 75. | Red Oaks Mill | 0.53% | 0.12%(+0.409)#75 | 0.14%(+0.395)#649 |
| 76. | Bethpage | 0.49% | 0.12%(+0.369)#76 | 0.14%(+0.355)#695 |
| 77. | Manhasset | 0.48% | 0.12%(+0.356)#77 | 0.14%(+0.342)#708 |
| 78. | Aquebogue | 0.46% | 0.12%(+0.342)#78 | 0.14%(+0.328)#730 |
| 79. | Valley Cottage | 0.46% | 0.12%(+0.340)#79 | 0.14%(+0.326)#733 |
| 80. | Poquott | 0.45% | 0.12%(+0.329)#80 | 0.14%(+0.315)#756 |
| 81. | East Marion | 0.45% | 0.12%(+0.325)#81 | 0.14%(+0.311)#760 |
| 82. | North Babylon | 0.44% | 0.12%(+0.317)#82 | 0.14%(+0.303)#771 |
| 83. | Bedford | 0.44% | 0.12%(+0.316)#83 | 0.14%(+0.302)#777 |
| 84. | East Quogue | 0.43% | 0.12%(+0.304)#84 | 0.14%(+0.290)#800 |
| 85. | Upper Nyack | 0.42% | 0.12%(+0.297)#85 | 0.14%(+0.283)#808 |
| 86. | Potsdam | 0.42% | 0.12%(+0.297)#86 | 0.14%(+0.283)#809 |
| 87. | Caledonia | 0.42% | 0.12%(+0.296)#87 | 0.14%(+0.282)#810 |
| 88. | Floral Park | 0.42% | 0.12%(+0.292)#88 | 0.14%(+0.278)#818 |
| 89. | Wurtsboro | 0.41% | 0.12%(+0.288)#89 | 0.14%(+0.274)#835 |
| 90. | Roslyn | 0.41% | 0.12%(+0.287)#90 | 0.14%(+0.273)#836 |
| 91. | Bellerose | 0.40% | 0.12%(+0.277)#91 | 0.14%(+0.263)#851 |
| 92. | Mamaroneck | 0.40% | 0.12%(+0.273)#92 | 0.14%(+0.259)#860 |
| 93. | Clarence | 0.40% | 0.12%(+0.273)#93 | 0.14%(+0.259)#861 |
| 94. | Monroe | 0.39% | 0.12%(+0.270)#94 | 0.14%(+0.256)#869 |
| 95. | Wantagh | 0.39% | 0.12%(+0.266)#95 | 0.14%(+0.252)#877 |
| 96. | Stony Brook University | 0.39% | 0.12%(+0.265)#96 | 0.14%(+0.251)#878 |
| 97. | Marlboro | 0.39% | 0.12%(+0.262)#97 | 0.14%(+0.248)#886 |
| 98. | Commack | 0.38% | 0.12%(+0.260)#98 | 0.14%(+0.246)#890 |
| 99. | Syosset | 0.38% | 0.12%(+0.260)#99 | 0.14%(+0.246)#891 |
| 100. | Greene | 0.38% | 0.12%(+0.258)#100 | 0.14%(+0.244)#898 |
Common Questions
What are the Top 10 Cities with the Highest Percentage of Armenian Population in New York?
Top 10 Cities with the Highest Percentage of Armenian Population in New York are:
#1
17.57%
#2
15.85%
#3
5.07%
#4
4.44%
#5
2.76%
#6
2.67%
#7
2.24%
#8
2.02%
#9
1.96%
#10
1.90%
What city has the Highest Percentage of Armenian Population in New York?
Tuxedo Park has the Highest Percentage of Armenian Population in New York with 17.57%.
What is the Percentage of Armenian Population in the State of New York?
Percentage of Armenian Population in New York is 0.12%.
What is the Percentage of Armenian Population in the United States?
Percentage of Armenian Population in the United States is 0.14%.