Cities with the Lowest Unemployment Rate in Connecticut
RELATED REPORTS & OPTIONS
Lowest Unemployment
Connecticut
Compare Cities
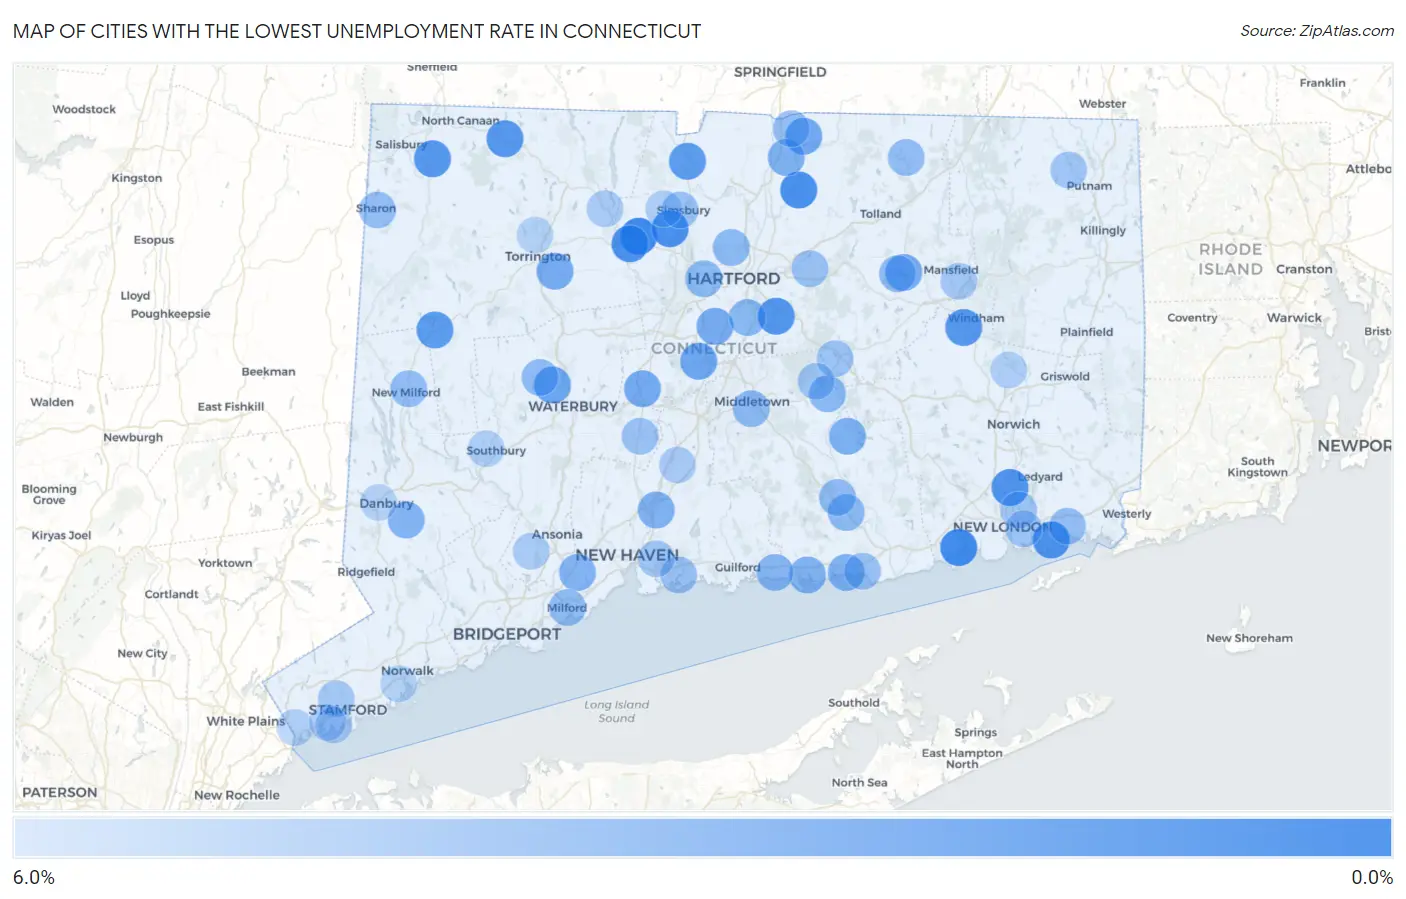
Map of Cities with the Lowest Unemployment Rate in Connecticut
6.0%
0.0%
Cities with the Lowest Unemployment Rate in Connecticut
| City | Unemployment Rate | vs State | vs National | |
| 1. | Stepney | 0.10% | 5.6%(-5.50)#1 | 5.0%(-4.90)#6 |
| 2. | Canton Valley | 0.40% | 5.6%(-5.20)#2 | 5.0%(-4.60)#166 |
| 3. | Niantic | 0.60% | 5.6%(-5.00)#3 | 5.0%(-4.40)#379 |
| 4. | Weatogue | 0.80% | 5.6%(-4.80)#4 | 5.0%(-4.20)#747 |
| 5. | Broad Brook | 0.90% | 5.6%(-4.70)#5 | 5.0%(-4.10)#935 |
| 6. | Collinsville | 1.0% | 5.6%(-4.60)#6 | 5.0%(-4.00)#1,146 |
| 7. | Noank | 1.1% | 5.6%(-4.50)#7 | 5.0%(-3.90)#1,382 |
| 8. | Gales Ferry | 1.1% | 5.6%(-4.50)#8 | 5.0%(-3.90)#1,405 |
| 9. | Glastonbury Center | 1.3% | 5.6%(-4.30)#9 | 5.0%(-3.70)#1,752 |
| 10. | East | 1.3% | 5.6%(-4.30)#10 | 5.0%(-3.70)#1,783 |
| 11. | Poplar Plains | 1.5% | 5.6%(-4.10)#11 | 5.0%(-3.50)#2,375 |
| 12. | South Windham | 1.5% | 5.6%(-4.10)#12 | 5.0%(-3.50)#2,377 |
| 13. | Inglenook | 1.5% | 5.6%(-4.10)#13 | 5.0%(-3.50)#2,395 |
| 14. | Norfolk | 1.5% | 5.6%(-4.10)#14 | 5.0%(-3.50)#2,425 |
| 15. | Falls Village | 1.5% | 5.6%(-4.10)#15 | 5.0%(-3.50)#2,444 |
| 16. | Greens Farms | 1.6% | 5.6%(-4.00)#16 | 5.0%(-3.40)#2,570 |
| 17. | New Preston | 1.7% | 5.6%(-3.90)#17 | 5.0%(-3.30)#2,926 |
| 18. | Lordship | 1.8% | 5.6%(-3.80)#18 | 5.0%(-3.20)#3,092 |
| 19. | Salmon Brook | 1.8% | 5.6%(-3.80)#19 | 5.0%(-3.20)#3,131 |
| 20. | Quinnipiac University | 1.9% | 5.6%(-3.70)#20 | 5.0%(-3.10)#3,341 |
| 21. | Kensington | 2.4% | 5.6%(-3.20)#21 | 5.0%(-2.60)#4,804 |
| 22. | Oakville | 2.4% | 5.6%(-3.20)#22 | 5.0%(-2.60)#4,806 |
| 23. | Hazardville | 2.6% | 5.6%(-3.00)#23 | 5.0%(-2.40)#5,417 |
| 24. | Mamanasco Lake | 2.7% | 5.6%(-2.90)#24 | 5.0%(-2.30)#5,866 |
| 25. | Plantsville | 2.8% | 5.6%(-2.80)#25 | 5.0%(-2.20)#6,061 |
| 26. | Bantam Borough | 2.8% | 5.6%(-2.80)#26 | 5.0%(-2.20)#6,145 |
| 27. | Newington | 2.9% | 5.6%(-2.70)#27 | 5.0%(-2.10)#6,240 |
| 28. | Northwest Harwinton | 2.9% | 5.6%(-2.70)#28 | 5.0%(-2.10)#6,344 |
| 29. | Woodmont Borough | 2.9% | 5.6%(-2.70)#29 | 5.0%(-2.10)#6,388 |
| 30. | South Coventry | 2.9% | 5.6%(-2.70)#30 | 5.0%(-2.10)#6,399 |
| 31. | South Wilton | 3.0% | 5.6%(-2.60)#31 | 5.0%(-2.00)#6,721 |
| 32. | Moodus | 3.2% | 5.6%(-2.40)#32 | 5.0%(-1.80)#7,311 |
| 33. | North Haven | 3.3% | 5.6%(-2.30)#33 | 5.0%(-1.70)#7,478 |
| 34. | Southwood Acres | 3.3% | 5.6%(-2.30)#34 | 5.0%(-1.70)#7,540 |
| 35. | Northford | 3.4% | 5.6%(-2.20)#35 | 5.0%(-1.60)#7,900 |
| 36. | Clinton | 3.4% | 5.6%(-2.20)#36 | 5.0%(-1.60)#7,938 |
| 37. | Westbrook Center | 3.4% | 5.6%(-2.20)#37 | 5.0%(-1.60)#7,955 |
| 38. | Orange | 3.5% | 5.6%(-2.10)#38 | 5.0%(-1.50)#8,174 |
| 39. | Bethel | 3.5% | 5.6%(-2.10)#39 | 5.0%(-1.50)#8,182 |
| 40. | Cornwall Bridge | 3.5% | 5.6%(-2.10)#40 | 5.0%(-1.50)#8,399 |
| 41. | Mill Plain | 3.6% | 5.6%(-2.00)#41 | 5.0%(-1.40)#8,573 |
| 42. | Madison Center | 3.6% | 5.6%(-2.00)#42 | 5.0%(-1.40)#8,582 |
| 43. | Wethersfield | 3.7% | 5.6%(-1.90)#43 | 5.0%(-1.30)#8,727 |
| 44. | East Hampton | 3.7% | 5.6%(-1.90)#44 | 5.0%(-1.30)#8,835 |
| 45. | Old Hill | 3.7% | 5.6%(-1.90)#45 | 5.0%(-1.30)#8,837 |
| 46. | West Hartford | 3.8% | 5.6%(-1.80)#46 | 5.0%(-1.20)#8,991 |
| 47. | Daniels Farm | 3.8% | 5.6%(-1.80)#47 | 5.0%(-1.20)#9,103 |
| 48. | Deep River Center | 3.8% | 5.6%(-1.80)#48 | 5.0%(-1.20)#9,141 |
| 49. | Ball Pond | 3.8% | 5.6%(-1.80)#49 | 5.0%(-1.20)#9,148 |
| 50. | Blue Hills | 3.8% | 5.6%(-1.80)#50 | 5.0%(-1.20)#9,156 |
| 51. | Middletown | 3.9% | 5.6%(-1.70)#51 | 5.0%(-1.10)#9,302 |
| 52. | Indian Field | 3.9% | 5.6%(-1.70)#52 | 5.0%(-1.10)#9,547 |
| 53. | Watertown | 4.0% | 5.6%(-1.60)#53 | 5.0%(-1.00)#9,703 |
| 54. | Coventry Lake | 4.0% | 5.6%(-1.60)#54 | 5.0%(-1.00)#9,737 |
| 55. | Chester Center | 4.0% | 5.6%(-1.60)#55 | 5.0%(-1.00)#9,754 |
| 56. | Milford City Balance | 4.1% | 5.6%(-1.50)#56 | 5.0%(-0.900)#9,875 |
| 57. | Noroton Heights | 4.1% | 5.6%(-1.50)#57 | 5.0%(-0.900)#9,995 |
| 58. | Newtown Borough | 4.1% | 5.6%(-1.50)#58 | 5.0%(-0.900)#10,022 |
| 59. | New Milford | 4.2% | 5.6%(-1.40)#59 | 5.0%(-0.800)#10,230 |
| 60. | Stafford Springs | 4.2% | 5.6%(-1.40)#60 | 5.0%(-0.800)#10,249 |
| 61. | Mystic | 4.2% | 5.6%(-1.40)#61 | 5.0%(-0.800)#10,255 |
| 62. | Compo | 4.2% | 5.6%(-1.40)#62 | 5.0%(-0.800)#10,259 |
| 63. | Sherwood Manor | 4.3% | 5.6%(-1.30)#63 | 5.0%(-0.700)#10,503 |
| 64. | Tashua | 4.3% | 5.6%(-1.30)#64 | 5.0%(-0.700)#10,531 |
| 65. | Groton Long Point Borough | 4.3% | 5.6%(-1.30)#65 | 5.0%(-0.700)#10,640 |
| 66. | Sharon | 4.3% | 5.6%(-1.30)#66 | 5.0%(-0.700)#10,650 |
| 67. | Branford Center | 4.4% | 5.6%(-1.20)#67 | 5.0%(-0.600)#10,798 |
| 68. | Manchester | 4.5% | 5.6%(-1.10)#68 | 5.0%(-0.500)#11,005 |
| 69. | Simsbury Center | 4.5% | 5.6%(-1.10)#69 | 5.0%(-0.500)#11,092 |
| 70. | Cheshire Village | 4.5% | 5.6%(-1.10)#70 | 5.0%(-0.500)#11,096 |
| 71. | Litchfield Borough | 4.5% | 5.6%(-1.10)#71 | 5.0%(-0.500)#11,164 |
| 72. | Saybrook Manor | 4.5% | 5.6%(-1.10)#72 | 5.0%(-0.500)#11,173 |
| 73. | Naugatuck Borough | 4.6% | 5.6%(-1.000)#73 | 5.0%(-0.400)#11,295 |
| 74. | Terramuggus | 4.6% | 5.6%(-1.000)#74 | 5.0%(-0.400)#11,457 |
| 75. | Lake Pocotopaug | 4.7% | 5.6%(-0.900)#75 | 5.0%(-0.300)#11,625 |
| 76. | Candlewood Shores | 4.7% | 5.6%(-0.900)#76 | 5.0%(-0.300)#11,716 |
| 77. | Conning Towers Nautilus Park | 4.8% | 5.6%(-0.800)#77 | 5.0%(-0.200)#11,854 |
| 78. | Long Hill | 4.8% | 5.6%(-0.800)#78 | 5.0%(-0.200)#11,883 |
| 79. | South Woodstock | 4.8% | 5.6%(-0.800)#79 | 5.0%(-0.200)#11,947 |
| 80. | East Haven | 4.9% | 5.6%(-0.700)#80 | 5.0%(-0.100)#12,082 |
| 81. | Sandy Hook | 4.9% | 5.6%(-0.700)#81 | 5.0%(-0.100)#12,116 |
| 82. | Stamford | 5.0% | 5.6%(-0.600)#82 | 5.0%(=0.000)#12,300 |
| 83. | Mansfield Center | 5.0% | 5.6%(-0.600)#83 | 5.0%(=0.000)#12,477 |
| 84. | Wallingford Center | 5.1% | 5.6%(-0.500)#84 | 5.0%(+0.100)#12,612 |
| 85. | Old Greenwich | 5.1% | 5.6%(-0.500)#85 | 5.0%(+0.100)#12,663 |
| 86. | Noroton | 5.1% | 5.6%(-0.500)#86 | 5.0%(+0.100)#12,670 |
| 87. | Shelton | 5.2% | 5.6%(-0.400)#87 | 5.0%(+0.200)#12,844 |
| 88. | New Hartford Center | 5.2% | 5.6%(-0.400)#88 | 5.0%(+0.200)#12,983 |
| 89. | Heritage Village | 5.4% | 5.6%(-0.200)#89 | 5.0%(+0.400)#13,368 |
| 90. | Pemberwick | 5.4% | 5.6%(-0.200)#90 | 5.0%(+0.400)#13,378 |
| 91. | West Simsbury | 5.4% | 5.6%(-0.200)#91 | 5.0%(+0.400)#13,389 |
| 92. | Baltic | 5.4% | 5.6%(-0.200)#92 | 5.0%(+0.400)#13,436 |
| 93. | Redding Center | 5.4% | 5.6%(-0.200)#93 | 5.0%(+0.400)#13,497 |
| 94. | Riverside | 5.5% | 5.6%(-0.100)#94 | 5.0%(+0.500)#13,583 |
| 95. | Quasset Lake | 5.5% | 5.6%(-0.100)#95 | 5.0%(+0.500)#13,738 |
| 96. | Norwalk | 5.6% | 5.6%(=0.000)#96 | 5.0%(+0.600)#13,748 |
| 97. | Torrington | 5.6% | 5.6%(=0.000)#97 | 5.0%(+0.600)#13,765 |
| 98. | Trumbull Center | 5.6% | 5.6%(=0.000)#98 | 5.0%(+0.600)#13,800 |
| 99. | Staples | 5.6% | 5.6%(=0.000)#99 | 5.0%(+0.600)#13,815 |
| 100. | Danbury | 5.7% | 5.6%(+0.100)#100 | 5.0%(+0.700)#13,977 |
1
2Common Questions
What are the Top 10 Cities with the Lowest Unemployment Rate in Connecticut?
Top 10 Cities with the Lowest Unemployment Rate in Connecticut are:
#1
0.40%
#2
0.60%
#3
0.80%
#4
0.90%
#5
1.0%
#6
1.1%
#7
1.1%
#8
1.3%
#9
1.5%
#10
1.5%
What city has the Lowest Unemployment Rate in Connecticut?
Canton Valley has the Lowest Unemployment Rate in Connecticut with 0.40%.
What is the Unemployment Rate in the State of Connecticut?
Unemployment Rate in Connecticut is 5.6%.
What is the Unemployment Rate in the United States?
Unemployment Rate in the United States is 5.0%.