Cities with the Highest Percentage of Italian Population in Delaware
RELATED REPORTS & OPTIONS
Italian
Delaware
Compare Cities
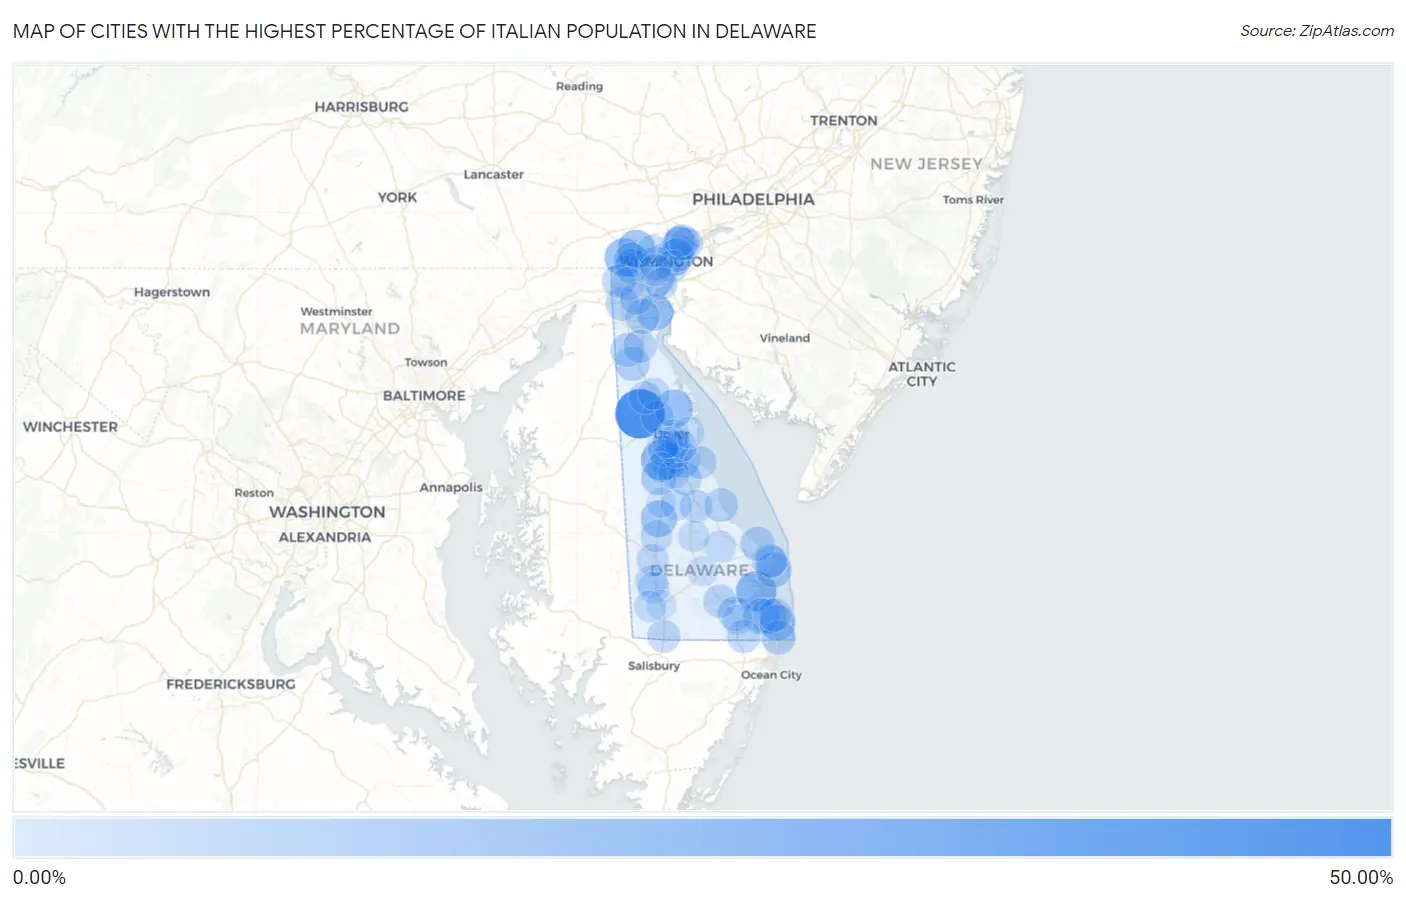
Map of Cities with the Highest Percentage of Italian Population in Delaware
0.00%
50.00%
Cities with the Highest Percentage of Italian Population in Delaware
| City | Italian | vs State | vs National | |
| 1. | Kenton | 49.75% | 8.56%(+41.2)#1 | 4.93%(+44.8)#45 |
| 2. | Woodside | 26.48% | 8.56%(+17.9)#2 | 4.93%(+21.6)#494 |
| 3. | Long Neck | 26.25% | 8.56%(+17.7)#3 | 4.93%(+21.3)#508 |
| 4. | North Star | 20.93% | 8.56%(+12.4)#4 | 4.93%(+16.0)#1,015 |
| 5. | Leipsic | 19.88% | 8.56%(+11.3)#5 | 4.93%(+15.0)#1,162 |
| 6. | Hockessin | 19.43% | 8.56%(+10.9)#6 | 4.93%(+14.5)#1,223 |
| 7. | Woodside East | 16.68% | 8.56%(+8.12)#7 | 4.93%(+11.8)#1,715 |
| 8. | Farmington | 16.67% | 8.56%(+8.11)#8 | 4.93%(+11.7)#1,721 |
| 9. | Delaware City | 15.89% | 8.56%(+7.33)#9 | 4.93%(+11.0)#1,893 |
| 10. | Ocean View | 14.85% | 8.56%(+6.29)#10 | 4.93%(+9.92)#2,140 |
| 11. | Edgemoor | 14.54% | 8.56%(+5.98)#11 | 4.93%(+9.61)#2,224 |
| 12. | Millville | 14.47% | 8.56%(+5.91)#12 | 4.93%(+9.55)#2,248 |
| 13. | Ardentown | 14.35% | 8.56%(+5.79)#13 | 4.93%(+9.42)#2,284 |
| 14. | South Bethany | 14.29% | 8.56%(+5.73)#14 | 4.93%(+9.36)#2,303 |
| 15. | Felton | 13.20% | 8.56%(+4.64)#15 | 4.93%(+8.28)#2,609 |
| 16. | Dewey Beach | 12.81% | 8.56%(+4.25)#16 | 4.93%(+7.89)#2,737 |
| 17. | Magnolia | 12.55% | 8.56%(+3.99)#17 | 4.93%(+7.62)#2,834 |
| 18. | Pike Creek Valley | 12.29% | 8.56%(+3.73)#18 | 4.93%(+7.37)#2,922 |
| 19. | Pike Creek | 11.91% | 8.56%(+3.35)#19 | 4.93%(+6.99)#3,064 |
| 20. | Rehoboth Beach | 11.86% | 8.56%(+3.30)#20 | 4.93%(+6.94)#3,075 |
| 21. | St Georges | 11.58% | 8.56%(+3.02)#21 | 4.93%(+6.65)#3,176 |
| 22. | Lewes | 10.39% | 8.56%(+1.83)#22 | 4.93%(+5.46)#3,696 |
| 23. | Townsend | 10.34% | 8.56%(+1.78)#23 | 4.93%(+5.41)#3,721 |
| 24. | Fenwick Island | 10.00% | 8.56%(+1.44)#24 | 4.93%(+5.07)#3,892 |
| 25. | Ardencroft | 10.00% | 8.56%(+1.44)#25 | 4.93%(+5.07)#3,893 |
| 26. | Dagsboro | 9.87% | 8.56%(+1.30)#26 | 4.93%(+4.94)#3,958 |
| 27. | Middletown | 9.66% | 8.56%(+1.09)#27 | 4.93%(+4.73)#4,058 |
| 28. | Bellefonte | 9.11% | 8.56%(+0.548)#28 | 4.93%(+4.18)#4,334 |
| 29. | Elsmere | 8.98% | 8.56%(+0.416)#29 | 4.93%(+4.05)#4,416 |
| 30. | Slaughter Beach | 8.91% | 8.56%(+0.345)#30 | 4.93%(+3.98)#4,450 |
| 31. | Glasgow | 8.85% | 8.56%(+0.294)#31 | 4.93%(+3.93)#4,479 |
| 32. | Newark | 8.47% | 8.56%(-0.086)#32 | 4.93%(+3.55)#4,689 |
| 33. | Selbyville | 8.32% | 8.56%(-0.236)#33 | 4.93%(+3.40)#4,801 |
| 34. | Frederica | 8.29% | 8.56%(-0.269)#34 | 4.93%(+3.36)#4,818 |
| 35. | Bethany Beach | 8.27% | 8.56%(-0.290)#35 | 4.93%(+3.34)#4,827 |
| 36. | Odessa | 7.97% | 8.56%(-0.591)#36 | 4.93%(+3.04)#5,036 |
| 37. | Millsboro | 7.84% | 8.56%(-0.722)#37 | 4.93%(+2.91)#5,136 |
| 38. | Brookside | 7.76% | 8.56%(-0.801)#38 | 4.93%(+2.83)#5,195 |
| 39. | Cheswold | 7.50% | 8.56%(-1.06)#39 | 4.93%(+2.58)#5,390 |
| 40. | Rising Sun Lebanon | 7.39% | 8.56%(-1.17)#40 | 4.93%(+2.46)#5,495 |
| 41. | Bowers | 7.14% | 8.56%(-1.42)#41 | 4.93%(+2.21)#5,693 |
| 42. | Milford | 7.09% | 8.56%(-1.47)#42 | 4.93%(+2.17)#5,744 |
| 43. | Delmar | 7.09% | 8.56%(-1.47)#43 | 4.93%(+2.16)#5,751 |
| 44. | Claymont | 6.82% | 8.56%(-1.74)#44 | 4.93%(+1.89)#6,013 |
| 45. | Wilmington Manor | 6.72% | 8.56%(-1.84)#45 | 4.93%(+1.79)#6,099 |
| 46. | Clayton | 6.64% | 8.56%(-1.92)#46 | 4.93%(+1.71)#6,181 |
| 47. | Greenville | 6.27% | 8.56%(-2.29)#47 | 4.93%(+1.34)#6,528 |
| 48. | Bear | 5.85% | 8.56%(-2.71)#48 | 4.93%(+0.919)#7,010 |
| 49. | Wilmington | 5.75% | 8.56%(-2.81)#49 | 4.93%(+0.820)#7,125 |
| 50. | New Castle | 5.65% | 8.56%(-2.91)#50 | 4.93%(+0.721)#7,248 |
| 51. | Bridgeville | 5.44% | 8.56%(-3.12)#51 | 4.93%(+0.516)#7,497 |
| 52. | Seaford | 5.41% | 8.56%(-3.15)#52 | 4.93%(+0.485)#7,540 |
| 53. | Newport | 5.33% | 8.56%(-3.23)#53 | 4.93%(+0.399)#7,661 |
| 54. | Greenwood | 5.27% | 8.56%(-3.29)#54 | 4.93%(+0.342)#7,743 |
| 55. | Smyrna | 4.79% | 8.56%(-3.77)#55 | 4.93%(-0.134)#8,453 |
| 56. | Blades | 4.69% | 8.56%(-3.87)#56 | 4.93%(-0.241)#8,608 |
| 57. | Henlopen Acres | 4.66% | 8.56%(-3.90)#57 | 4.93%(-0.265)#8,649 |
| 58. | Milton | 4.48% | 8.56%(-4.08)#58 | 4.93%(-0.449)#8,936 |
| 59. | Highland Acres | 4.47% | 8.56%(-4.09)#59 | 4.93%(-0.457)#8,952 |
| 60. | Ellendale | 4.27% | 8.56%(-4.29)#60 | 4.93%(-0.659)#9,325 |
| 61. | Kent Acres | 4.19% | 8.56%(-4.37)#61 | 4.93%(-0.738)#9,477 |
| 62. | Dover | 4.12% | 8.56%(-4.44)#62 | 4.93%(-0.810)#9,622 |
| 63. | Dover Base Housing | 4.11% | 8.56%(-4.45)#63 | 4.93%(-0.820)#9,634 |
| 64. | Bethel | 3.72% | 8.56%(-4.84)#64 | 4.93%(-1.20)#10,365 |
| 65. | Little Creek | 3.68% | 8.56%(-4.88)#65 | 4.93%(-1.25)#10,452 |
| 66. | Houston | 3.29% | 8.56%(-5.27)#66 | 4.93%(-1.64)#11,316 |
| 67. | Wyoming | 2.81% | 8.56%(-5.75)#67 | 4.93%(-2.12)#12,463 |
| 68. | Camden | 2.48% | 8.56%(-6.08)#68 | 4.93%(-2.45)#13,404 |
| 69. | Riverview | 2.38% | 8.56%(-6.18)#69 | 4.93%(-2.55)#13,699 |
| 70. | Rodney Village | 1.92% | 8.56%(-6.64)#70 | 4.93%(-3.01)#15,175 |
| 71. | Arden | 1.84% | 8.56%(-6.72)#71 | 4.93%(-3.09)#15,456 |
| 72. | Frankford | 1.66% | 8.56%(-6.90)#72 | 4.93%(-3.27)#16,065 |
| 73. | Viola | 1.23% | 8.56%(-7.33)#73 | 4.93%(-3.69)#17,730 |
| 74. | Harrington | 1.06% | 8.56%(-7.50)#74 | 4.93%(-3.87)#18,392 |
| 75. | Laurel | 0.96% | 8.56%(-7.60)#75 | 4.93%(-3.97)#18,823 |
| 76. | Georgetown | 0.87% | 8.56%(-7.69)#76 | 4.93%(-4.06)#19,231 |
1
Common Questions
What are the Top 10 Cities with the Highest Percentage of Italian Population in Delaware?
Top 10 Cities with the Highest Percentage of Italian Population in Delaware are:
#1
49.75%
#2
26.48%
#3
26.25%
#4
20.93%
#5
19.88%
#6
19.43%
#7
16.68%
#8
16.67%
#9
15.89%
#10
14.85%
What city has the Highest Percentage of Italian Population in Delaware?
Kenton has the Highest Percentage of Italian Population in Delaware with 49.75%.
What is the Percentage of Italian Population in the State of Delaware?
Percentage of Italian Population in Delaware is 8.56%.
What is the Percentage of Italian Population in the United States?
Percentage of Italian Population in the United States is 4.93%.