Cities with the Highest Percentage of Italian Population in New York
RELATED REPORTS & OPTIONS
Italian
New York
Compare Cities
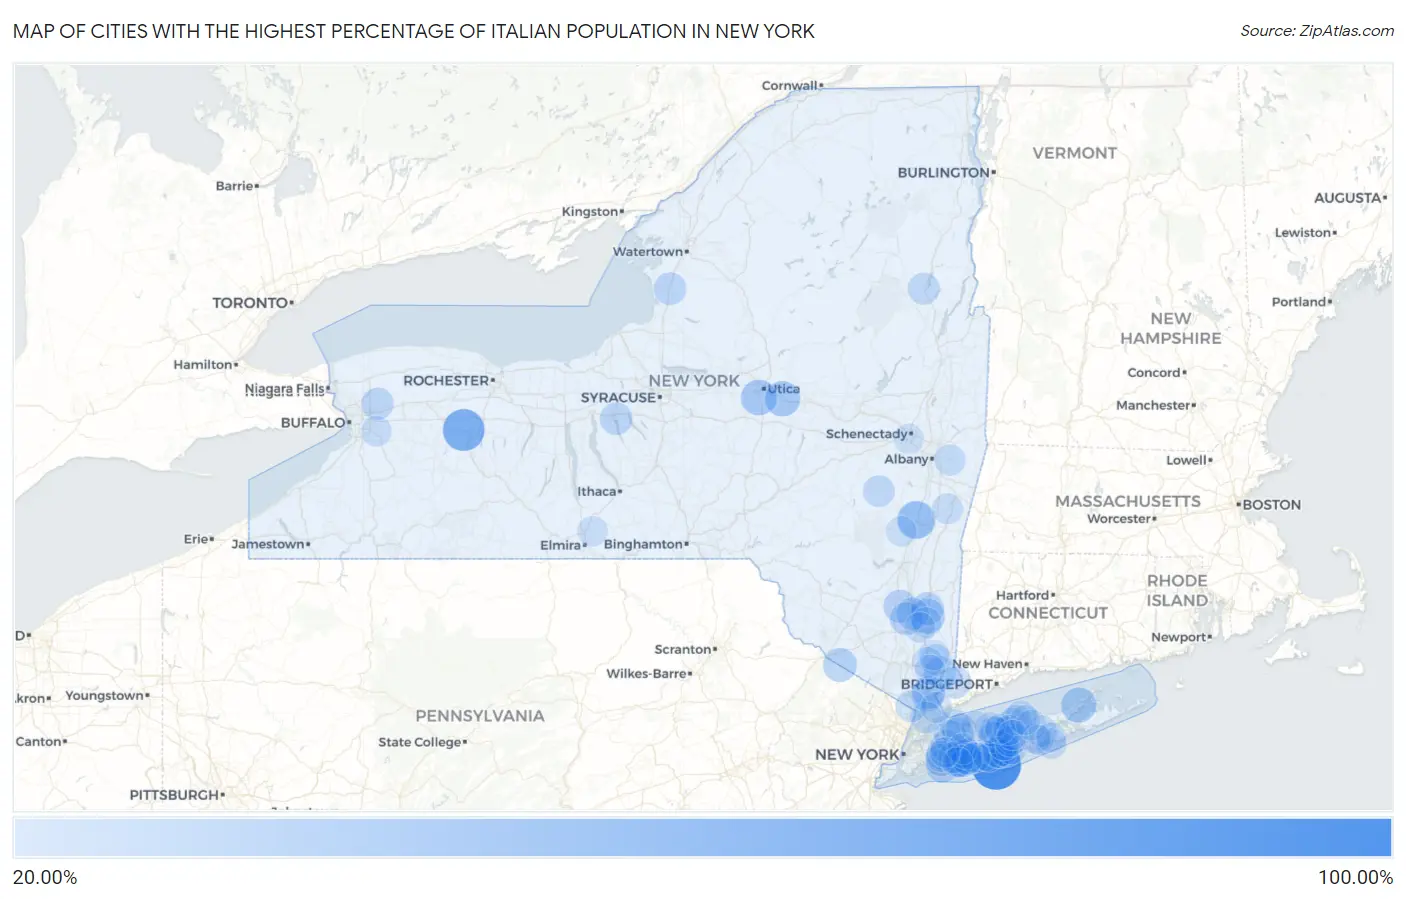
Map of Cities with the Highest Percentage of Italian Population in New York
0.00%
100.00%
Cities with the Highest Percentage of Italian Population in New York
| City | Italian | vs State | vs National | |
| 1. | Saltaire | 100.00% | 11.28%(+88.7)#1 | 4.93%(+95.1)#8 |
| 2. | Retsof | 70.76% | 11.28%(+59.5)#2 | 4.93%(+65.8)#18 |
| 3. | Captree | 64.34% | 11.28%(+53.1)#3 | 4.93%(+59.4)#23 |
| 4. | Cementon | 63.08% | 11.28%(+51.8)#4 | 4.93%(+58.1)#24 |
| 5. | Leeds | 55.34% | 11.28%(+44.1)#5 | 4.93%(+50.4)#30 |
| 6. | Oak Beach | 51.22% | 11.28%(+39.9)#6 | 4.93%(+46.3)#39 |
| 7. | Washington Mills | 47.70% | 11.28%(+36.4)#7 | 4.93%(+42.8)#50 |
| 8. | Frankfort | 46.77% | 11.28%(+35.5)#8 | 4.93%(+41.8)#56 |
| 9. | Peconic | 46.03% | 11.28%(+34.7)#9 | 4.93%(+41.1)#60 |
| 10. | Hillside Lake | 44.98% | 11.28%(+33.7)#10 | 4.93%(+40.1)#66 |
| 11. | North Massapequa | 44.44% | 11.28%(+33.2)#11 | 4.93%(+39.5)#72 |
| 12. | Unionville | 41.34% | 11.28%(+30.1)#12 | 4.93%(+36.4)#81 |
| 13. | Bridgeville | 41.07% | 11.28%(+29.8)#13 | 4.93%(+36.1)#83 |
| 14. | Clintondale | 39.32% | 11.28%(+28.0)#14 | 4.93%(+34.4)#100 |
| 15. | Massapequa | 39.19% | 11.28%(+27.9)#15 | 4.93%(+34.3)#102 |
| 16. | North Wantagh | 38.38% | 11.28%(+27.1)#16 | 4.93%(+33.5)#110 |
| 17. | Bay Park | 38.37% | 11.28%(+27.1)#17 | 4.93%(+33.4)#111 |
| 18. | Marlboro | 38.21% | 11.28%(+26.9)#18 | 4.93%(+33.3)#113 |
| 19. | Freedom Plains | 37.75% | 11.28%(+26.5)#19 | 4.93%(+32.8)#117 |
| 20. | Hawthorne | 37.63% | 11.28%(+26.3)#20 | 4.93%(+32.7)#122 |
| 21. | Thornwood | 37.31% | 11.28%(+26.0)#21 | 4.93%(+32.4)#128 |
| 22. | Pierrepont Manor | 36.86% | 11.28%(+25.6)#22 | 4.93%(+31.9)#130 |
| 23. | Melrose Park | 36.81% | 11.28%(+25.5)#23 | 4.93%(+31.9)#131 |
| 24. | Crown Heights | 36.77% | 11.28%(+25.5)#24 | 4.93%(+31.8)#132 |
| 25. | Marcy | 36.03% | 11.28%(+24.7)#25 | 4.93%(+31.1)#144 |
| 26. | Katonah | 35.97% | 11.28%(+24.7)#26 | 4.93%(+31.0)#147 |
| 27. | Scotts Corners | 35.97% | 11.28%(+24.7)#27 | 4.93%(+31.0)#148 |
| 28. | Clarence Center | 35.48% | 11.28%(+24.2)#28 | 4.93%(+30.5)#154 |
| 29. | Garden City South | 35.45% | 11.28%(+24.2)#29 | 4.93%(+30.5)#155 |
| 30. | North Lynbrook | 35.32% | 11.28%(+24.0)#30 | 4.93%(+30.4)#156 |
| 31. | Seaford | 35.20% | 11.28%(+23.9)#31 | 4.93%(+30.3)#160 |
| 32. | Massapequa Park | 35.10% | 11.28%(+23.8)#32 | 4.93%(+30.2)#161 |
| 33. | East Williston | 34.79% | 11.28%(+23.5)#33 | 4.93%(+29.9)#165 |
| 34. | East Norwich | 34.75% | 11.28%(+23.5)#34 | 4.93%(+29.8)#166 |
| 35. | Plainedge | 34.46% | 11.28%(+23.2)#35 | 4.93%(+29.5)#170 |
| 36. | Old Brookville | 34.30% | 11.28%(+23.0)#36 | 4.93%(+29.4)#174 |
| 37. | Pottersville | 34.23% | 11.28%(+22.9)#37 | 4.93%(+29.3)#177 |
| 38. | Oakdale | 34.19% | 11.28%(+22.9)#38 | 4.93%(+29.3)#180 |
| 39. | Manorville | 33.78% | 11.28%(+22.5)#39 | 4.93%(+28.9)#191 |
| 40. | Nesconset | 33.69% | 11.28%(+22.4)#40 | 4.93%(+28.8)#194 |
| 41. | Preston Potter Hollow | 33.69% | 11.28%(+22.4)#41 | 4.93%(+28.8)#195 |
| 42. | West Islip | 33.49% | 11.28%(+22.2)#42 | 4.93%(+28.6)#197 |
| 43. | Eastchester | 33.37% | 11.28%(+22.1)#43 | 4.93%(+28.4)#198 |
| 44. | Terryville | 33.24% | 11.28%(+22.0)#44 | 4.93%(+28.3)#206 |
| 45. | Lake Grove | 33.14% | 11.28%(+21.9)#45 | 4.93%(+28.2)#209 |
| 46. | Shorehaven | 33.08% | 11.28%(+21.8)#46 | 4.93%(+28.2)#211 |
| 47. | Westernville | 32.98% | 11.28%(+21.7)#47 | 4.93%(+28.1)#213 |
| 48. | Wantagh | 32.96% | 11.28%(+21.7)#48 | 4.93%(+28.0)#214 |
| 49. | New Hackensack | 32.81% | 11.28%(+21.5)#49 | 4.93%(+27.9)#219 |
| 50. | North Merrick | 32.75% | 11.28%(+21.5)#50 | 4.93%(+27.8)#221 |
| 51. | Sparkill | 32.62% | 11.28%(+21.3)#51 | 4.93%(+27.7)#223 |
| 52. | South Farmingdale | 32.59% | 11.28%(+21.3)#52 | 4.93%(+27.7)#225 |
| 53. | Carmel | 32.27% | 11.28%(+21.0)#53 | 4.93%(+27.3)#231 |
| 54. | Bayville | 32.22% | 11.28%(+20.9)#54 | 4.93%(+27.3)#233 |
| 55. | Village Of The Branch | 32.17% | 11.28%(+20.9)#55 | 4.93%(+27.2)#234 |
| 56. | East Massapequa | 32.07% | 11.28%(+20.8)#56 | 4.93%(+27.1)#236 |
| 57. | Franklin Square | 31.69% | 11.28%(+20.4)#57 | 4.93%(+26.8)#244 |
| 58. | Great River | 31.63% | 11.28%(+20.3)#58 | 4.93%(+26.7)#247 |
| 59. | West Bay Shore | 31.60% | 11.28%(+20.3)#59 | 4.93%(+26.7)#248 |
| 60. | West Sand Lake | 31.54% | 11.28%(+20.3)#60 | 4.93%(+26.6)#249 |
| 61. | Sound Beach | 31.48% | 11.28%(+20.2)#61 | 4.93%(+26.6)#251 |
| 62. | Hauppauge | 31.48% | 11.28%(+20.2)#62 | 4.93%(+26.6)#252 |
| 63. | Harrison | 31.48% | 11.28%(+20.2)#63 | 4.93%(+26.5)#253 |
| 64. | Lincolndale | 31.22% | 11.28%(+19.9)#64 | 4.93%(+26.3)#257 |
| 65. | Cove Neck | 30.98% | 11.28%(+19.7)#65 | 4.93%(+26.1)#262 |
| 66. | West Sayville | 30.80% | 11.28%(+19.5)#66 | 4.93%(+25.9)#267 |
| 67. | Holtsville | 30.74% | 11.28%(+19.5)#67 | 4.93%(+25.8)#268 |
| 68. | Smithtown | 30.43% | 11.28%(+19.1)#68 | 4.93%(+25.5)#280 |
| 69. | Ghent | 30.40% | 11.28%(+19.1)#69 | 4.93%(+25.5)#283 |
| 70. | East Islip | 30.24% | 11.28%(+19.0)#70 | 4.93%(+25.3)#294 |
| 71. | Hopewell Junction | 30.10% | 11.28%(+18.8)#71 | 4.93%(+25.2)#300 |
| 72. | Jefferson Valley Yorktown | 30.06% | 11.28%(+18.8)#72 | 4.93%(+25.1)#301 |
| 73. | Elma Center | 30.02% | 11.28%(+18.7)#73 | 4.93%(+25.1)#302 |
| 74. | West Hampton Dunes | 30.00% | 11.28%(+18.7)#74 | 4.93%(+25.1)#303 |
| 75. | Bethpage | 29.89% | 11.28%(+18.6)#75 | 4.93%(+25.0)#309 |
| 76. | Bayport | 29.84% | 11.28%(+18.6)#76 | 4.93%(+24.9)#310 |
| 77. | Bohemia | 29.81% | 11.28%(+18.5)#77 | 4.93%(+24.9)#311 |
| 78. | Centerport | 29.80% | 11.28%(+18.5)#78 | 4.93%(+24.9)#312 |
| 79. | Lake Delta | 29.70% | 11.28%(+18.4)#79 | 4.93%(+24.8)#316 |
| 80. | Mastic | 29.55% | 11.28%(+18.3)#80 | 4.93%(+24.6)#320 |
| 81. | Holbrook | 29.55% | 11.28%(+18.3)#81 | 4.93%(+24.6)#321 |
| 82. | Mount Sinai | 29.32% | 11.28%(+18.0)#82 | 4.93%(+24.4)#330 |
| 83. | Mahopac | 29.26% | 11.28%(+18.0)#83 | 4.93%(+24.3)#332 |
| 84. | Kings Park | 29.21% | 11.28%(+17.9)#84 | 4.93%(+24.3)#334 |
| 85. | Yorktown Heights | 29.16% | 11.28%(+17.9)#85 | 4.93%(+24.2)#337 |
| 86. | Lindenhurst | 29.13% | 11.28%(+17.8)#86 | 4.93%(+24.2)#338 |
| 87. | Breesport | 29.05% | 11.28%(+17.8)#87 | 4.93%(+24.1)#340 |
| 88. | Brinckerhoff | 28.98% | 11.28%(+17.7)#88 | 4.93%(+24.1)#343 |
| 89. | Palenville | 28.97% | 11.28%(+17.7)#89 | 4.93%(+24.0)#344 |
| 90. | Centereach | 28.84% | 11.28%(+17.6)#90 | 4.93%(+23.9)#354 |
| 91. | Bellmore | 28.80% | 11.28%(+17.5)#91 | 4.93%(+23.9)#357 |
| 92. | Ridge | 28.78% | 11.28%(+17.5)#92 | 4.93%(+23.9)#359 |
| 93. | Garden City | 28.69% | 11.28%(+17.4)#93 | 4.93%(+23.8)#361 |
| 94. | Moriches | 28.60% | 11.28%(+17.3)#94 | 4.93%(+23.7)#366 |
| 95. | Remsenburg Speonk | 28.35% | 11.28%(+17.1)#95 | 4.93%(+23.4)#375 |
| 96. | St James | 28.33% | 11.28%(+17.0)#96 | 4.93%(+23.4)#376 |
| 97. | Eldred | 28.27% | 11.28%(+17.0)#97 | 4.93%(+23.3)#379 |
| 98. | Rotterdam | 28.26% | 11.28%(+17.0)#98 | 4.93%(+23.3)#380 |
| 99. | Rocky Point | 28.18% | 11.28%(+16.9)#99 | 4.93%(+23.3)#384 |
| 100. | Farmingville | 28.15% | 11.28%(+16.9)#100 | 4.93%(+23.2)#388 |
Common Questions
What are the Top 10 Cities with the Highest Percentage of Italian Population in New York?
Top 10 Cities with the Highest Percentage of Italian Population in New York are:
#1
100.00%
#2
70.76%
#3
55.34%
#4
47.70%
#5
46.77%
#6
46.03%
#7
44.98%
#8
44.44%
#9
41.34%
#10
39.32%
What city has the Highest Percentage of Italian Population in New York?
Saltaire has the Highest Percentage of Italian Population in New York with 100.00%.
What is the Percentage of Italian Population in the State of New York?
Percentage of Italian Population in New York is 11.28%.
What is the Percentage of Italian Population in the United States?
Percentage of Italian Population in the United States is 4.93%.