Cities with the Highest Percentage of Italian Population in the United States
RELATED REPORTS & OPTIONS
Italian
United States
Compare Cities
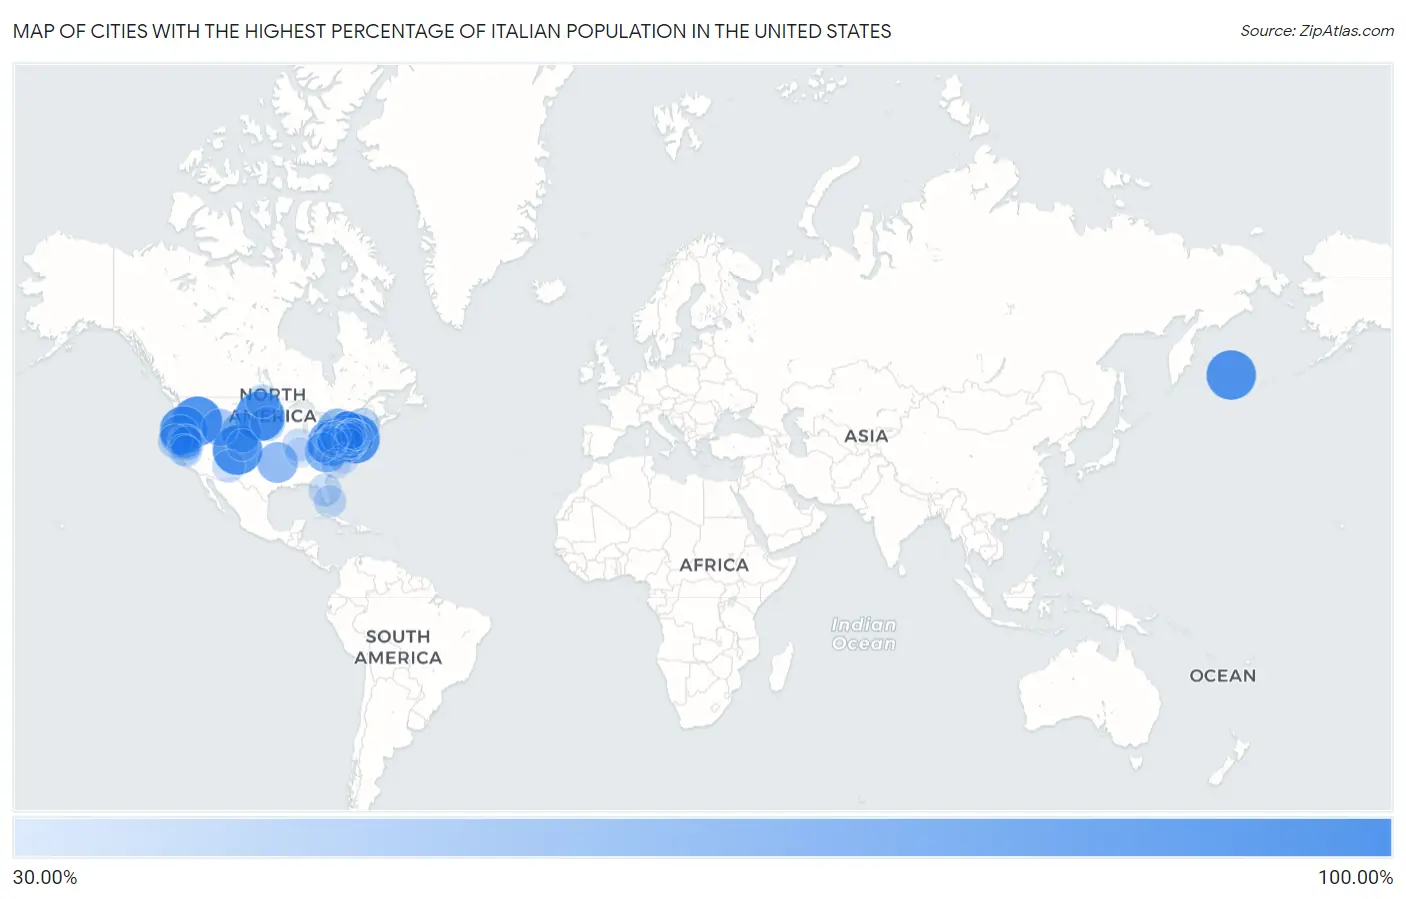
Map of Cities with the Highest Percentage of Italian Population in the United States
0.00%
100.00%
Cities with the Highest Percentage of Italian Population in the United States
| City | Italian | vs State | vs National | |
| 1. | Ross Corner | 100.00% | 14.29%(+85.7)#1 | 4.93%(+95.1)#1 |
| 2. | Attu Station | 100.00% | 2.66%(+97.3)#1 | 4.93%(+95.1)#2 |
| 3. | Brogan | 100.00% | 3.59%(+96.4)#1 | 4.93%(+95.1)#3 |
| 4. | Mechanicsburg | 100.00% | 3.88%(+96.1)#1 | 4.93%(+95.1)#4 |
| 5. | Colliers | 100.00% | 4.31%(+95.7)#1 | 4.93%(+95.1)#5 |
| 6. | Bonanza | 100.00% | 4.84%(+95.2)#1 | 4.93%(+95.1)#6 |
| 7. | Saltaire | 100.00% | 11.28%(+88.7)#1 | 4.93%(+95.1)#8 |
| 8. | Lowry | 100.00% | 1.27%(+98.7)#1 | 4.93%(+95.1)#9 |
| 9. | Kelly | 100.00% | 2.12%(+97.9)#1 | 4.93%(+95.1)#10 |
| 10. | Beatty | 94.44% | 3.59%(+90.9)#2 | 4.93%(+89.5)#11 |
| 11. | Buffington | 90.76% | 10.82%(+79.9)#1 | 4.93%(+85.8)#12 |
| 12. | Bethlehem | 84.07% | 1.66%(+82.4)#1 | 4.93%(+79.1)#13 |
| 13. | Pardeesville | 80.99% | 10.82%(+70.2)#2 | 4.93%(+76.1)#14 |
| 14. | Coral | 76.92% | 10.82%(+66.1)#3 | 4.93%(+72.0)#15 |
| 15. | Charlton Heights | 76.85% | 4.31%(+72.5)#2 | 4.93%(+71.9)#16 |
| 16. | Pinhook Corner | 71.83% | 1.69%(+70.1)#1 | 4.93%(+66.9)#17 |
| 17. | Westview Circle | 70.97% | 3.09%(+67.9)#1 | 4.93%(+66.0)#18 |
| 18. | Retsof | 70.76% | 11.28%(+59.5)#2 | 4.93%(+65.8)#19 |
| 19. | Fisherville | 70.00% | 10.82%(+59.2)#4 | 4.93%(+65.1)#20 |
| 20. | Edgewood | 69.57% | 3.48%(+66.1)#1 | 4.93%(+64.6)#21 |
| 21. | Croweburg | 67.37% | 2.12%(+65.2)#2 | 4.93%(+62.4)#22 |
| 22. | Mormon Lake | 67.23% | 4.11%(+63.1)#1 | 4.93%(+62.3)#23 |
| 23. | Captree | 64.34% | 11.28%(+53.1)#3 | 4.93%(+59.4)#24 |
| 24. | Cementon | 63.08% | 11.28%(+51.8)#4 | 4.93%(+58.1)#25 |
| 25. | Nordic | 60.61% | 3.09%(+57.5)#2 | 4.93%(+55.7)#26 |
| 26. | Wedron | 58.62% | 5.50%(+53.1)#1 | 4.93%(+53.7)#27 |
| 27. | Lake Davis | 56.19% | 3.48%(+52.7)#2 | 4.93%(+51.3)#28 |
| 28. | Hublersburg | 55.88% | 10.82%(+45.1)#5 | 4.93%(+51.0)#29 |
| 29. | Browntown | 55.42% | 10.82%(+44.6)#6 | 4.93%(+50.5)#30 |
| 30. | Leeds | 55.34% | 11.28%(+44.1)#5 | 4.93%(+50.4)#31 |
| 31. | Brookfield Center | 54.71% | 15.86%(+38.8)#1 | 4.93%(+49.8)#32 |
| 32. | Abanda | 53.73% | 1.63%(+52.1)#1 | 4.93%(+48.8)#33 |
| 33. | La Clede | 53.49% | 5.50%(+48.0)#2 | 4.93%(+48.6)#34 |
| 34. | Farmer | 53.23% | 1.27%(+52.0)#2 | 4.93%(+48.3)#35 |
| 35. | Great Meadows | 52.90% | 14.29%(+38.6)#2 | 4.93%(+48.0)#36 |
| 36. | Sanbornville | 52.23% | 9.88%(+42.3)#1 | 4.93%(+47.3)#37 |
| 37. | Taylorsville | 51.85% | 3.48%(+48.4)#3 | 4.93%(+46.9)#38 |
| 38. | Benbow | 51.63% | 3.48%(+48.2)#4 | 4.93%(+46.7)#39 |
| 39. | Oak Beach | 51.22% | 11.28%(+39.9)#6 | 4.93%(+46.3)#40 |
| 40. | Candlewood Lake Club | 51.03% | 15.86%(+35.2)#2 | 4.93%(+46.1)#41 |
| 41. | Roadstown | 50.61% | 14.29%(+36.3)#3 | 4.93%(+45.7)#42 |
| 42. | Ridgefield | 50.26% | 5.50%(+44.8)#3 | 4.93%(+45.3)#43 |
| 43. | Ackermanville | 50.00% | 10.82%(+39.2)#7 | 4.93%(+45.1)#44 |
| 44. | Churchs Ferry | 50.00% | 1.20%(+48.8)#1 | 4.93%(+45.1)#45 |
| 45. | Kenton | 49.75% | 8.56%(+41.2)#1 | 4.93%(+44.8)#46 |
| 46. | Grindstone | 49.27% | 10.82%(+38.5)#8 | 4.93%(+44.3)#47 |
| 47. | Frankstown | 48.94% | 10.82%(+38.1)#9 | 4.93%(+44.0)#48 |
| 48. | Polebridge | 48.39% | 3.52%(+44.9)#1 | 4.93%(+43.5)#49 |
| 49. | Dover Beaches South | 47.96% | 14.29%(+33.7)#4 | 4.93%(+43.0)#50 |
| 50. | Washington Mills | 47.70% | 11.28%(+36.4)#7 | 4.93%(+42.8)#51 |
| 51. | Wilburton Number Two | 47.37% | 10.82%(+36.5)#10 | 4.93%(+42.4)#52 |
| 52. | Lakewood | 47.37% | 5.50%(+41.9)#4 | 4.93%(+42.4)#53 |
| 53. | Belleplain | 47.30% | 14.29%(+33.0)#5 | 4.93%(+42.4)#54 |
| 54. | Sorrento | 47.27% | 5.68%(+41.6)#1 | 4.93%(+42.3)#55 |
| 55. | Fence Lake | 46.96% | 2.30%(+44.7)#1 | 4.93%(+42.0)#56 |
| 56. | Frankfort | 46.77% | 11.28%(+35.5)#8 | 4.93%(+41.8)#57 |
| 57. | Sheppton | 46.54% | 10.82%(+35.7)#11 | 4.93%(+41.6)#58 |
| 58. | Groveville | 46.51% | 14.29%(+32.2)#6 | 4.93%(+41.6)#59 |
| 59. | Lazy Lake | 46.15% | 5.68%(+40.5)#2 | 4.93%(+41.2)#60 |
| 60. | Peconic | 46.03% | 11.28%(+34.7)#9 | 4.93%(+41.1)#61 |
| 61. | Helmville | 45.83% | 3.52%(+42.3)#2 | 4.93%(+40.9)#62 |
| 62. | Beckwourth | 45.73% | 3.48%(+42.3)#5 | 4.93%(+40.8)#63 |
| 63. | Silver Ridge | 45.72% | 14.29%(+31.4)#7 | 4.93%(+40.8)#64 |
| 64. | Acampo | 45.49% | 3.48%(+42.0)#6 | 4.93%(+40.6)#65 |
| 65. | Floweree | 45.45% | 3.52%(+41.9)#3 | 4.93%(+40.5)#66 |
| 66. | Hillside Lake | 44.98% | 11.28%(+33.7)#10 | 4.93%(+40.1)#67 |
| 67. | Upper Stewartsville | 44.77% | 14.29%(+30.5)#8 | 4.93%(+39.8)#68 |
| 68. | Chimney Hill | 44.74% | 7.14%(+37.6)#1 | 4.93%(+39.8)#69 |
| 69. | Franktown | 44.73% | 4.84%(+39.9)#2 | 4.93%(+39.8)#70 |
| 70. | Fay | 44.64% | 1.69%(+43.0)#2 | 4.93%(+39.7)#71 |
| 71. | Chinese Camp | 44.44% | 3.48%(+41.0)#7 | 4.93%(+39.5)#72 |
| 72. | North Massapequa | 44.44% | 11.28%(+33.2)#11 | 4.93%(+39.5)#73 |
| 73. | Germania | 44.27% | 14.29%(+30.0)#9 | 4.93%(+39.3)#74 |
| 74. | Lloydsville | 43.93% | 5.90%(+38.0)#1 | 4.93%(+39.0)#75 |
| 75. | West Pittsburg | 43.72% | 10.82%(+32.9)#12 | 4.93%(+38.8)#76 |
| 76. | Yatesville Borough | 43.03% | 10.82%(+32.2)#13 | 4.93%(+38.1)#77 |
| 77. | Northford | 42.67% | 15.86%(+26.8)#3 | 4.93%(+37.7)#78 |
| 78. | Delaware Park | 42.44% | 14.29%(+28.2)#10 | 4.93%(+37.5)#79 |
| 79. | Chewsville | 41.98% | 4.60%(+37.4)#1 | 4.93%(+37.1)#80 |
| 80. | Branchville | 41.77% | 15.86%(+25.9)#4 | 4.93%(+36.8)#81 |
| 81. | Unionville | 41.34% | 11.28%(+30.1)#12 | 4.93%(+36.4)#82 |
| 82. | Adamsburg Borough | 41.24% | 10.82%(+30.4)#14 | 4.93%(+36.3)#83 |
| 83. | Bridgeville | 41.07% | 11.28%(+29.8)#13 | 4.93%(+36.1)#84 |
| 84. | Webster | 41.07% | 10.82%(+30.3)#15 | 4.93%(+36.1)#85 |
| 85. | Bridgewater | 40.85% | 15.86%(+25.0)#5 | 4.93%(+35.9)#86 |
| 86. | Bradenville | 40.76% | 10.82%(+29.9)#16 | 4.93%(+35.8)#87 |
| 87. | South Mills | 40.67% | 3.20%(+37.5)#1 | 4.93%(+35.7)#88 |
| 88. | Chimney Point | 40.57% | 15.86%(+24.7)#6 | 4.93%(+35.6)#89 |
| 89. | Lavallette Borough | 40.37% | 14.29%(+26.1)#11 | 4.93%(+35.4)#90 |
| 90. | Wopsononock | 40.37% | 10.82%(+29.6)#17 | 4.93%(+35.4)#91 |
| 91. | Vann Crossroads | 40.23% | 3.20%(+37.0)#2 | 4.93%(+35.3)#92 |
| 92. | Collings Lakes | 40.08% | 14.29%(+25.8)#12 | 4.93%(+35.1)#93 |
| 93. | Muddy | 40.00% | 5.50%(+34.5)#5 | 4.93%(+35.1)#94 |
| 94. | North Haven | 39.94% | 15.86%(+24.1)#7 | 4.93%(+35.0)#95 |
| 95. | Kersey | 39.73% | 10.82%(+28.9)#18 | 4.93%(+34.8)#96 |
| 96. | Kanauga | 39.71% | 5.90%(+33.8)#2 | 4.93%(+34.8)#97 |
| 97. | Lower Berkshire Valley | 39.70% | 14.29%(+25.4)#13 | 4.93%(+34.8)#98 |
| 98. | Great Notch | 39.55% | 14.29%(+25.3)#14 | 4.93%(+34.6)#99 |
| 99. | Chalkhill | 39.44% | 10.82%(+28.6)#19 | 4.93%(+34.5)#100 |
| 100. | Clintondale | 39.32% | 11.28%(+28.0)#14 | 4.93%(+34.4)#101 |
Common Questions
What are the Top 10 Cities with the Highest Percentage of Italian Population in the United States?
Top 10 Cities with the Highest Percentage of Italian Population in the United States are:
#1
100.00%
#2
100.00%
#3
100.00%
#4
100.00%
#5
100.00%
#6
100.00%
#7
94.44%
#8
90.76%
#9
80.99%
#10
76.92%
What city has the Highest Percentage of Italian Population in the United States?
Ross Corner has the Highest Percentage of Italian Population in the United States with 100.00%.
What is the Percentage of Italian Population in the United States?
Percentage of Italian Population in the United States is 4.93%.