Cities with the Largest Scandinavian Community in New York
RELATED REPORTS & OPTIONS
Scandinavian
New York
Compare Cities
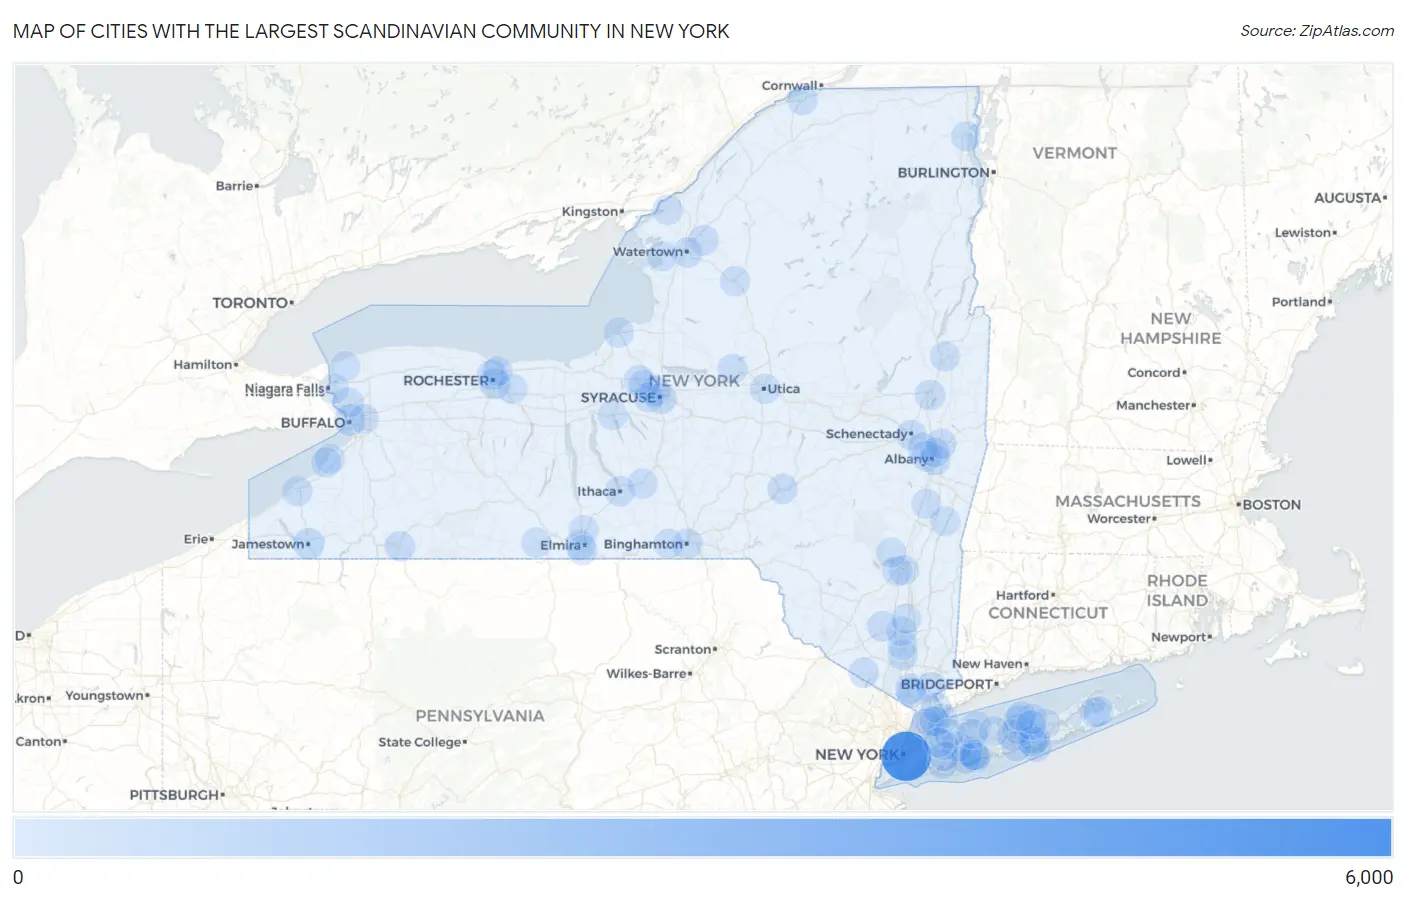
Map of Cities with the Largest Scandinavian Community in New York
0
6,000
Cities with the Largest Scandinavian Community in New York
| City | Scandinavian | vs State | vs National | |
| 1. | New York | 5,408 | 23,783(22.74%)#1 | 1,007,557(0.54%)#4 |
| 2. | Jamestown | 380 | 23,783(1.60%)#2 | 1,007,557(0.04%)#381 |
| 3. | Buffalo | 329 | 23,783(1.38%)#3 | 1,007,557(0.03%)#446 |
| 4. | Highland-On-The-Lake | 328 | 23,783(1.38%)#4 | 1,007,557(0.03%)#449 |
| 5. | Brighton | 308 | 23,783(1.30%)#5 | 1,007,557(0.03%)#483 |
| 6. | Syracuse | 247 | 23,783(1.04%)#6 | 1,007,557(0.02%)#626 |
| 7. | Rochester | 214 | 23,783(0.90%)#7 | 1,007,557(0.02%)#750 |
| 8. | Mastic Beach | 209 | 23,783(0.88%)#8 | 1,007,557(0.02%)#770 |
| 9. | Farmingville | 175 | 23,783(0.74%)#9 | 1,007,557(0.02%)#930 |
| 10. | Willsboro Point | 169 | 23,783(0.71%)#10 | 1,007,557(0.02%)#959 |
| 11. | Walden | 161 | 23,783(0.68%)#11 | 1,007,557(0.02%)#1,008 |
| 12. | Albany | 160 | 23,783(0.67%)#12 | 1,007,557(0.02%)#1,010 |
| 13. | Seneca Knolls | 159 | 23,783(0.67%)#13 | 1,007,557(0.02%)#1,016 |
| 14. | West Point | 156 | 23,783(0.66%)#14 | 1,007,557(0.02%)#1,038 |
| 15. | Schenectady | 152 | 23,783(0.64%)#15 | 1,007,557(0.02%)#1,065 |
| 16. | Rensselaer | 136 | 23,783(0.57%)#16 | 1,007,557(0.01%)#1,193 |
| 17. | Binghamton | 133 | 23,783(0.56%)#17 | 1,007,557(0.01%)#1,220 |
| 18. | Troy | 129 | 23,783(0.54%)#18 | 1,007,557(0.01%)#1,250 |
| 19. | Fort Drum | 122 | 23,783(0.51%)#19 | 1,007,557(0.01%)#1,306 |
| 20. | Clifton Gardens | 116 | 23,783(0.49%)#20 | 1,007,557(0.01%)#1,363 |
| 21. | Oneonta | 106 | 23,783(0.45%)#21 | 1,007,557(0.01%)#1,488 |
| 22. | Congers | 102 | 23,783(0.43%)#22 | 1,007,557(0.01%)#1,536 |
| 23. | Olean | 99 | 23,783(0.42%)#23 | 1,007,557(0.01%)#1,571 |
| 24. | Saratoga Springs | 98 | 23,783(0.41%)#24 | 1,007,557(0.01%)#1,589 |
| 25. | West Babylon | 97 | 23,783(0.41%)#25 | 1,007,557(0.01%)#1,608 |
| 26. | Farmingdale | 92 | 23,783(0.39%)#26 | 1,007,557(0.01%)#1,701 |
| 27. | Massena | 89 | 23,783(0.37%)#27 | 1,007,557(0.01%)#1,748 |
| 28. | Miller Place | 88 | 23,783(0.37%)#28 | 1,007,557(0.01%)#1,759 |
| 29. | Hicksville | 85 | 23,783(0.36%)#29 | 1,007,557(0.01%)#1,813 |
| 30. | Galeville | 84 | 23,783(0.35%)#30 | 1,007,557(0.01%)#1,847 |
| 31. | Warwick | 83 | 23,783(0.35%)#31 | 1,007,557(0.01%)#1,866 |
| 32. | Ithaca | 81 | 23,783(0.34%)#32 | 1,007,557(0.01%)#1,883 |
| 33. | Chappaqua | 78 | 23,783(0.33%)#33 | 1,007,557(0.01%)#1,947 |
| 34. | Watertown | 76 | 23,783(0.32%)#34 | 1,007,557(0.01%)#1,977 |
| 35. | Lindenhurst | 70 | 23,783(0.29%)#35 | 1,007,557(0.01%)#2,101 |
| 36. | Kingston | 69 | 23,783(0.29%)#36 | 1,007,557(0.01%)#2,138 |
| 37. | Fredonia | 68 | 23,783(0.29%)#37 | 1,007,557(0.01%)#2,164 |
| 38. | Utica | 67 | 23,783(0.28%)#38 | 1,007,557(0.01%)#2,177 |
| 39. | Dryden | 66 | 23,783(0.28%)#39 | 1,007,557(0.01%)#2,231 |
| 40. | Lowville | 64 | 23,783(0.27%)#40 | 1,007,557(0.01%)#2,290 |
| 41. | Mastic | 63 | 23,783(0.26%)#41 | 1,007,557(0.01%)#2,304 |
| 42. | Coram | 62 | 23,783(0.26%)#42 | 1,007,557(0.01%)#2,328 |
| 43. | Glens Falls | 62 | 23,783(0.26%)#43 | 1,007,557(0.01%)#2,336 |
| 44. | Rye | 59 | 23,783(0.25%)#44 | 1,007,557(0.01%)#2,424 |
| 45. | Tonawanda | 58 | 23,783(0.24%)#45 | 1,007,557(0.01%)#2,447 |
| 46. | Valley Cottage | 58 | 23,783(0.24%)#46 | 1,007,557(0.01%)#2,464 |
| 47. | West Elmira | 57 | 23,783(0.24%)#47 | 1,007,557(0.01%)#2,518 |
| 48. | New Rochelle | 56 | 23,783(0.24%)#48 | 1,007,557(0.01%)#2,530 |
| 49. | Calverton | 54 | 23,783(0.23%)#49 | 1,007,557(0.01%)#2,605 |
| 50. | Sag Harbor | 54 | 23,783(0.23%)#50 | 1,007,557(0.01%)#2,609 |
| 51. | Plattsburgh | 53 | 23,783(0.22%)#51 | 1,007,557(0.01%)#2,631 |
| 52. | Oswego | 53 | 23,783(0.22%)#52 | 1,007,557(0.01%)#2,633 |
| 53. | Shirley | 52 | 23,783(0.22%)#53 | 1,007,557(0.01%)#2,662 |
| 54. | Cornwall On Hudson | 51 | 23,783(0.21%)#54 | 1,007,557(0.01%)#2,727 |
| 55. | Cheektowaga | 49 | 23,783(0.21%)#55 | 1,007,557(0.00%)#2,770 |
| 56. | Pelham | 48 | 23,783(0.20%)#56 | 1,007,557(0.00%)#2,830 |
| 57. | Patchogue | 47 | 23,783(0.20%)#57 | 1,007,557(0.00%)#2,865 |
| 58. | Centerport | 47 | 23,783(0.20%)#58 | 1,007,557(0.00%)#2,876 |
| 59. | Colonie | 46 | 23,783(0.19%)#59 | 1,007,557(0.00%)#2,917 |
| 60. | Noyack | 46 | 23,783(0.19%)#60 | 1,007,557(0.00%)#2,930 |
| 61. | Massapequa Park | 43 | 23,783(0.18%)#61 | 1,007,557(0.00%)#3,017 |
| 62. | East Shoreham | 43 | 23,783(0.18%)#62 | 1,007,557(0.00%)#3,034 |
| 63. | Fairmount | 42 | 23,783(0.18%)#63 | 1,007,557(0.00%)#3,082 |
| 64. | Angola On The Lake | 41 | 23,783(0.17%)#64 | 1,007,557(0.00%)#3,141 |
| 65. | Greenville Cdp Westchester County | 40 | 23,783(0.17%)#65 | 1,007,557(0.00%)#3,174 |
| 66. | Baldwinsville | 40 | 23,783(0.17%)#66 | 1,007,557(0.00%)#3,180 |
| 67. | Coxsackie | 39 | 23,783(0.16%)#67 | 1,007,557(0.00%)#3,251 |
| 68. | East Rockaway | 37 | 23,783(0.16%)#68 | 1,007,557(0.00%)#3,344 |
| 69. | Hurley | 37 | 23,783(0.16%)#69 | 1,007,557(0.00%)#3,365 |
| 70. | Lake Erie Beach | 37 | 23,783(0.16%)#70 | 1,007,557(0.00%)#3,367 |
| 71. | Horseheads North | 37 | 23,783(0.16%)#71 | 1,007,557(0.00%)#3,369 |
| 72. | Addison | 37 | 23,783(0.16%)#72 | 1,007,557(0.00%)#3,376 |
| 73. | Clayton | 37 | 23,783(0.16%)#73 | 1,007,557(0.00%)#3,379 |
| 74. | Niagara Falls | 36 | 23,783(0.15%)#74 | 1,007,557(0.00%)#3,393 |
| 75. | Harrison | 36 | 23,783(0.15%)#75 | 1,007,557(0.00%)#3,401 |
| 76. | Endicott | 36 | 23,783(0.15%)#76 | 1,007,557(0.00%)#3,411 |
| 77. | North Lindenhurst | 36 | 23,783(0.15%)#77 | 1,007,557(0.00%)#3,413 |
| 78. | Philmont | 36 | 23,783(0.15%)#78 | 1,007,557(0.00%)#3,449 |
| 79. | Macdonnell Heights | 36 | 23,783(0.15%)#79 | 1,007,557(0.00%)#3,450 |
| 80. | Albertson | 35 | 23,783(0.15%)#80 | 1,007,557(0.00%)#3,479 |
| 81. | Huntington Station | 34 | 23,783(0.14%)#81 | 1,007,557(0.00%)#3,518 |
| 82. | Sound Beach | 34 | 23,783(0.14%)#82 | 1,007,557(0.00%)#3,548 |
| 83. | Fairport | 34 | 23,783(0.14%)#83 | 1,007,557(0.00%)#3,552 |
| 84. | Ransomville | 34 | 23,783(0.14%)#84 | 1,007,557(0.00%)#3,572 |
| 85. | Mamaroneck | 33 | 23,783(0.14%)#85 | 1,007,557(0.00%)#3,593 |
| 86. | Irondequoit | 32 | 23,783(0.13%)#86 | 1,007,557(0.00%)#3,641 |
| 87. | Rome | 32 | 23,783(0.13%)#87 | 1,007,557(0.00%)#3,648 |
| 88. | Glen Head | 32 | 23,783(0.13%)#88 | 1,007,557(0.00%)#3,677 |
| 89. | West Hempstead | 31 | 23,783(0.13%)#89 | 1,007,557(0.00%)#3,722 |
| 90. | Ridge | 31 | 23,783(0.13%)#90 | 1,007,557(0.00%)#3,735 |
| 91. | Smithtown | 30 | 23,783(0.13%)#91 | 1,007,557(0.00%)#3,801 |
| 92. | Balmville | 30 | 23,783(0.13%)#92 | 1,007,557(0.00%)#3,839 |
| 93. | Marlboro | 30 | 23,783(0.13%)#93 | 1,007,557(0.00%)#3,840 |
| 94. | Walworth | 30 | 23,783(0.13%)#94 | 1,007,557(0.00%)#3,862 |
| 95. | Auburn | 29 | 23,783(0.12%)#95 | 1,007,557(0.00%)#3,882 |
| 96. | Manhasset | 29 | 23,783(0.12%)#96 | 1,007,557(0.00%)#3,909 |
| 97. | Southport | 29 | 23,783(0.12%)#97 | 1,007,557(0.00%)#3,912 |
| 98. | Menands | 29 | 23,783(0.12%)#98 | 1,007,557(0.00%)#3,919 |
| 99. | Woodstock | 29 | 23,783(0.12%)#99 | 1,007,557(0.00%)#3,934 |
| 100. | Sackets Harbor | 29 | 23,783(0.12%)#100 | 1,007,557(0.00%)#3,947 |
Common Questions
What are the Top 10 Cities with the Largest Scandinavian Community in New York?
Top 10 Cities with the Largest Scandinavian Community in New York are:
#1
5,408
#2
380
#3
329
#4
308
#5
247
#6
214
#7
209
#8
175
#9
161
#10
160
What city has the Largest Scandinavian Community in New York?
New York has the Largest Scandinavian Community in New York with 5,408.
What is the Total Scandinavian Population in the State of New York?
Total Scandinavian Population in New York is 23,783.
What is the Total Scandinavian Population in the United States?
Total Scandinavian Population in the United States is 1,007,557.