Cities with the Largest Scandinavian Community in Massachusetts
RELATED REPORTS & OPTIONS
Scandinavian
Massachusetts
Compare Cities
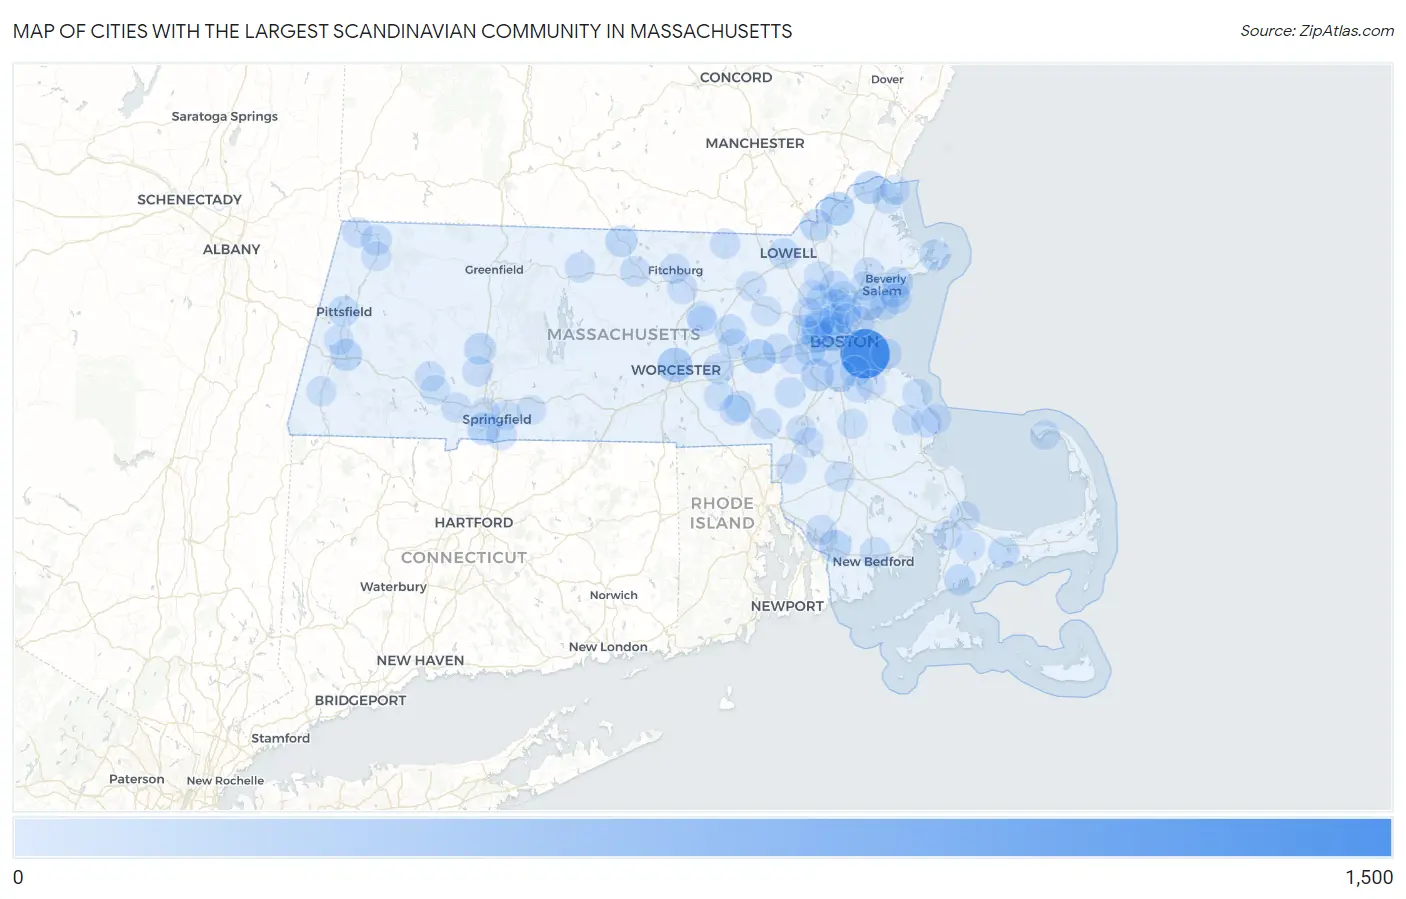
Map of Cities with the Largest Scandinavian Community in Massachusetts
0
1,500
Cities with the Largest Scandinavian Community in Massachusetts
| City | Scandinavian | vs State | vs National | |
| 1. | Boston | 1,118 | 11,764(9.50%)#1 | 1,007,557(0.11%)#89 |
| 2. | Worcester | 269 | 11,764(2.29%)#2 | 1,007,557(0.03%)#568 |
| 3. | Cambridge | 263 | 11,764(2.24%)#3 | 1,007,557(0.03%)#585 |
| 4. | Framingham | 221 | 11,764(1.88%)#4 | 1,007,557(0.02%)#716 |
| 5. | Haverhill | 214 | 11,764(1.82%)#5 | 1,007,557(0.02%)#752 |
| 6. | Lynn | 200 | 11,764(1.70%)#6 | 1,007,557(0.02%)#794 |
| 7. | Dedham | 171 | 11,764(1.45%)#7 | 1,007,557(0.02%)#945 |
| 8. | Amesbury Town | 166 | 11,764(1.41%)#8 | 1,007,557(0.02%)#978 |
| 9. | Watertown Town | 151 | 11,764(1.28%)#9 | 1,007,557(0.01%)#1,074 |
| 10. | Agawam Town | 147 | 11,764(1.25%)#10 | 1,007,557(0.01%)#1,108 |
| 11. | Fall River | 138 | 11,764(1.17%)#11 | 1,007,557(0.01%)#1,174 |
| 12. | Somerville | 125 | 11,764(1.06%)#12 | 1,007,557(0.01%)#1,278 |
| 13. | Belmont | 121 | 11,764(1.03%)#13 | 1,007,557(0.01%)#1,312 |
| 14. | Lee | 120 | 11,764(1.02%)#14 | 1,007,557(0.01%)#1,327 |
| 15. | Methuen Town | 118 | 11,764(1.00%)#15 | 1,007,557(0.01%)#1,337 |
| 16. | Northampton | 111 | 11,764(0.94%)#16 | 1,007,557(0.01%)#1,414 |
| 17. | Brookline | 107 | 11,764(0.91%)#17 | 1,007,557(0.01%)#1,464 |
| 18. | Winchendon | 104 | 11,764(0.88%)#18 | 1,007,557(0.01%)#1,520 |
| 19. | Salem | 103 | 11,764(0.88%)#19 | 1,007,557(0.01%)#1,521 |
| 20. | Amherst | 92 | 11,764(0.78%)#20 | 1,007,557(0.01%)#1,695 |
| 21. | Gloucester | 90 | 11,764(0.77%)#21 | 1,007,557(0.01%)#1,727 |
| 22. | Beverly | 89 | 11,764(0.76%)#22 | 1,007,557(0.01%)#1,738 |
| 23. | Barnstable Town | 87 | 11,764(0.74%)#23 | 1,007,557(0.01%)#1,766 |
| 24. | Milton | 87 | 11,764(0.74%)#24 | 1,007,557(0.01%)#1,769 |
| 25. | East Falmouth | 84 | 11,764(0.71%)#25 | 1,007,557(0.01%)#1,843 |
| 26. | Woburn | 83 | 11,764(0.71%)#26 | 1,007,557(0.01%)#1,853 |
| 27. | Stoneham | 82 | 11,764(0.70%)#27 | 1,007,557(0.01%)#1,870 |
| 28. | Hudson | 76 | 11,764(0.65%)#28 | 1,007,557(0.01%)#1,982 |
| 29. | Milford | 68 | 11,764(0.58%)#29 | 1,007,557(0.01%)#2,156 |
| 30. | Lowell | 64 | 11,764(0.54%)#30 | 1,007,557(0.01%)#2,265 |
| 31. | Medford | 64 | 11,764(0.54%)#31 | 1,007,557(0.01%)#2,266 |
| 32. | Melrose | 64 | 11,764(0.54%)#32 | 1,007,557(0.01%)#2,271 |
| 33. | Waltham | 62 | 11,764(0.53%)#33 | 1,007,557(0.01%)#2,325 |
| 34. | Reading | 62 | 11,764(0.53%)#34 | 1,007,557(0.01%)#2,330 |
| 35. | Westborough | 62 | 11,764(0.53%)#35 | 1,007,557(0.01%)#2,347 |
| 36. | Newton | 61 | 11,764(0.52%)#36 | 1,007,557(0.01%)#2,353 |
| 37. | Pittsfield | 61 | 11,764(0.52%)#37 | 1,007,557(0.01%)#2,356 |
| 38. | North Adams | 61 | 11,764(0.52%)#38 | 1,007,557(0.01%)#2,366 |
| 39. | Greenfield | 59 | 11,764(0.50%)#39 | 1,007,557(0.01%)#2,423 |
| 40. | Hull | 57 | 11,764(0.48%)#40 | 1,007,557(0.01%)#2,505 |
| 41. | Hopedale | 56 | 11,764(0.48%)#41 | 1,007,557(0.01%)#2,552 |
| 42. | Marlborough | 51 | 11,764(0.43%)#42 | 1,007,557(0.01%)#2,699 |
| 43. | New Bedford | 49 | 11,764(0.42%)#43 | 1,007,557(0.00%)#2,768 |
| 44. | Medfield | 48 | 11,764(0.41%)#44 | 1,007,557(0.00%)#2,832 |
| 45. | Franklin Town | 47 | 11,764(0.40%)#45 | 1,007,557(0.00%)#2,852 |
| 46. | North Pembroke | 46 | 11,764(0.39%)#46 | 1,007,557(0.00%)#2,933 |
| 47. | Longmeadow | 43 | 11,764(0.37%)#47 | 1,007,557(0.00%)#3,021 |
| 48. | Gardner | 40 | 11,764(0.34%)#48 | 1,007,557(0.00%)#3,156 |
| 49. | Leominster | 39 | 11,764(0.33%)#49 | 1,007,557(0.00%)#3,205 |
| 50. | Wakefield | 39 | 11,764(0.33%)#50 | 1,007,557(0.00%)#3,208 |
| 51. | Malden | 38 | 11,764(0.32%)#51 | 1,007,557(0.00%)#3,265 |
| 52. | Athol | 37 | 11,764(0.31%)#52 | 1,007,557(0.00%)#3,346 |
| 53. | Attleboro | 36 | 11,764(0.31%)#53 | 1,007,557(0.00%)#3,394 |
| 54. | Somerset | 36 | 11,764(0.31%)#54 | 1,007,557(0.00%)#3,409 |
| 55. | Marblehead | 35 | 11,764(0.30%)#55 | 1,007,557(0.00%)#3,463 |
| 56. | Easthampton Town | 35 | 11,764(0.30%)#56 | 1,007,557(0.00%)#3,465 |
| 57. | Williamstown | 35 | 11,764(0.30%)#57 | 1,007,557(0.00%)#3,481 |
| 58. | Quincy | 33 | 11,764(0.28%)#58 | 1,007,557(0.00%)#3,584 |
| 59. | Arlington | 32 | 11,764(0.27%)#59 | 1,007,557(0.00%)#3,644 |
| 60. | Lexington | 32 | 11,764(0.27%)#60 | 1,007,557(0.00%)#3,647 |
| 61. | Danvers | 32 | 11,764(0.27%)#61 | 1,007,557(0.00%)#3,650 |
| 62. | Revere | 31 | 11,764(0.26%)#62 | 1,007,557(0.00%)#3,710 |
| 63. | Westfield | 28 | 11,764(0.24%)#63 | 1,007,557(0.00%)#3,964 |
| 64. | Marshfield | 28 | 11,764(0.24%)#64 | 1,007,557(0.00%)#4,017 |
| 65. | Swampscott | 27 | 11,764(0.23%)#65 | 1,007,557(0.00%)#4,072 |
| 66. | Pepperell | 27 | 11,764(0.23%)#66 | 1,007,557(0.00%)#4,117 |
| 67. | Springfield | 26 | 11,764(0.22%)#67 | 1,007,557(0.00%)#4,141 |
| 68. | Scituate | 26 | 11,764(0.22%)#68 | 1,007,557(0.00%)#4,193 |
| 69. | Huntington | 26 | 11,764(0.22%)#69 | 1,007,557(0.00%)#4,226 |
| 70. | Wellesley | 25 | 11,764(0.21%)#70 | 1,007,557(0.00%)#4,241 |
| 71. | Clinton | 25 | 11,764(0.21%)#71 | 1,007,557(0.00%)#4,271 |
| 72. | Fitchburg | 24 | 11,764(0.20%)#72 | 1,007,557(0.00%)#4,335 |
| 73. | Brockton | 23 | 11,764(0.20%)#73 | 1,007,557(0.00%)#4,437 |
| 74. | Newburyport | 23 | 11,764(0.20%)#74 | 1,007,557(0.00%)#4,453 |
| 75. | Mansfield Center | 22 | 11,764(0.19%)#75 | 1,007,557(0.00%)#4,576 |
| 76. | Forestdale | 20 | 11,764(0.17%)#76 | 1,007,557(0.00%)#4,832 |
| 77. | Taunton | 19 | 11,764(0.16%)#77 | 1,007,557(0.00%)#4,894 |
| 78. | Braintree Town | 19 | 11,764(0.16%)#78 | 1,007,557(0.00%)#4,896 |
| 79. | Cochituate | 19 | 11,764(0.16%)#79 | 1,007,557(0.00%)#4,957 |
| 80. | Salisbury | 19 | 11,764(0.16%)#80 | 1,007,557(0.00%)#4,964 |
| 81. | Wilbraham | 19 | 11,764(0.16%)#81 | 1,007,557(0.00%)#4,977 |
| 82. | Ocean Bluff Brant Rock | 18 | 11,764(0.15%)#82 | 1,007,557(0.00%)#5,107 |
| 83. | Littleton Common | 17 | 11,764(0.14%)#83 | 1,007,557(0.00%)#5,286 |
| 84. | Great Barrington | 17 | 11,764(0.14%)#84 | 1,007,557(0.00%)#5,311 |
| 85. | Russell | 17 | 11,764(0.14%)#85 | 1,007,557(0.00%)#5,337 |
| 86. | Foxborough | 16 | 11,764(0.14%)#86 | 1,007,557(0.00%)#5,421 |
| 87. | Sagamore | 16 | 11,764(0.14%)#87 | 1,007,557(0.00%)#5,449 |
| 88. | South Lancaster | 16 | 11,764(0.14%)#88 | 1,007,557(0.00%)#5,501 |
| 89. | Monument Beach | 15 | 11,764(0.13%)#89 | 1,007,557(0.00%)#5,652 |
| 90. | Lenox | 15 | 11,764(0.13%)#90 | 1,007,557(0.00%)#5,670 |
| 91. | Weymouth Town | 14 | 11,764(0.12%)#91 | 1,007,557(0.00%)#5,738 |
| 92. | North Attleborough | 14 | 11,764(0.12%)#92 | 1,007,557(0.00%)#5,741 |
| 93. | West Springfield Town | 13 | 11,764(0.11%)#93 | 1,007,557(0.00%)#5,946 |
| 94. | Burlington | 13 | 11,764(0.11%)#94 | 1,007,557(0.00%)#5,950 |
| 95. | Wilmington | 13 | 11,764(0.11%)#95 | 1,007,557(0.00%)#5,951 |
| 96. | West Concord | 13 | 11,764(0.11%)#96 | 1,007,557(0.00%)#6,000 |
| 97. | Adams | 13 | 11,764(0.11%)#97 | 1,007,557(0.00%)#6,006 |
| 98. | Peabody | 12 | 11,764(0.10%)#98 | 1,007,557(0.00%)#6,127 |
| 99. | Provincetown | 12 | 11,764(0.10%)#99 | 1,007,557(0.00%)#6,224 |
| 100. | Upton | 12 | 11,764(0.10%)#100 | 1,007,557(0.00%)#6,243 |
Common Questions
What are the Top 10 Cities with the Largest Scandinavian Community in Massachusetts?
Top 10 Cities with the Largest Scandinavian Community in Massachusetts are:
#1
1,118
#2
269
#3
263
#4
221
#5
214
#6
200
#7
171
#8
166
#9
151
#10
147
What city has the Largest Scandinavian Community in Massachusetts?
Boston has the Largest Scandinavian Community in Massachusetts with 1,118.
What is the Total Scandinavian Population in the State of Massachusetts?
Total Scandinavian Population in Massachusetts is 11,764.
What is the Total Scandinavian Population in the United States?
Total Scandinavian Population in the United States is 1,007,557.