Cities with the Highest Percentage of State Government Employees in Maryland
RELATED REPORTS & OPTIONS
State Government Employees
Maryland
Compare Cities
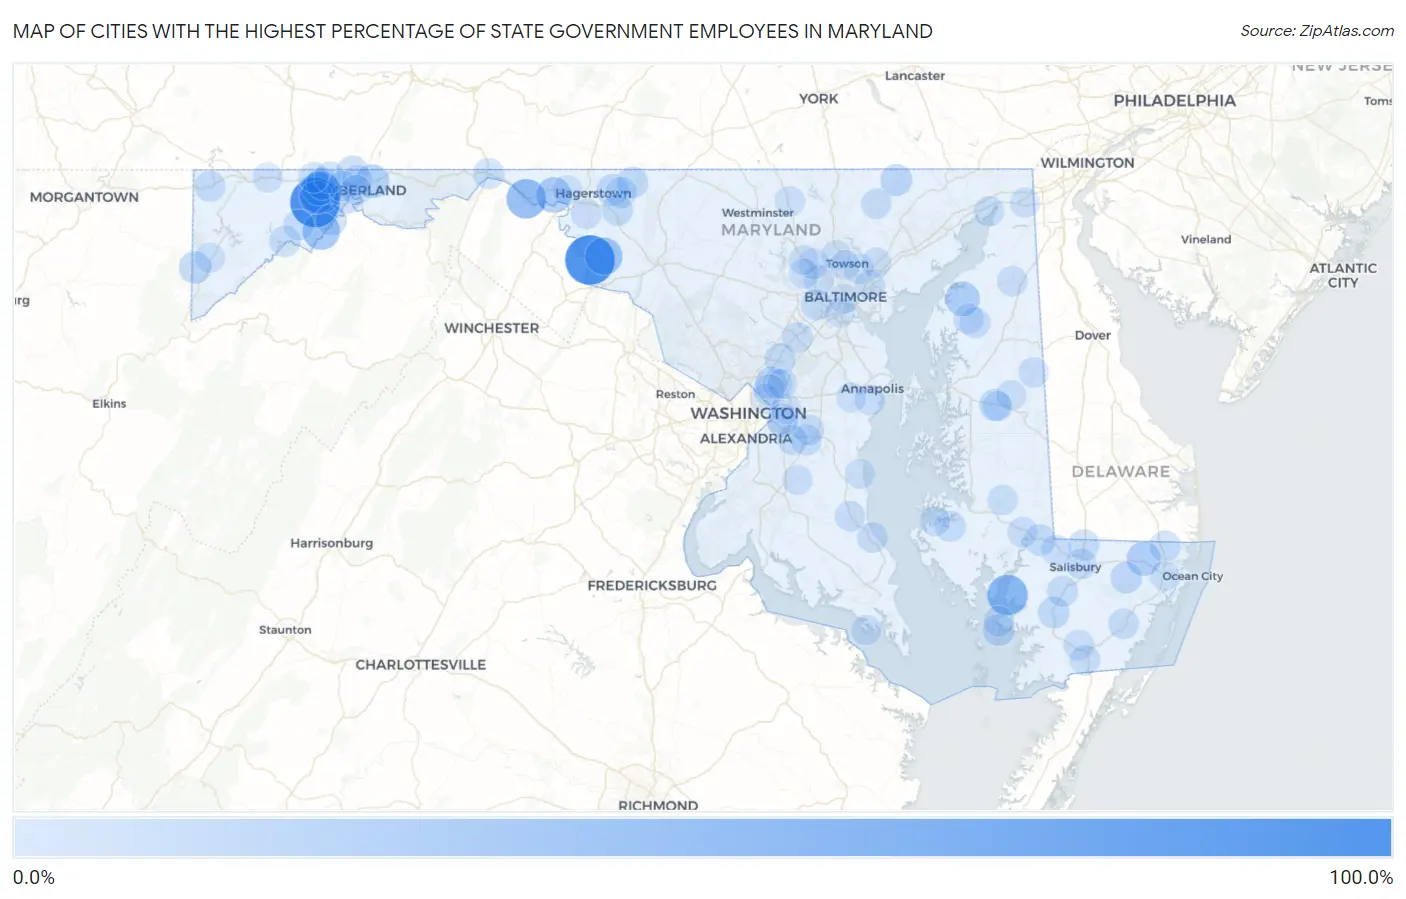
Map of Cities with the Highest Percentage of State Government Employees in Maryland
0.0%
100.0%
Cities with the Highest Percentage of State Government Employees in Maryland
| City | % State Government Employees | vs State | vs National | |
| 1. | Antietam | 100.0% | 4.3%(+95.7)#1 | 4.2%(+95.8)#13 |
| 2. | National | 100.0% | 4.3%(+95.7)#2 | 4.2%(+95.8)#24 |
| 3. | Grahamtown | 64.5% | 4.3%(+60.1)#3 | 4.2%(+60.2)#64 |
| 4. | Nanticoke | 55.5% | 4.3%(+51.1)#4 | 4.2%(+51.2)#102 |
| 5. | Big Pool | 50.0% | 4.3%(+45.7)#5 | 4.2%(+45.8)#129 |
| 6. | Danville | 40.3% | 4.3%(+35.9)#6 | 4.2%(+36.0)#214 |
| 7. | Trego Rohrersville Station | 40.2% | 4.3%(+35.9)#7 | 4.2%(+36.0)#215 |
| 8. | Charlton | 31.3% | 4.3%(+27.0)#8 | 4.2%(+27.1)#398 |
| 9. | Butlertown | 27.2% | 4.3%(+22.9)#9 | 4.2%(+23.0)#565 |
| 10. | Whaleyville | 25.0% | 4.3%(+20.7)#10 | 4.2%(+20.8)#666 |
| 11. | Pleasant Grove | 22.8% | 4.3%(+18.5)#11 | 4.2%(+18.6)#802 |
| 12. | Frostburg | 21.1% | 4.3%(+16.8)#12 | 4.2%(+16.8)#961 |
| 13. | Shaft | 20.8% | 4.3%(+16.5)#13 | 4.2%(+16.5)#989 |
| 14. | Crellin | 16.8% | 4.3%(+12.5)#14 | 4.2%(+12.6)#1,514 |
| 15. | Zihlman | 16.3% | 4.3%(+11.9)#15 | 4.2%(+12.0)#1,635 |
| 16. | College Park | 15.9% | 4.3%(+11.6)#16 | 4.2%(+11.7)#1,694 |
| 17. | Deal Island | 15.2% | 4.3%(+10.9)#17 | 4.2%(+10.9)#1,868 |
| 18. | Pylesville | 15.2% | 4.3%(+10.9)#18 | 4.2%(+10.9)#1,870 |
| 19. | Abingdon | 15.2% | 4.3%(+10.8)#19 | 4.2%(+10.9)#1,874 |
| 20. | Queen Anne | 14.7% | 4.3%(+10.4)#20 | 4.2%(+10.5)#1,991 |
| 21. | Chewsville | 14.5% | 4.3%(+10.2)#21 | 4.2%(+10.3)#2,038 |
| 22. | Bowling Green | 13.9% | 4.3%(+9.54)#22 | 4.2%(+9.62)#2,280 |
| 23. | Princess Anne | 13.7% | 4.3%(+9.34)#23 | 4.2%(+9.42)#2,339 |
| 24. | Ellerslie | 13.6% | 4.3%(+9.32)#24 | 4.2%(+9.39)#2,346 |
| 25. | Powellville | 13.5% | 4.3%(+9.19)#25 | 4.2%(+9.27)#2,383 |
| 26. | Edgemont | 13.0% | 4.3%(+8.69)#26 | 4.2%(+8.77)#2,560 |
| 27. | Mount Savage | 12.2% | 4.3%(+7.89)#27 | 4.2%(+7.96)#2,889 |
| 28. | Mardela Springs | 12.2% | 4.3%(+7.86)#28 | 4.2%(+7.93)#2,899 |
| 29. | Cavetown | 11.8% | 4.3%(+7.45)#29 | 4.2%(+7.52)#3,079 |
| 30. | Delmar | 11.7% | 4.3%(+7.38)#30 | 4.2%(+7.46)#3,121 |
| 31. | Bagtown | 11.6% | 4.3%(+7.29)#31 | 4.2%(+7.37)#3,164 |
| 32. | Bloomington | 11.3% | 4.3%(+6.97)#32 | 4.2%(+7.05)#3,332 |
| 33. | Bier | 11.0% | 4.3%(+6.67)#33 | 4.2%(+6.75)#3,512 |
| 34. | Eden | 10.9% | 4.3%(+6.59)#34 | 4.2%(+6.67)#3,552 |
| 35. | Bishopville | 10.9% | 4.3%(+6.56)#35 | 4.2%(+6.63)#3,576 |
| 36. | Konterra | 10.8% | 4.3%(+6.43)#36 | 4.2%(+6.51)#3,649 |
| 37. | Church Creek | 10.6% | 4.3%(+6.32)#37 | 4.2%(+6.40)#3,717 |
| 38. | Hancock | 10.6% | 4.3%(+6.27)#38 | 4.2%(+6.35)#3,746 |
| 39. | Friendsville | 10.5% | 4.3%(+6.15)#39 | 4.2%(+6.23)#3,811 |
| 40. | Queensland | 10.3% | 4.3%(+5.97)#40 | 4.2%(+6.04)#3,921 |
| 41. | University Park | 10.1% | 4.3%(+5.76)#41 | 4.2%(+5.83)#4,053 |
| 42. | Savage | 10.0% | 4.3%(+5.65)#42 | 4.2%(+5.72)#4,126 |
| 43. | Barton | 9.9% | 4.3%(+5.63)#43 | 4.2%(+5.70)#4,142 |
| 44. | Kingstown | 9.8% | 4.3%(+5.46)#44 | 4.2%(+5.54)#4,244 |
| 45. | St Leonard | 9.5% | 4.3%(+5.19)#45 | 4.2%(+5.27)#4,445 |
| 46. | Snow Hill | 9.4% | 4.3%(+5.13)#46 | 4.2%(+5.21)#4,484 |
| 47. | La Vale | 9.4% | 4.3%(+5.11)#47 | 4.2%(+5.18)#4,498 |
| 48. | Salisbury | 9.4% | 4.3%(+5.08)#48 | 4.2%(+5.16)#4,508 |
| 49. | Marlboro Village | 9.1% | 4.3%(+4.79)#49 | 4.2%(+4.86)#4,723 |
| 50. | Chance | 9.1% | 4.3%(+4.77)#50 | 4.2%(+4.85)#4,740 |
| 51. | Jarrettsville | 9.0% | 4.3%(+4.69)#51 | 4.2%(+4.77)#4,802 |
| 52. | Vienna | 8.9% | 4.3%(+4.58)#52 | 4.2%(+4.66)#4,888 |
| 53. | Lochearn | 8.9% | 4.3%(+4.55)#53 | 4.2%(+4.62)#4,911 |
| 54. | Finzel | 8.8% | 4.3%(+4.52)#54 | 4.2%(+4.59)#4,945 |
| 55. | Catonsville | 8.7% | 4.3%(+4.41)#55 | 4.2%(+4.48)#5,022 |
| 56. | East New Market | 8.5% | 4.3%(+4.20)#56 | 4.2%(+4.28)#5,207 |
| 57. | Hebron | 8.5% | 4.3%(+4.13)#57 | 4.2%(+4.21)#5,281 |
| 58. | Walker Mill | 8.4% | 4.3%(+4.11)#58 | 4.2%(+4.18)#5,299 |
| 59. | Bowmans Addition | 8.4% | 4.3%(+4.10)#59 | 4.2%(+4.18)#5,301 |
| 60. | Chestertown | 8.4% | 4.3%(+4.07)#60 | 4.2%(+4.15)#5,332 |
| 61. | Galena | 8.3% | 4.3%(+4.01)#61 | 4.2%(+4.09)#5,390 |
| 62. | Garrison | 8.3% | 4.3%(+3.94)#62 | 4.2%(+4.02)#5,461 |
| 63. | West Pocomoke | 8.2% | 4.3%(+3.91)#63 | 4.2%(+3.99)#5,488 |
| 64. | Charlestown | 8.0% | 4.3%(+3.72)#64 | 4.2%(+3.79)#5,667 |
| 65. | Melwood | 8.0% | 4.3%(+3.71)#65 | 4.2%(+3.78)#5,681 |
| 66. | Prince Frederick | 7.9% | 4.3%(+3.54)#66 | 4.2%(+3.61)#5,863 |
| 67. | St James | 7.7% | 4.3%(+3.37)#67 | 4.2%(+3.45)#6,027 |
| 68. | Parkville | 7.5% | 4.3%(+3.14)#68 | 4.2%(+3.22)#6,302 |
| 69. | Piney Point | 7.4% | 4.3%(+3.05)#69 | 4.2%(+3.13)#6,386 |
| 70. | Cumberland | 7.4% | 4.3%(+3.04)#70 | 4.2%(+3.12)#6,405 |
| 71. | Annapolis Neck | 7.3% | 4.3%(+3.01)#71 | 4.2%(+3.08)#6,443 |
| 72. | Goldsboro | 7.3% | 4.3%(+3.00)#72 | 4.2%(+3.07)#6,459 |
| 73. | Pocomoke City | 7.3% | 4.3%(+2.97)#73 | 4.2%(+3.04)#6,492 |
| 74. | Woodlawn Cdp Baltimore County | 7.3% | 4.3%(+2.96)#74 | 4.2%(+3.03)#6,506 |
| 75. | Chesapeake Beach | 7.1% | 4.3%(+2.81)#75 | 4.2%(+2.89)#6,671 |
| 76. | Mount Rainier | 7.1% | 4.3%(+2.78)#76 | 4.2%(+2.86)#6,709 |
| 77. | Randallstown | 7.1% | 4.3%(+2.77)#77 | 4.2%(+2.85)#6,722 |
| 78. | Summerfield | 7.0% | 4.3%(+2.68)#78 | 4.2%(+2.76)#6,822 |
| 79. | Berwyn Heights | 7.0% | 4.3%(+2.68)#79 | 4.2%(+2.76)#6,823 |
| 80. | Greenbelt | 7.0% | 4.3%(+2.68)#80 | 4.2%(+2.75)#6,824 |
| 81. | Hampstead | 7.0% | 4.3%(+2.67)#81 | 4.2%(+2.74)#6,843 |
| 82. | Ridgely | 6.9% | 4.3%(+2.55)#82 | 4.2%(+2.63)#6,971 |
| 83. | Baltimore Highlands | 6.8% | 4.3%(+2.51)#83 | 4.2%(+2.59)#7,025 |
| 84. | Grantsville | 6.7% | 4.3%(+2.42)#84 | 4.2%(+2.50)#7,138 |
| 85. | Baltimore | 6.7% | 4.3%(+2.40)#85 | 4.2%(+2.48)#7,163 |
| 86. | Riva | 6.7% | 4.3%(+2.37)#86 | 4.2%(+2.44)#7,209 |
| 87. | Elkton | 6.7% | 4.3%(+2.35)#87 | 4.2%(+2.43)#7,218 |
| 88. | Perry Hall | 6.6% | 4.3%(+2.31)#88 | 4.2%(+2.39)#7,288 |
| 89. | Cedarville | 6.6% | 4.3%(+2.29)#89 | 4.2%(+2.37)#7,316 |
| 90. | Oakland | 6.6% | 4.3%(+2.29)#90 | 4.2%(+2.36)#7,320 |
| 91. | Mays Chapel | 6.6% | 4.3%(+2.26)#91 | 4.2%(+2.34)#7,350 |
| 92. | Madison | 6.6% | 4.3%(+2.26)#92 | 4.2%(+2.34)#7,354 |
| 93. | Romancoke | 6.6% | 4.3%(+2.24)#93 | 4.2%(+2.32)#7,386 |
| 94. | Berlin | 6.5% | 4.3%(+2.22)#94 | 4.2%(+2.30)#7,410 |
| 95. | Wilson Conococheague | 6.5% | 4.3%(+2.19)#95 | 4.2%(+2.27)#7,466 |
| 96. | Owings Mills | 6.5% | 4.3%(+2.17)#96 | 4.2%(+2.25)#7,490 |
| 97. | Rosedale | 6.5% | 4.3%(+2.15)#97 | 4.2%(+2.23)#7,512 |
| 98. | District Heights | 6.4% | 4.3%(+2.12)#98 | 4.2%(+2.20)#7,553 |
| 99. | Hillsboro | 6.4% | 4.3%(+2.09)#99 | 4.2%(+2.17)#7,587 |
| 100. | Towson | 6.4% | 4.3%(+2.04)#100 | 4.2%(+2.11)#7,672 |
Common Questions
What are the Top 10 Cities with the Highest Percentage of State Government Employees in Maryland?
Top 10 Cities with the Highest Percentage of State Government Employees in Maryland are:
#1
100.0%
#2
100.0%
#3
64.5%
#4
55.5%
#5
50.0%
#6
40.3%
#7
40.2%
#8
31.3%
#9
27.2%
#10
25.0%
What city has the Highest Percentage of State Government Employees in Maryland?
Antietam has the Highest Percentage of State Government Employees in Maryland with 100.0%.
What is the Percentage of State Government Employees in the State of Maryland?
Percentage of State Government Employees in Maryland is 4.3%.
What is the Percentage of State Government Employees in the United States?
Percentage of State Government Employees in the United States is 4.2%.