Cities with the Highest Percentage of State Government Employees in Mississippi
RELATED REPORTS & OPTIONS
State Government Employees
Mississippi
Compare Cities
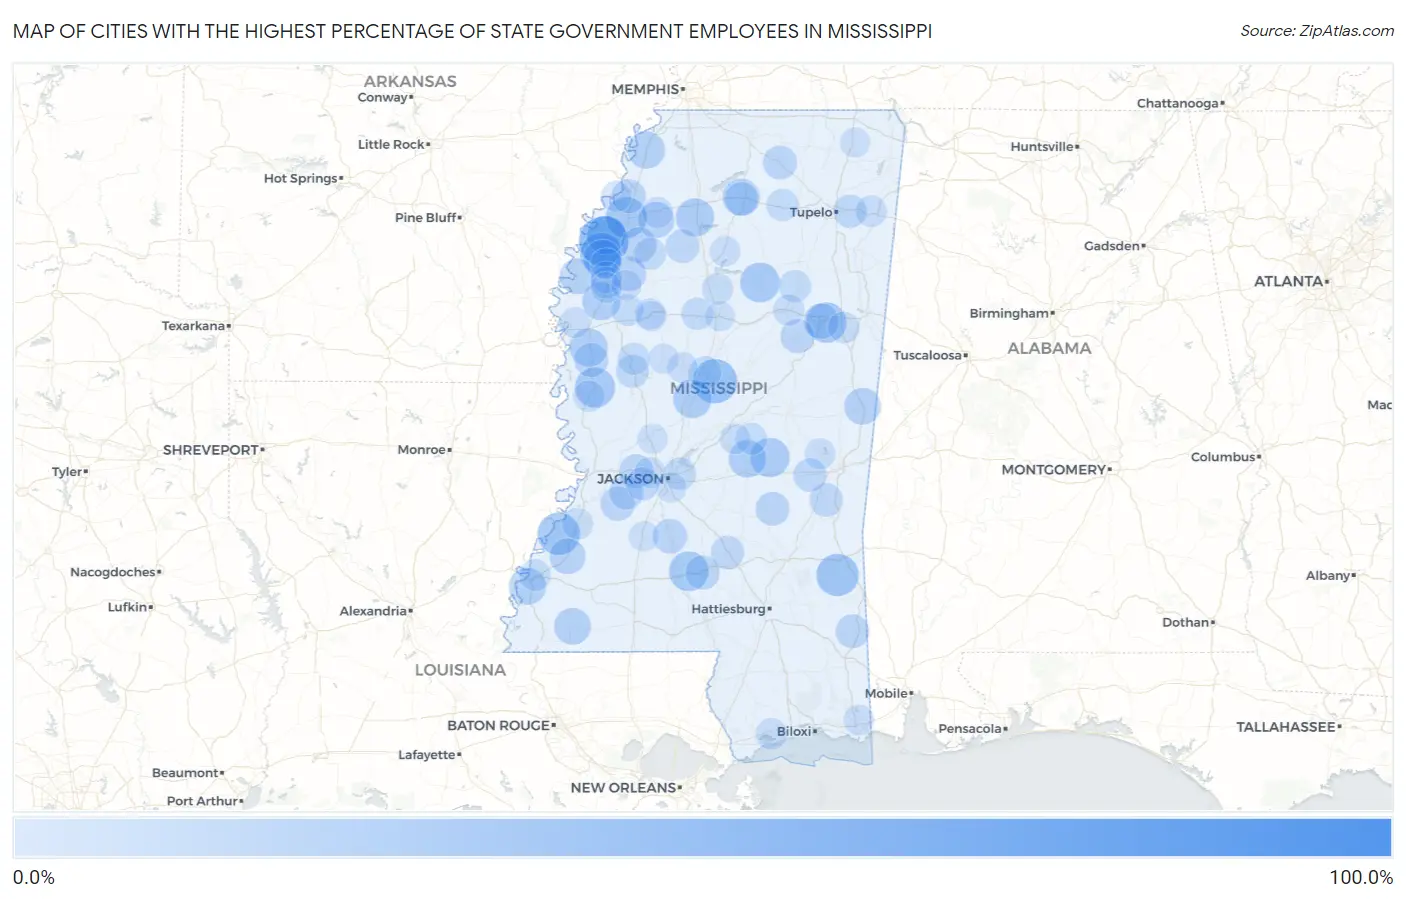
Map of Cities with the Highest Percentage of State Government Employees in Mississippi
0.0%
100.0%
Cities with the Highest Percentage of State Government Employees in Mississippi
| City | % State Government Employees | vs State | vs National | |
| 1. | Scott | 100.0% | 8.2%(+91.8)#1 | 4.2%(+95.8)#18 |
| 2. | Runnelstown | 63.9% | 8.2%(+55.7)#2 | 4.2%(+59.6)#66 |
| 3. | Duncan | 57.4% | 8.2%(+49.2)#3 | 4.2%(+53.1)#88 |
| 4. | Benton | 56.4% | 8.2%(+48.3)#4 | 4.2%(+52.2)#94 |
| 5. | Sallis | 45.3% | 8.2%(+37.1)#5 | 4.2%(+41.0)#164 |
| 6. | Bobo | 42.2% | 8.2%(+34.0)#6 | 4.2%(+37.9)#193 |
| 7. | Clara | 41.0% | 8.2%(+32.9)#7 | 4.2%(+36.8)#202 |
| 8. | Alcorn State University | 40.9% | 8.2%(+32.8)#8 | 4.2%(+36.7)#204 |
| 9. | Shelby | 40.4% | 8.2%(+32.2)#9 | 4.2%(+36.2)#211 |
| 10. | Lyon | 37.9% | 8.2%(+29.7)#10 | 4.2%(+33.6)#240 |
| 11. | Independence | 37.2% | 8.2%(+29.1)#11 | 4.2%(+33.0)#248 |
| 12. | Paris | 37.0% | 8.2%(+28.8)#12 | 4.2%(+32.7)#251 |
| 13. | Mississippi State | 36.7% | 8.2%(+28.6)#13 | 4.2%(+32.5)#259 |
| 14. | Wheeler | 36.4% | 8.2%(+28.2)#14 | 4.2%(+32.2)#262 |
| 15. | Anguilla | 36.3% | 8.2%(+28.1)#15 | 4.2%(+32.0)#266 |
| 16. | Slate Springs | 35.0% | 8.2%(+26.8)#16 | 4.2%(+30.8)#292 |
| 17. | Silver Creek | 34.8% | 8.2%(+26.6)#17 | 4.2%(+30.5)#297 |
| 18. | Conehatta | 33.9% | 8.2%(+25.7)#18 | 4.2%(+29.7)#317 |
| 19. | Alligator | 33.3% | 8.2%(+25.2)#19 | 4.2%(+29.1)#335 |
| 20. | Pickens | 32.5% | 8.2%(+24.3)#20 | 4.2%(+28.2)#366 |
| 21. | Pope | 31.9% | 8.2%(+23.7)#21 | 4.2%(+27.7)#386 |
| 22. | Arcola | 31.6% | 8.2%(+23.4)#22 | 4.2%(+27.3)#395 |
| 23. | Winstonville | 31.2% | 8.2%(+23.1)#23 | 4.2%(+27.0)#401 |
| 24. | Shaw | 31.2% | 8.2%(+23.0)#24 | 4.2%(+26.9)#404 |
| 25. | Hillsboro | 30.7% | 8.2%(+22.6)#25 | 4.2%(+26.5)#420 |
| 26. | North Tunica | 29.7% | 8.2%(+21.5)#26 | 4.2%(+25.5)#445 |
| 27. | University | 29.7% | 8.2%(+21.5)#27 | 4.2%(+25.4)#446 |
| 28. | Cloverdale | 29.2% | 8.2%(+21.1)#28 | 4.2%(+25.0)#460 |
| 29. | Scooba | 28.5% | 8.2%(+20.3)#29 | 4.2%(+24.2)#500 |
| 30. | Gloster | 28.4% | 8.2%(+20.2)#30 | 4.2%(+24.2)#506 |
| 31. | Lambert | 27.4% | 8.2%(+19.2)#31 | 4.2%(+23.1)#554 |
| 32. | Elizabeth | 27.3% | 8.2%(+19.1)#32 | 4.2%(+23.0)#557 |
| 33. | Fayette | 26.6% | 8.2%(+18.4)#33 | 4.2%(+22.4)#586 |
| 34. | Beulah | 26.4% | 8.2%(+18.3)#34 | 4.2%(+22.2)#596 |
| 35. | Tutwiler | 26.0% | 8.2%(+17.8)#35 | 4.2%(+21.7)#615 |
| 36. | Starkville | 25.4% | 8.2%(+17.3)#36 | 4.2%(+21.2)#644 |
| 37. | Drew | 24.8% | 8.2%(+16.6)#37 | 4.2%(+20.6)#685 |
| 38. | Georgetown | 23.7% | 8.2%(+15.6)#38 | 4.2%(+19.5)#752 |
| 39. | Gluckstadt | 23.3% | 8.2%(+15.1)#39 | 4.2%(+19.0)#777 |
| 40. | Bolton | 23.1% | 8.2%(+14.9)#40 | 4.2%(+18.8)#791 |
| 41. | Utica | 22.9% | 8.2%(+14.7)#41 | 4.2%(+18.6)#797 |
| 42. | Prentiss | 22.7% | 8.2%(+14.5)#42 | 4.2%(+18.4)#812 |
| 43. | Hollandale | 22.6% | 8.2%(+14.5)#43 | 4.2%(+18.4)#816 |
| 44. | Hickory Flat | 22.6% | 8.2%(+14.4)#44 | 4.2%(+18.3)#821 |
| 45. | Coahoma | 22.6% | 8.2%(+14.4)#45 | 4.2%(+18.3)#824 |
| 46. | Sturgis | 22.4% | 8.2%(+14.2)#46 | 4.2%(+18.1)#841 |
| 47. | Louin | 22.2% | 8.2%(+14.1)#47 | 4.2%(+18.0)#853 |
| 48. | Learned | 22.2% | 8.2%(+14.1)#48 | 4.2%(+18.0)#863 |
| 49. | Leakesville | 22.1% | 8.2%(+13.9)#49 | 4.2%(+17.8)#872 |
| 50. | Charleston | 21.7% | 8.2%(+13.6)#50 | 4.2%(+17.5)#906 |
| 51. | Mount Olive | 21.2% | 8.2%(+13.1)#51 | 4.2%(+17.0)#949 |
| 52. | Stonewall | 21.1% | 8.2%(+13.0)#52 | 4.2%(+16.9)#957 |
| 53. | Chunky | 21.0% | 8.2%(+12.8)#53 | 4.2%(+16.8)#969 |
| 54. | Mooreville | 20.7% | 8.2%(+12.6)#54 | 4.2%(+16.5)#992 |
| 55. | Raymond | 20.7% | 8.2%(+12.5)#55 | 4.2%(+16.4)#1,003 |
| 56. | Oxford | 20.6% | 8.2%(+12.5)#56 | 4.2%(+16.4)#1,005 |
| 57. | Silver City | 20.5% | 8.2%(+12.4)#57 | 4.2%(+16.3)#1,018 |
| 58. | Rena Lara | 19.6% | 8.2%(+11.4)#58 | 4.2%(+15.3)#1,115 |
| 59. | Durant | 19.2% | 8.2%(+11.1)#59 | 4.2%(+15.0)#1,152 |
| 60. | North Carrollton | 19.1% | 8.2%(+10.9)#60 | 4.2%(+14.8)#1,173 |
| 61. | Flowood | 19.1% | 8.2%(+10.9)#61 | 4.2%(+14.8)#1,175 |
| 62. | Mantee | 18.7% | 8.2%(+10.5)#62 | 4.2%(+14.5)#1,221 |
| 63. | Webb | 18.7% | 8.2%(+10.5)#63 | 4.2%(+14.4)#1,225 |
| 64. | Thaxton | 18.7% | 8.2%(+10.5)#64 | 4.2%(+14.4)#1,226 |
| 65. | Belzoni | 18.5% | 8.2%(+10.3)#65 | 4.2%(+14.3)#1,245 |
| 66. | Eudora | 18.3% | 8.2%(+10.1)#66 | 4.2%(+14.0)#1,279 |
| 67. | Sunflower | 17.6% | 8.2%(+9.41)#67 | 4.2%(+13.3)#1,387 |
| 68. | Morgantown | 17.5% | 8.2%(+9.38)#68 | 4.2%(+13.3)#1,391 |
| 69. | Walnut Grove | 17.5% | 8.2%(+9.37)#69 | 4.2%(+13.3)#1,396 |
| 70. | Cleveland | 17.5% | 8.2%(+9.37)#70 | 4.2%(+13.3)#1,397 |
| 71. | Renova | 17.3% | 8.2%(+9.13)#71 | 4.2%(+13.0)#1,430 |
| 72. | Artesia | 17.2% | 8.2%(+9.02)#72 | 4.2%(+12.9)#1,443 |
| 73. | Fulton | 16.8% | 8.2%(+8.60)#73 | 4.2%(+12.5)#1,523 |
| 74. | Delisle | 16.7% | 8.2%(+8.50)#74 | 4.2%(+12.4)#1,539 |
| 75. | Elliott | 16.5% | 8.2%(+8.38)#75 | 4.2%(+12.3)#1,578 |
| 76. | Rolling Fork | 16.5% | 8.2%(+8.35)#76 | 4.2%(+12.3)#1,588 |
| 77. | Mathiston | 16.3% | 8.2%(+8.16)#77 | 4.2%(+12.1)#1,620 |
| 78. | Port Gibson | 16.2% | 8.2%(+8.02)#78 | 4.2%(+11.9)#1,646 |
| 79. | Marks | 16.0% | 8.2%(+7.81)#79 | 4.2%(+11.7)#1,685 |
| 80. | Collinsville | 15.8% | 8.2%(+7.59)#80 | 4.2%(+11.5)#1,732 |
| 81. | Friars Point | 15.7% | 8.2%(+7.52)#81 | 4.2%(+11.4)#1,747 |
| 82. | Clinton | 15.7% | 8.2%(+7.52)#82 | 4.2%(+11.4)#1,752 |
| 83. | Mound Bayou | 15.7% | 8.2%(+7.49)#83 | 4.2%(+11.4)#1,756 |
| 84. | Mississippi Valley State University | 15.6% | 8.2%(+7.45)#84 | 4.2%(+11.4)#1,769 |
| 85. | Metcalfe | 15.6% | 8.2%(+7.42)#85 | 4.2%(+11.3)#1,775 |
| 86. | Coffeeville | 15.3% | 8.2%(+7.10)#86 | 4.2%(+11.0)#1,857 |
| 87. | Oak Grove | 15.2% | 8.2%(+6.99)#87 | 4.2%(+10.9)#1,875 |
| 88. | Boyle | 15.1% | 8.2%(+6.97)#88 | 4.2%(+10.9)#1,881 |
| 89. | Lexington | 15.1% | 8.2%(+6.92)#89 | 4.2%(+10.8)#1,895 |
| 90. | Helena | 14.7% | 8.2%(+6.57)#90 | 4.2%(+10.5)#1,985 |
| 91. | Lena | 14.5% | 8.2%(+6.38)#91 | 4.2%(+10.3)#2,039 |
| 92. | Richland | 14.4% | 8.2%(+6.23)#92 | 4.2%(+10.2)#2,086 |
| 93. | Hazlehurst | 14.3% | 8.2%(+6.11)#93 | 4.2%(+10.0)#2,155 |
| 94. | Itta Bena | 14.3% | 8.2%(+6.09)#94 | 4.2%(+10.0)#2,158 |
| 95. | Rienzi | 14.1% | 8.2%(+5.97)#95 | 4.2%(+9.89)#2,193 |
| 96. | Tchula | 14.1% | 8.2%(+5.96)#96 | 4.2%(+9.88)#2,199 |
| 97. | Ruleville | 14.1% | 8.2%(+5.90)#97 | 4.2%(+9.82)#2,216 |
| 98. | Bovina | 14.0% | 8.2%(+5.85)#98 | 4.2%(+9.78)#2,229 |
| 99. | Kearney Park | 14.0% | 8.2%(+5.80)#99 | 4.2%(+9.72)#2,246 |
| 100. | Winona | 13.8% | 8.2%(+5.68)#100 | 4.2%(+9.60)#2,288 |
Common Questions
What are the Top 10 Cities with the Highest Percentage of State Government Employees in Mississippi?
Top 10 Cities with the Highest Percentage of State Government Employees in Mississippi are:
#1
57.4%
#2
45.3%
#3
41.0%
#4
40.9%
#5
40.4%
#6
37.9%
#7
36.7%
#8
36.3%
#9
35.0%
#10
34.8%
What city has the Highest Percentage of State Government Employees in Mississippi?
Duncan has the Highest Percentage of State Government Employees in Mississippi with 57.4%.
What is the Percentage of State Government Employees in the State of Mississippi?
Percentage of State Government Employees in Mississippi is 8.2%.
What is the Percentage of State Government Employees in the United States?
Percentage of State Government Employees in the United States is 4.2%.