Cities with the Highest Percentage of State Government Employees in Ohio
RELATED REPORTS & OPTIONS
State Government Employees
Ohio
Compare Cities
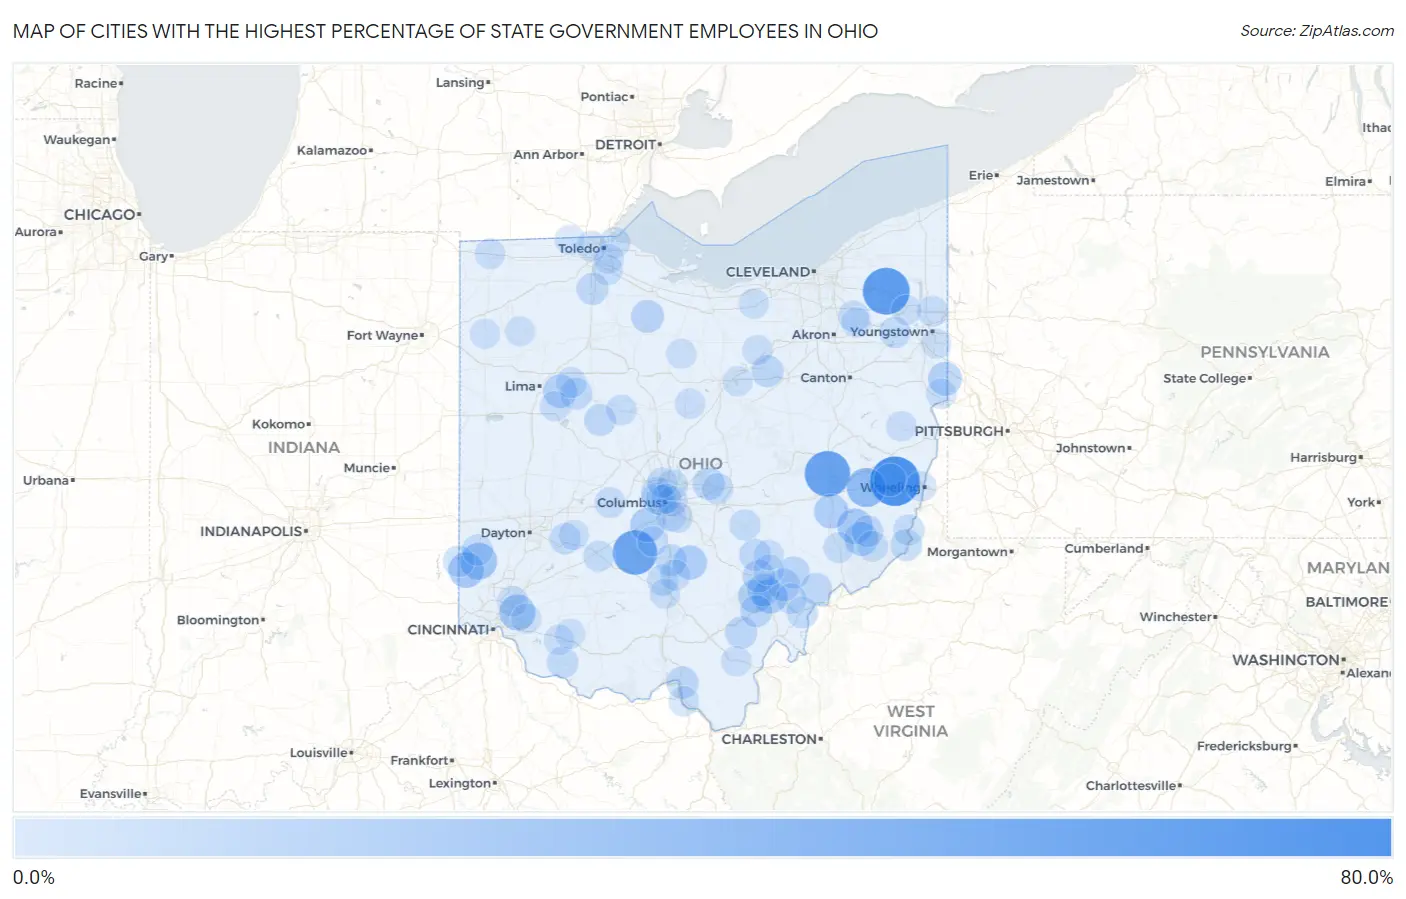
Map of Cities with the Highest Percentage of State Government Employees in Ohio
0.0%
80.0%
Cities with the Highest Percentage of State Government Employees in Ohio
| City | % State Government Employees | vs State | vs National | |
| 1. | Bannock | 66.0% | 3.1%(+62.9)#1 | 4.2%(+61.8)#60 |
| 2. | Parkman | 57.5% | 3.1%(+54.4)#2 | 4.2%(+53.3)#87 |
| 3. | Kimbolton | 53.5% | 3.1%(+50.4)#3 | 4.2%(+49.2)#109 |
| 4. | Pancoastburg | 50.0% | 3.1%(+46.9)#4 | 4.2%(+45.8)#128 |
| 5. | Fairview | 33.3% | 3.1%(+30.2)#5 | 4.2%(+29.1)#338 |
| 6. | Somerville | 26.4% | 3.1%(+23.3)#6 | 4.2%(+22.2)#595 |
| 7. | Miamiville | 24.1% | 3.1%(+21.0)#7 | 4.2%(+19.8)#733 |
| 8. | Oxford | 22.9% | 3.1%(+19.8)#8 | 4.2%(+18.7)#796 |
| 9. | Summerfield | 22.6% | 3.1%(+19.5)#9 | 4.2%(+18.3)#823 |
| 10. | Athens | 20.2% | 3.1%(+17.1)#10 | 4.2%(+15.9)#1,052 |
| 11. | Orient | 19.8% | 3.1%(+16.7)#11 | 4.2%(+15.5)#1,098 |
| 12. | Pleasant City | 18.9% | 3.1%(+15.8)#12 | 4.2%(+14.6)#1,198 |
| 13. | Tarlton | 18.8% | 3.1%(+15.7)#13 | 4.2%(+14.5)#1,212 |
| 14. | Stafford | 17.9% | 3.1%(+14.8)#14 | 4.2%(+13.6)#1,347 |
| 15. | Negley | 17.6% | 3.1%(+14.5)#15 | 4.2%(+13.4)#1,384 |
| 16. | Harrod | 17.0% | 3.1%(+13.9)#16 | 4.2%(+12.8)#1,474 |
| 17. | New Marshfield | 16.5% | 3.1%(+13.4)#17 | 4.2%(+12.2)#1,594 |
| 18. | The Plains | 15.0% | 3.1%(+11.9)#18 | 4.2%(+10.8)#1,911 |
| 19. | Fort Seneca | 15.0% | 3.1%(+11.9)#19 | 4.2%(+10.8)#1,916 |
| 20. | Miller | 14.2% | 3.1%(+11.1)#20 | 4.2%(+9.96)#2,173 |
| 21. | Lafferty | 14.1% | 3.1%(+11.0)#21 | 4.2%(+9.86)#2,203 |
| 22. | Amesville | 13.7% | 3.1%(+10.6)#22 | 4.2%(+9.48)#2,321 |
| 23. | Buchtel | 13.3% | 3.1%(+10.2)#23 | 4.2%(+9.06)#2,472 |
| 24. | Alexandria | 13.1% | 3.1%(+10.0)#24 | 4.2%(+8.86)#2,535 |
| 25. | Wheelersburg | 13.0% | 3.1%(+9.89)#25 | 4.2%(+8.74)#2,568 |
| 26. | Chesterhill | 12.8% | 3.1%(+9.74)#26 | 4.2%(+8.60)#2,619 |
| 27. | New Pittsburg | 12.5% | 3.1%(+9.40)#27 | 4.2%(+8.26)#2,747 |
| 28. | Wilkesville | 12.5% | 3.1%(+9.40)#28 | 4.2%(+8.26)#2,752 |
| 29. | Albany | 12.4% | 3.1%(+9.34)#29 | 4.2%(+8.19)#2,787 |
| 30. | Shawnee | 12.2% | 3.1%(+9.08)#30 | 4.2%(+7.94)#2,897 |
| 31. | Bowling Green | 12.1% | 3.1%(+9.00)#31 | 4.2%(+7.86)#2,934 |
| 32. | Mcguffey | 12.1% | 3.1%(+8.97)#32 | 4.2%(+7.83)#2,942 |
| 33. | Vincent | 12.1% | 3.1%(+8.97)#33 | 4.2%(+7.83)#2,945 |
| 34. | Lewisville | 11.6% | 3.1%(+8.53)#34 | 4.2%(+7.39)#3,159 |
| 35. | Marble Cliff | 11.5% | 3.1%(+8.44)#35 | 4.2%(+7.29)#3,209 |
| 36. | Ridgeway | 11.5% | 3.1%(+8.39)#36 | 4.2%(+7.24)#3,229 |
| 37. | Logan Elm Village | 11.5% | 3.1%(+8.38)#37 | 4.2%(+7.23)#3,232 |
| 38. | Hannibal | 11.5% | 3.1%(+8.38)#38 | 4.2%(+7.23)#3,234 |
| 39. | College Corner | 10.9% | 3.1%(+7.84)#39 | 4.2%(+6.70)#3,538 |
| 40. | Coolville | 10.9% | 3.1%(+7.82)#40 | 4.2%(+6.67)#3,549 |
| 41. | Wilberforce | 10.7% | 3.1%(+7.59)#41 | 4.2%(+6.45)#3,687 |
| 42. | Upper Arlington | 10.4% | 3.1%(+7.28)#42 | 4.2%(+6.14)#3,862 |
| 43. | Georgetown | 10.3% | 3.1%(+7.24)#43 | 4.2%(+6.09)#3,891 |
| 44. | Sugar Bush Knolls | 10.1% | 3.1%(+7.03)#44 | 4.2%(+5.88)#4,017 |
| 45. | Camden | 9.9% | 3.1%(+6.85)#45 | 4.2%(+5.70)#4,143 |
| 46. | Clarington | 9.9% | 3.1%(+6.82)#46 | 4.2%(+5.68)#4,158 |
| 47. | Somerset | 9.8% | 3.1%(+6.68)#47 | 4.2%(+5.53)#4,251 |
| 48. | Lake Milton | 9.7% | 3.1%(+6.65)#48 | 4.2%(+5.50)#4,274 |
| 49. | Andersonville | 9.7% | 3.1%(+6.58)#49 | 4.2%(+5.44)#4,316 |
| 50. | Milledgeville | 9.6% | 3.1%(+6.52)#50 | 4.2%(+5.37)#4,366 |
| 51. | Minerva Park | 9.6% | 3.1%(+6.50)#51 | 4.2%(+5.35)#4,380 |
| 52. | Granville South | 9.4% | 3.1%(+6.29)#52 | 4.2%(+5.14)#4,516 |
| 53. | Nankin | 9.4% | 3.1%(+6.26)#53 | 4.2%(+5.11)#4,558 |
| 54. | Kingston | 9.2% | 3.1%(+6.09)#54 | 4.2%(+4.94)#4,679 |
| 55. | Grandview Heights | 9.2% | 3.1%(+6.06)#55 | 4.2%(+4.91)#4,693 |
| 56. | Vienna Center | 9.1% | 3.1%(+5.99)#56 | 4.2%(+4.85)#4,730 |
| 57. | Dexter City | 8.9% | 3.1%(+5.83)#57 | 4.2%(+4.69)#4,869 |
| 58. | Highpoint | 8.8% | 3.1%(+5.71)#58 | 4.2%(+4.57)#4,964 |
| 59. | Graysville | 8.7% | 3.1%(+5.60)#59 | 4.2%(+4.45)#5,055 |
| 60. | Ada | 8.7% | 3.1%(+5.59)#60 | 4.2%(+4.45)#5,061 |
| 61. | Choctaw Lake | 8.7% | 3.1%(+5.57)#61 | 4.2%(+4.42)#5,080 |
| 62. | La Rue | 8.6% | 3.1%(+5.54)#62 | 4.2%(+4.40)#5,105 |
| 63. | Harbor View | 8.6% | 3.1%(+5.52)#63 | 4.2%(+4.38)#5,125 |
| 64. | Groveport | 8.6% | 3.1%(+5.49)#64 | 4.2%(+4.35)#5,142 |
| 65. | Stewart | 8.6% | 3.1%(+5.47)#65 | 4.2%(+4.33)#5,161 |
| 66. | Stony Ridge | 8.5% | 3.1%(+5.36)#66 | 4.2%(+4.22)#5,273 |
| 67. | Glouster | 8.3% | 3.1%(+5.19)#67 | 4.2%(+4.04)#5,443 |
| 68. | Bexley | 8.2% | 3.1%(+5.09)#68 | 4.2%(+3.95)#5,528 |
| 69. | Petersburg | 8.1% | 3.1%(+4.96)#69 | 4.2%(+3.81)#5,654 |
| 70. | Rio Grande | 8.0% | 3.1%(+4.90)#70 | 4.2%(+3.76)#5,699 |
| 71. | Calcutta | 8.0% | 3.1%(+4.86)#71 | 4.2%(+3.72)#5,743 |
| 72. | Worthington | 8.0% | 3.1%(+4.85)#72 | 4.2%(+3.71)#5,763 |
| 73. | Amsterdam | 7.8% | 3.1%(+4.70)#73 | 4.2%(+3.56)#5,927 |
| 74. | Bridgeport | 7.8% | 3.1%(+4.69)#74 | 4.2%(+3.54)#5,939 |
| 75. | Sharon Center | 7.8% | 3.1%(+4.67)#75 | 4.2%(+3.53)#5,959 |
| 76. | Candlewood Lake | 7.7% | 3.1%(+4.60)#76 | 4.2%(+3.45)#6,029 |
| 77. | Holiday City | 7.7% | 3.1%(+4.60)#77 | 4.2%(+3.45)#6,065 |
| 78. | Waynesfield | 7.6% | 3.1%(+4.49)#78 | 4.2%(+3.35)#6,147 |
| 79. | Corning | 7.6% | 3.1%(+4.49)#79 | 4.2%(+3.34)#6,152 |
| 80. | Cinnamon Lake | 7.6% | 3.1%(+4.46)#80 | 4.2%(+3.32)#6,188 |
| 81. | Oberlin | 7.5% | 3.1%(+4.41)#81 | 4.2%(+3.26)#6,258 |
| 82. | Mount Orab | 7.5% | 3.1%(+4.40)#82 | 4.2%(+3.26)#6,268 |
| 83. | Cedarville | 7.4% | 3.1%(+4.35)#83 | 4.2%(+3.20)#6,321 |
| 84. | Ottawa Hills | 7.4% | 3.1%(+4.34)#84 | 4.2%(+3.20)#6,323 |
| 85. | Franklin Furnace | 7.4% | 3.1%(+4.32)#85 | 4.2%(+3.17)#6,347 |
| 86. | Chillicothe | 7.4% | 3.1%(+4.26)#86 | 4.2%(+3.11)#6,413 |
| 87. | Mifflin | 7.3% | 3.1%(+4.22)#87 | 4.2%(+3.07)#6,460 |
| 88. | Obetz | 7.3% | 3.1%(+4.19)#88 | 4.2%(+3.05)#6,490 |
| 89. | Brady Lake | 7.3% | 3.1%(+4.16)#89 | 4.2%(+3.01)#6,531 |
| 90. | Leavittsburg | 7.2% | 3.1%(+4.14)#90 | 4.2%(+3.00)#6,549 |
| 91. | Walbridge | 7.2% | 3.1%(+4.12)#91 | 4.2%(+2.98)#6,575 |
| 92. | Darbyville | 7.2% | 3.1%(+4.11)#92 | 4.2%(+2.96)#6,590 |
| 93. | Day Heights | 7.1% | 3.1%(+4.05)#93 | 4.2%(+2.90)#6,639 |
| 94. | Continental | 7.1% | 3.1%(+4.05)#94 | 4.2%(+2.90)#6,642 |
| 95. | Columbus | 7.1% | 3.1%(+3.96)#95 | 4.2%(+2.82)#6,757 |
| 96. | Latty | 7.0% | 3.1%(+3.95)#96 | 4.2%(+2.80)#6,774 |
| 97. | Buford | 7.0% | 3.1%(+3.94)#97 | 4.2%(+2.79)#6,781 |
| 98. | Poland | 7.0% | 3.1%(+3.93)#98 | 4.2%(+2.79)#6,790 |
| 99. | New Washington | 6.9% | 3.1%(+3.84)#99 | 4.2%(+2.69)#6,891 |
| 100. | Berkey | 6.8% | 3.1%(+3.75)#100 | 4.2%(+2.61)#6,999 |
Common Questions
What are the Top 10 Cities with the Highest Percentage of State Government Employees in Ohio?
Top 10 Cities with the Highest Percentage of State Government Employees in Ohio are:
#1
66.0%
#2
57.5%
#3
53.5%
#4
50.0%
#5
33.3%
#6
26.4%
#7
24.1%
#8
22.9%
#9
22.6%
#10
20.2%
What city has the Highest Percentage of State Government Employees in Ohio?
Bannock has the Highest Percentage of State Government Employees in Ohio with 66.0%.
What is the Percentage of State Government Employees in the State of Ohio?
Percentage of State Government Employees in Ohio is 3.1%.
What is the Percentage of State Government Employees in the United States?
Percentage of State Government Employees in the United States is 4.2%.