Cities with the Highest Percentage of State Government Employees in Iowa
RELATED REPORTS & OPTIONS
State Government Employees
Iowa
Compare Cities
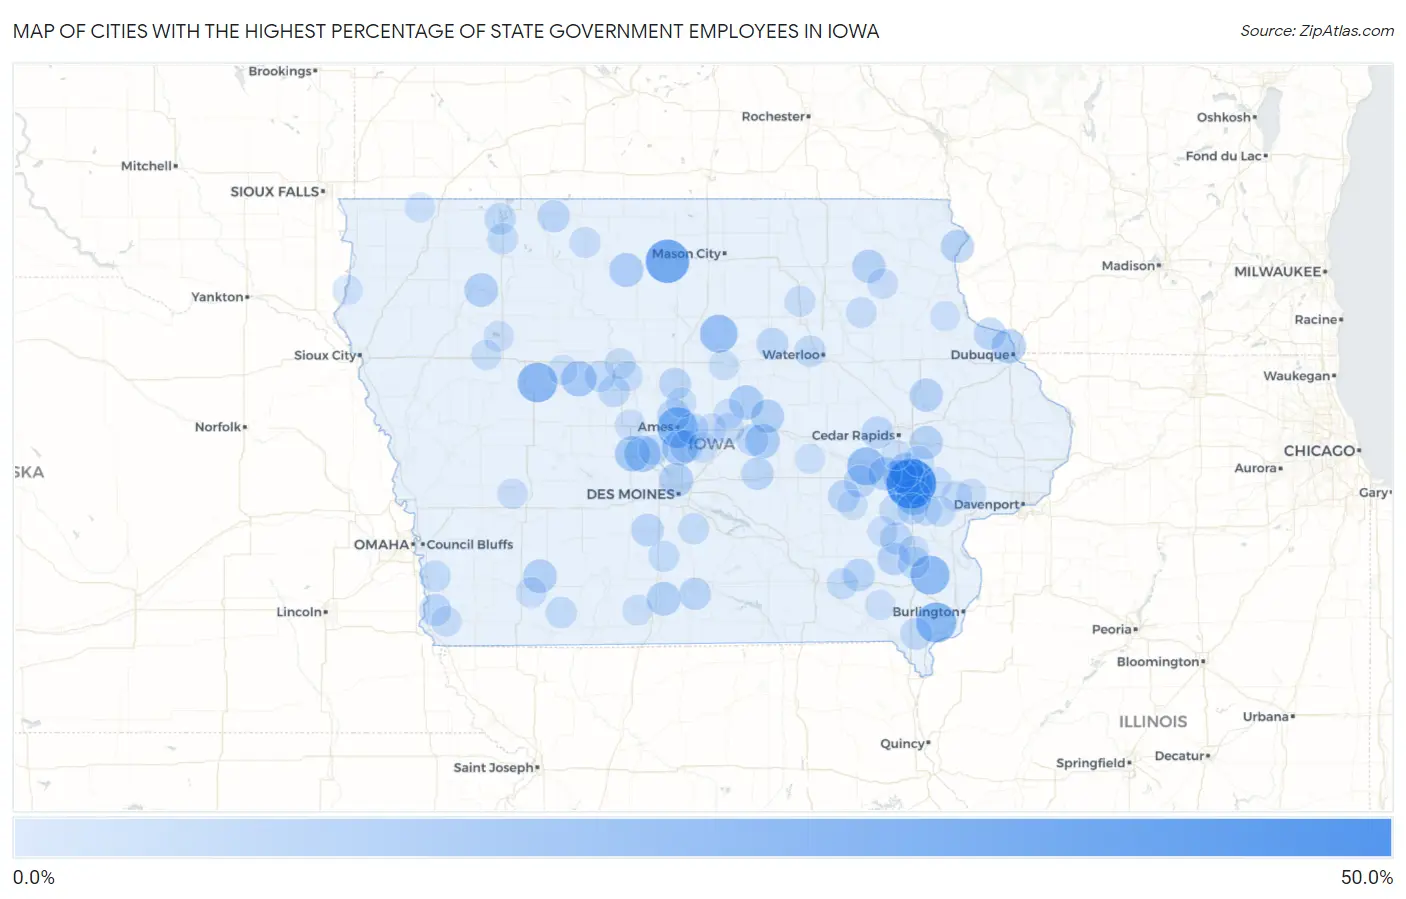
Map of Cities with the Highest Percentage of State Government Employees in Iowa
0.0%
50.0%
Cities with the Highest Percentage of State Government Employees in Iowa
| City | % State Government Employees | vs State | vs National | |
| 1. | University Heights | 43.7% | 5.0%(+38.6)#1 | 4.2%(+39.4)#178 |
| 2. | Duncan | 32.1% | 5.0%(+27.1)#2 | 4.2%(+27.9)#378 |
| 3. | Ames | 26.4% | 5.0%(+21.3)#3 | 4.2%(+22.1)#599 |
| 4. | Denmark | 26.0% | 5.0%(+20.9)#4 | 4.2%(+21.7)#616 |
| 5. | Yetter | 25.0% | 5.0%(+20.0)#5 | 4.2%(+20.8)#676 |
| 6. | Mount Union | 24.0% | 5.0%(+19.0)#6 | 4.2%(+19.8)#739 |
| 7. | Iowa City | 23.2% | 5.0%(+18.2)#7 | 4.2%(+19.0)#779 |
| 8. | Wever | 22.2% | 5.0%(+17.2)#8 | 4.2%(+18.0)#858 |
| 9. | South Amana | 22.1% | 5.0%(+17.0)#9 | 4.2%(+17.8)#874 |
| 10. | Bradford | 21.4% | 5.0%(+16.4)#10 | 4.2%(+17.2)#937 |
| 11. | Woodward | 18.9% | 5.0%(+13.8)#11 | 4.2%(+14.6)#1,197 |
| 12. | Huxley | 18.0% | 5.0%(+13.0)#12 | 4.2%(+13.8)#1,327 |
| 13. | Coralville | 17.9% | 5.0%(+12.8)#13 | 4.2%(+13.6)#1,343 |
| 14. | Rinard | 17.4% | 5.0%(+12.4)#14 | 4.2%(+13.1)#1,415 |
| 15. | Bouton | 17.1% | 5.0%(+12.1)#15 | 4.2%(+12.9)#1,454 |
| 16. | Hills | 16.7% | 5.0%(+11.7)#16 | 4.2%(+12.5)#1,534 |
| 17. | North Liberty | 15.8% | 5.0%(+10.8)#17 | 4.2%(+11.5)#1,718 |
| 18. | Ferguson | 15.8% | 5.0%(+10.8)#18 | 4.2%(+11.5)#1,723 |
| 19. | Liscomb | 15.5% | 5.0%(+10.4)#19 | 4.2%(+11.2)#1,809 |
| 20. | Sageville | 15.4% | 5.0%(+10.4)#20 | 4.2%(+11.1)#1,837 |
| 21. | St Benedict | 14.8% | 5.0%(+9.78)#21 | 4.2%(+10.6)#1,965 |
| 22. | Saylorville | 14.7% | 5.0%(+9.65)#22 | 4.2%(+10.4)#1,997 |
| 23. | Weldon | 14.3% | 5.0%(+9.25)#23 | 4.2%(+10.0)#2,139 |
| 24. | Carbon | 14.3% | 5.0%(+9.25)#24 | 4.2%(+10.0)#2,144 |
| 25. | Tiffin | 14.0% | 5.0%(+9.00)#25 | 4.2%(+9.79)#2,226 |
| 26. | Peterson | 14.0% | 5.0%(+8.96)#26 | 4.2%(+9.75)#2,240 |
| 27. | Green Mountain | 13.7% | 5.0%(+8.65)#27 | 4.2%(+9.44)#2,335 |
| 28. | Mount Vernon | 13.6% | 5.0%(+8.53)#28 | 4.2%(+9.32)#2,365 |
| 29. | Prairieburg | 13.4% | 5.0%(+8.38)#29 | 4.2%(+9.17)#2,417 |
| 30. | Oxford | 13.4% | 5.0%(+8.34)#30 | 4.2%(+9.13)#2,431 |
| 31. | St Lucas | 13.3% | 5.0%(+8.30)#31 | 4.2%(+9.09)#2,452 |
| 32. | Harpers Ferry | 13.3% | 5.0%(+8.23)#32 | 4.2%(+9.02)#2,482 |
| 33. | Coppock | 12.5% | 5.0%(+7.47)#33 | 4.2%(+8.26)#2,772 |
| 34. | Gilbert | 12.3% | 5.0%(+7.28)#34 | 4.2%(+8.07)#2,841 |
| 35. | Cambridge | 12.3% | 5.0%(+7.28)#35 | 4.2%(+8.07)#2,843 |
| 36. | Patterson | 12.1% | 5.0%(+7.06)#36 | 4.2%(+7.85)#2,938 |
| 37. | Williamsburg | 12.0% | 5.0%(+6.97)#37 | 4.2%(+7.76)#2,971 |
| 38. | Maharishi Vedic City | 11.9% | 5.0%(+6.85)#38 | 4.2%(+7.64)#3,029 |
| 39. | Kellogg | 11.7% | 5.0%(+6.71)#39 | 4.2%(+7.50)#3,107 |
| 40. | Thurman | 11.5% | 5.0%(+6.51)#40 | 4.2%(+7.30)#3,200 |
| 41. | Balltown | 11.5% | 5.0%(+6.51)#41 | 4.2%(+7.30)#3,206 |
| 42. | Gruver | 11.5% | 5.0%(+6.51)#42 | 4.2%(+7.30)#3,207 |
| 43. | Washington | 11.4% | 5.0%(+6.35)#43 | 4.2%(+7.14)#3,275 |
| 44. | Atkins | 11.4% | 5.0%(+6.33)#44 | 4.2%(+7.12)#3,282 |
| 45. | Derby | 11.4% | 5.0%(+6.33)#45 | 4.2%(+7.12)#3,291 |
| 46. | Millersburg | 11.3% | 5.0%(+6.26)#46 | 4.2%(+7.05)#3,330 |
| 47. | Jewell Junction | 11.2% | 5.0%(+6.16)#47 | 4.2%(+6.95)#3,380 |
| 48. | Olds | 11.1% | 5.0%(+6.08)#48 | 4.2%(+6.87)#3,443 |
| 49. | Franklin | 11.1% | 5.0%(+6.08)#49 | 4.2%(+6.87)#3,446 |
| 50. | Parkersburg | 11.0% | 5.0%(+5.92)#50 | 4.2%(+6.71)#3,529 |
| 51. | Haverhill | 10.9% | 5.0%(+5.84)#51 | 4.2%(+6.63)#3,583 |
| 52. | Harcourt | 10.7% | 5.0%(+5.68)#52 | 4.2%(+6.47)#3,668 |
| 53. | Nevada | 10.5% | 5.0%(+5.49)#53 | 4.2%(+6.28)#3,784 |
| 54. | Wahpeton | 10.3% | 5.0%(+5.31)#54 | 4.2%(+6.10)#3,884 |
| 55. | Cedar Falls | 10.3% | 5.0%(+5.28)#55 | 4.2%(+6.07)#3,912 |
| 56. | Kalona | 10.2% | 5.0%(+5.19)#56 | 4.2%(+5.98)#3,958 |
| 57. | Sharpsburg | 10.0% | 5.0%(+4.97)#57 | 4.2%(+5.76)#4,101 |
| 58. | Glenwood | 9.9% | 5.0%(+4.90)#58 | 4.2%(+5.69)#4,148 |
| 59. | Lone Tree | 9.9% | 5.0%(+4.89)#59 | 4.2%(+5.68)#4,155 |
| 60. | Callender | 9.8% | 5.0%(+4.79)#60 | 4.2%(+5.58)#4,209 |
| 61. | Riverside | 9.7% | 5.0%(+4.67)#61 | 4.2%(+5.46)#4,295 |
| 62. | West Branch | 9.7% | 5.0%(+4.67)#62 | 4.2%(+5.46)#4,298 |
| 63. | Ackworth | 9.6% | 5.0%(+4.58)#63 | 4.2%(+5.37)#4,365 |
| 64. | New Virginia | 9.6% | 5.0%(+4.57)#64 | 4.2%(+5.36)#4,371 |
| 65. | Fostoria | 9.6% | 5.0%(+4.53)#65 | 4.2%(+5.32)#4,408 |
| 66. | Batavia | 9.4% | 5.0%(+4.40)#66 | 4.2%(+5.19)#4,491 |
| 67. | State Center | 9.3% | 5.0%(+4.31)#67 | 4.2%(+5.10)#4,569 |
| 68. | Fenton | 9.3% | 5.0%(+4.29)#68 | 4.2%(+5.08)#4,578 |
| 69. | Westgate | 9.2% | 5.0%(+4.20)#69 | 4.2%(+4.99)#4,644 |
| 70. | Coalville | 9.2% | 5.0%(+4.19)#70 | 4.2%(+4.98)#4,649 |
| 71. | Atalissa | 9.1% | 5.0%(+4.10)#71 | 4.2%(+4.89)#4,708 |
| 72. | Nodaway | 9.1% | 5.0%(+4.06)#72 | 4.2%(+4.85)#4,754 |
| 73. | Solon | 9.1% | 5.0%(+4.02)#73 | 4.2%(+4.81)#4,776 |
| 74. | Maxwell | 9.0% | 5.0%(+4.01)#74 | 4.2%(+4.80)#4,780 |
| 75. | Plainfield | 9.0% | 5.0%(+3.97)#75 | 4.2%(+4.76)#4,809 |
| 76. | Nichols | 9.0% | 5.0%(+3.96)#76 | 4.2%(+4.75)#4,812 |
| 77. | Crawfordsville | 8.8% | 5.0%(+3.79)#77 | 4.2%(+4.58)#4,955 |
| 78. | Sidney | 8.7% | 5.0%(+3.67)#78 | 4.2%(+4.46)#5,043 |
| 79. | Grand River | 8.7% | 5.0%(+3.66)#79 | 4.2%(+4.45)#5,050 |
| 80. | Elk Horn | 8.6% | 5.0%(+3.55)#80 | 4.2%(+4.34)#5,148 |
| 81. | West Union | 8.5% | 5.0%(+3.47)#81 | 4.2%(+4.26)#5,223 |
| 82. | Lakeside | 8.5% | 5.0%(+3.47)#82 | 4.2%(+4.26)#5,225 |
| 83. | Ogden | 8.4% | 5.0%(+3.37)#83 | 4.2%(+4.16)#5,315 |
| 84. | Wilton | 8.4% | 5.0%(+3.32)#84 | 4.2%(+4.11)#5,368 |
| 85. | Colo | 8.3% | 5.0%(+3.30)#85 | 4.2%(+4.09)#5,387 |
| 86. | West Chester | 8.3% | 5.0%(+3.30)#86 | 4.2%(+4.09)#5,401 |
| 87. | Owasa | 8.3% | 5.0%(+3.30)#87 | 4.2%(+4.09)#5,411 |
| 88. | Madrid | 8.3% | 5.0%(+3.27)#88 | 4.2%(+4.06)#5,428 |
| 89. | Lehigh | 8.3% | 5.0%(+3.26)#89 | 4.2%(+4.05)#5,437 |
| 90. | Clemons | 8.2% | 5.0%(+3.19)#90 | 4.2%(+3.98)#5,499 |
| 91. | Schaller | 8.2% | 5.0%(+3.18)#91 | 4.2%(+3.97)#5,503 |
| 92. | Chatsworth | 8.1% | 5.0%(+3.08)#92 | 4.2%(+3.87)#5,616 |
| 93. | Stockport | 8.0% | 5.0%(+3.01)#93 | 4.2%(+3.80)#5,662 |
| 94. | Story City | 8.0% | 5.0%(+2.99)#94 | 4.2%(+3.78)#5,687 |
| 95. | Little Rock | 8.0% | 5.0%(+2.97)#95 | 4.2%(+3.76)#5,700 |
| 96. | Garber | 8.0% | 5.0%(+2.97)#96 | 4.2%(+3.76)#5,705 |
| 97. | Rockwell City | 8.0% | 5.0%(+2.92)#97 | 4.2%(+3.71)#5,753 |
| 98. | Holiday Lake | 7.9% | 5.0%(+2.90)#98 | 4.2%(+3.69)#5,781 |
| 99. | Swisher | 7.9% | 5.0%(+2.89)#99 | 4.2%(+3.68)#5,800 |
| 100. | North English | 7.9% | 5.0%(+2.88)#100 | 4.2%(+3.67)#5,814 |
Common Questions
What are the Top 10 Cities with the Highest Percentage of State Government Employees in Iowa?
Top 10 Cities with the Highest Percentage of State Government Employees in Iowa are:
#1
43.7%
#2
32.1%
#3
26.4%
#4
26.0%
#5
25.0%
#6
24.0%
#7
23.2%
#8
22.1%
#9
21.4%
#10
18.9%
What city has the Highest Percentage of State Government Employees in Iowa?
University Heights has the Highest Percentage of State Government Employees in Iowa with 43.7%.
What is the Percentage of State Government Employees in the State of Iowa?
Percentage of State Government Employees in Iowa is 5.0%.
What is the Percentage of State Government Employees in the United States?
Percentage of State Government Employees in the United States is 4.2%.