Cities with the Highest Percentage of State Government Employees in Montana
RELATED REPORTS & OPTIONS
State Government Employees
Montana
Compare Cities
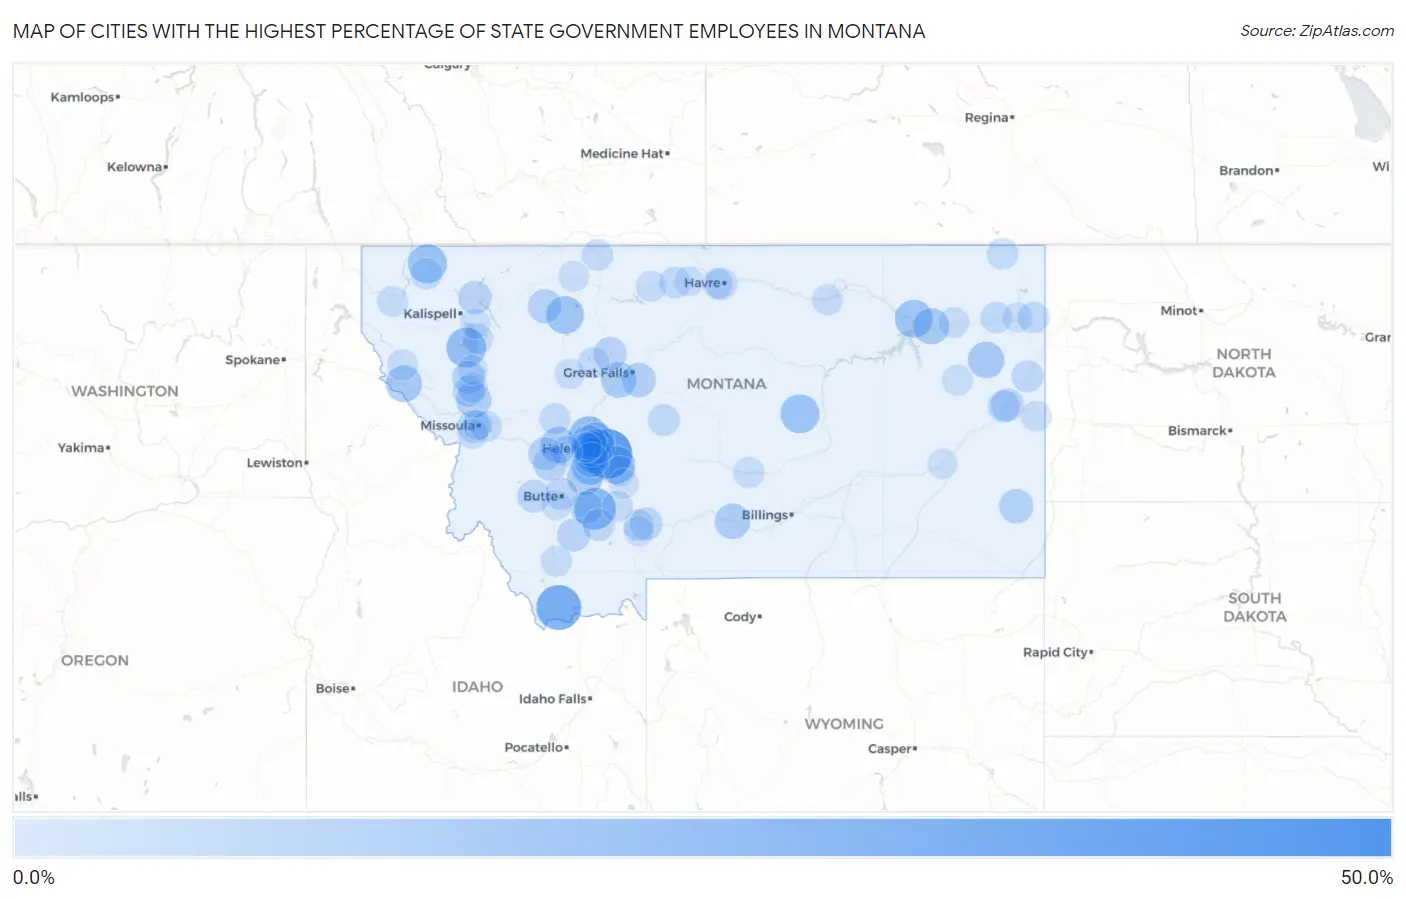
Map of Cities with the Highest Percentage of State Government Employees in Montana
0.0%
50.0%
Cities with the Highest Percentage of State Government Employees in Montana
| City | % State Government Employees | vs State | vs National | |
| 1. | Dewey | 50.0% | 5.4%(+44.6)#1 | 4.2%(+45.8)#134 |
| 2. | Danvers | 50.0% | 5.4%(+44.6)#2 | 4.2%(+45.8)#135 |
| 3. | Spokane Creek | 42.4% | 5.4%(+37.0)#3 | 4.2%(+38.2)#191 |
| 4. | Glen | 35.3% | 5.4%(+29.9)#4 | 4.2%(+31.1)#286 |
| 5. | Lima | 33.8% | 5.4%(+28.4)#5 | 4.2%(+29.5)#321 |
| 6. | Cardwell | 27.8% | 5.4%(+22.4)#6 | 4.2%(+23.5)#537 |
| 7. | Unionville | 26.4% | 5.4%(+21.0)#7 | 4.2%(+22.1)#598 |
| 8. | Montaqua | 24.6% | 5.4%(+19.2)#8 | 4.2%(+20.3)#703 |
| 9. | Lindisfarne | 24.3% | 5.4%(+18.9)#9 | 4.2%(+20.1)#720 |
| 10. | Helena Valley Northwest | 23.9% | 5.4%(+18.5)#10 | 4.2%(+19.7)#744 |
| 11. | York | 23.8% | 5.4%(+18.4)#11 | 4.2%(+19.6)#749 |
| 12. | Fortine | 22.7% | 5.4%(+17.3)#12 | 4.2%(+18.5)#807 |
| 13. | Winnett | 22.4% | 5.4%(+17.1)#13 | 4.2%(+18.2)#836 |
| 14. | South Hills | 21.3% | 5.4%(+15.9)#14 | 4.2%(+17.1)#945 |
| 15. | Nashua | 20.8% | 5.4%(+15.4)#15 | 4.2%(+16.5)#991 |
| 16. | The Silos | 20.7% | 5.4%(+15.3)#16 | 4.2%(+16.4)#1,001 |
| 17. | Dupuyer | 20.5% | 5.4%(+15.1)#17 | 4.2%(+16.3)#1,021 |
| 18. | Hogeland | 20.0% | 5.4%(+14.6)#18 | 4.2%(+15.8)#1,086 |
| 19. | Jefferson City | 19.4% | 5.4%(+14.0)#19 | 4.2%(+15.2)#1,133 |
| 20. | Norris | 19.0% | 5.4%(+13.6)#20 | 4.2%(+14.8)#1,183 |
| 21. | De Borgia | 18.2% | 5.4%(+12.8)#21 | 4.2%(+13.9)#1,298 |
| 22. | Avon | 18.0% | 5.4%(+12.6)#22 | 4.2%(+13.8)#1,325 |
| 23. | Richey | 17.9% | 5.4%(+12.5)#23 | 4.2%(+13.7)#1,339 |
| 24. | Hardy | 17.6% | 5.4%(+12.2)#24 | 4.2%(+13.4)#1,375 |
| 25. | Frazer | 17.6% | 5.4%(+12.2)#25 | 4.2%(+13.3)#1,386 |
| 26. | Montana City | 17.1% | 5.4%(+11.7)#26 | 4.2%(+12.9)#1,464 |
| 27. | Boulder | 16.8% | 5.4%(+11.4)#27 | 4.2%(+12.6)#1,510 |
| 28. | Hall | 16.7% | 5.4%(+11.3)#28 | 4.2%(+12.4)#1,563 |
| 29. | Potomac | 16.7% | 5.4%(+11.3)#29 | 4.2%(+12.4)#1,566 |
| 30. | Helena | 16.5% | 5.4%(+11.1)#30 | 4.2%(+12.3)#1,581 |
| 31. | Helena Valley Northeast | 16.4% | 5.4%(+11.0)#31 | 4.2%(+12.2)#1,606 |
| 32. | Ulm | 16.4% | 5.4%(+11.0)#32 | 4.2%(+12.1)#1,609 |
| 33. | Reed Point | 16.3% | 5.4%(+10.9)#33 | 4.2%(+12.0)#1,631 |
| 34. | Arlee | 16.0% | 5.4%(+10.6)#34 | 4.2%(+11.8)#1,675 |
| 35. | Helena Valley Southeast | 15.5% | 5.4%(+10.1)#35 | 4.2%(+11.3)#1,793 |
| 36. | Rimini | 15.1% | 5.4%(+9.70)#36 | 4.2%(+10.9)#1,892 |
| 37. | Helena Valley West Central | 14.8% | 5.4%(+9.44)#37 | 4.2%(+10.6)#1,953 |
| 38. | Clancy | 14.8% | 5.4%(+9.39)#38 | 4.2%(+10.6)#1,968 |
| 39. | Ekalaka | 14.4% | 5.4%(+8.99)#39 | 4.2%(+10.1)#2,090 |
| 40. | Sand Coulee | 14.3% | 5.4%(+8.89)#40 | 4.2%(+10.0)#2,124 |
| 41. | Raynesford | 13.8% | 5.4%(+8.39)#41 | 4.2%(+9.55)#2,301 |
| 42. | Heart Butte | 13.7% | 5.4%(+8.30)#42 | 4.2%(+9.46)#2,328 |
| 43. | Deer Lodge | 13.4% | 5.4%(+7.97)#43 | 4.2%(+9.12)#2,432 |
| 44. | Hungry Horse | 12.6% | 5.4%(+7.22)#44 | 4.2%(+8.37)#2,707 |
| 45. | Power | 12.5% | 5.4%(+7.10)#45 | 4.2%(+8.26)#2,755 |
| 46. | Garrison | 12.5% | 5.4%(+7.10)#46 | 4.2%(+8.26)#2,762 |
| 47. | Charlo | 12.3% | 5.4%(+6.86)#47 | 4.2%(+8.02)#2,868 |
| 48. | Twin Bridges | 11.9% | 5.4%(+6.54)#48 | 4.2%(+7.70)#3,001 |
| 49. | Glendive | 11.9% | 5.4%(+6.48)#49 | 4.2%(+7.63)#3,031 |
| 50. | Anaconda Deer Lodge County | 11.8% | 5.4%(+6.37)#50 | 4.2%(+7.52)#3,077 |
| 51. | Orchard Homes | 11.4% | 5.4%(+6.00)#51 | 4.2%(+7.16)#3,261 |
| 52. | Bozeman | 11.2% | 5.4%(+5.83)#52 | 4.2%(+6.99)#3,364 |
| 53. | Whitehall | 10.9% | 5.4%(+5.50)#53 | 4.2%(+6.65)#3,563 |
| 54. | Walkerville | 10.6% | 5.4%(+5.23)#54 | 4.2%(+6.39)#3,722 |
| 55. | West Glendive | 10.5% | 5.4%(+5.06)#55 | 4.2%(+6.21)#3,815 |
| 56. | West Havre | 10.4% | 5.4%(+5.05)#56 | 4.2%(+6.21)#3,819 |
| 57. | Pony | 10.3% | 5.4%(+4.90)#57 | 4.2%(+6.05)#3,918 |
| 58. | Savage | 10.2% | 5.4%(+4.75)#58 | 4.2%(+5.91)#4,006 |
| 59. | Neihart | 10.0% | 5.4%(+4.60)#59 | 4.2%(+5.76)#4,106 |
| 60. | Ravalli | 9.9% | 5.4%(+4.48)#60 | 4.2%(+5.63)#4,173 |
| 61. | Rudyard | 9.7% | 5.4%(+4.26)#61 | 4.2%(+5.42)#4,337 |
| 62. | Brockton | 9.4% | 5.4%(+3.98)#62 | 4.2%(+5.13)#4,529 |
| 63. | Bainville | 9.3% | 5.4%(+3.95)#63 | 4.2%(+5.10)#4,567 |
| 64. | Sunburst | 9.1% | 5.4%(+3.69)#64 | 4.2%(+4.85)#4,733 |
| 65. | Trego | 9.1% | 5.4%(+3.67)#65 | 4.2%(+4.82)#4,771 |
| 66. | Lincoln | 8.9% | 5.4%(+3.46)#66 | 4.2%(+4.61)#4,928 |
| 67. | Piltzville | 8.7% | 5.4%(+3.32)#67 | 4.2%(+4.47)#5,031 |
| 68. | Outlook | 8.7% | 5.4%(+3.30)#68 | 4.2%(+4.45)#5,056 |
| 69. | Fairfield | 8.4% | 5.4%(+3.04)#69 | 4.2%(+4.19)#5,293 |
| 70. | Chester | 8.3% | 5.4%(+2.90)#70 | 4.2%(+4.06)#5,430 |
| 71. | White Haven | 8.3% | 5.4%(+2.88)#71 | 4.2%(+4.03)#5,454 |
| 72. | Four Corners | 8.3% | 5.4%(+2.86)#72 | 4.2%(+4.02)#5,463 |
| 73. | Ryegate | 8.2% | 5.4%(+2.85)#73 | 4.2%(+4.01)#5,475 |
| 74. | Thompson Falls | 8.2% | 5.4%(+2.83)#74 | 4.2%(+3.98)#5,490 |
| 75. | Dillon | 8.2% | 5.4%(+2.75)#75 | 4.2%(+3.91)#5,566 |
| 76. | Circle | 8.1% | 5.4%(+2.74)#76 | 4.2%(+3.90)#5,574 |
| 77. | Elliston | 8.1% | 5.4%(+2.73)#77 | 4.2%(+3.89)#5,587 |
| 78. | Wolf Point | 8.1% | 5.4%(+2.72)#78 | 4.2%(+3.87)#5,601 |
| 79. | Bear Dance | 8.1% | 5.4%(+2.67)#79 | 4.2%(+3.82)#5,644 |
| 80. | Malta | 8.0% | 5.4%(+2.63)#80 | 4.2%(+3.78)#5,683 |
| 81. | Three Forks | 8.0% | 5.4%(+2.57)#81 | 4.2%(+3.73)#5,727 |
| 82. | Wibaux | 7.8% | 5.4%(+2.44)#82 | 4.2%(+3.59)#5,896 |
| 83. | Beaver Creek | 7.7% | 5.4%(+2.29)#83 | 4.2%(+3.45)#6,036 |
| 84. | Cyr | 7.7% | 5.4%(+2.29)#84 | 4.2%(+3.45)#6,051 |
| 85. | Lolo | 7.6% | 5.4%(+2.25)#85 | 4.2%(+3.40)#6,100 |
| 86. | Cut Bank | 7.5% | 5.4%(+2.14)#86 | 4.2%(+3.30)#6,210 |
| 87. | Augusta | 7.4% | 5.4%(+2.01)#87 | 4.2%(+3.17)#6,359 |
| 88. | St Ignatius | 7.1% | 5.4%(+1.72)#88 | 4.2%(+2.88)#6,682 |
| 89. | Townsend | 7.0% | 5.4%(+1.64)#89 | 4.2%(+2.80)#6,779 |
| 90. | Culbertson | 7.0% | 5.4%(+1.62)#90 | 4.2%(+2.78)#6,802 |
| 91. | Gallatin Gateway | 6.9% | 5.4%(+1.53)#91 | 4.2%(+2.69)#6,896 |
| 92. | Bigfork | 6.9% | 5.4%(+1.53)#92 | 4.2%(+2.69)#6,900 |
| 93. | Gildford | 6.9% | 5.4%(+1.50)#93 | 4.2%(+2.65)#6,946 |
| 94. | Miles City | 6.8% | 5.4%(+1.39)#94 | 4.2%(+2.55)#7,074 |
| 95. | Missoula | 6.7% | 5.4%(+1.34)#95 | 4.2%(+2.50)#7,139 |
| 96. | Toston | 6.7% | 5.4%(+1.27)#96 | 4.2%(+2.42)#7,243 |
| 97. | Lakeview | 6.7% | 5.4%(+1.27)#97 | 4.2%(+2.42)#7,253 |
| 98. | Helena West Side | 6.7% | 5.4%(+1.25)#98 | 4.2%(+2.41)#7,266 |
| 99. | Butte Silver Bow Balance | 6.5% | 5.4%(+1.13)#99 | 4.2%(+2.28)#7,431 |
| 100. | Ronan | 6.5% | 5.4%(+1.10)#100 | 4.2%(+2.25)#7,482 |
Common Questions
What are the Top 10 Cities with the Highest Percentage of State Government Employees in Montana?
Top 10 Cities with the Highest Percentage of State Government Employees in Montana are:
#1
42.4%
#2
33.8%
#3
27.8%
#4
24.3%
#5
23.9%
#6
22.7%
#7
22.4%
#8
21.3%
#9
20.8%
#10
20.7%
What city has the Highest Percentage of State Government Employees in Montana?
Spokane Creek has the Highest Percentage of State Government Employees in Montana with 42.4%.
What is the Percentage of State Government Employees in the State of Montana?
Percentage of State Government Employees in Montana is 5.4%.
What is the Percentage of State Government Employees in the United States?
Percentage of State Government Employees in the United States is 4.2%.