Cities with the Highest Percentage of State Government Employees in Louisiana
RELATED REPORTS & OPTIONS
State Government Employees
Louisiana
Compare Cities
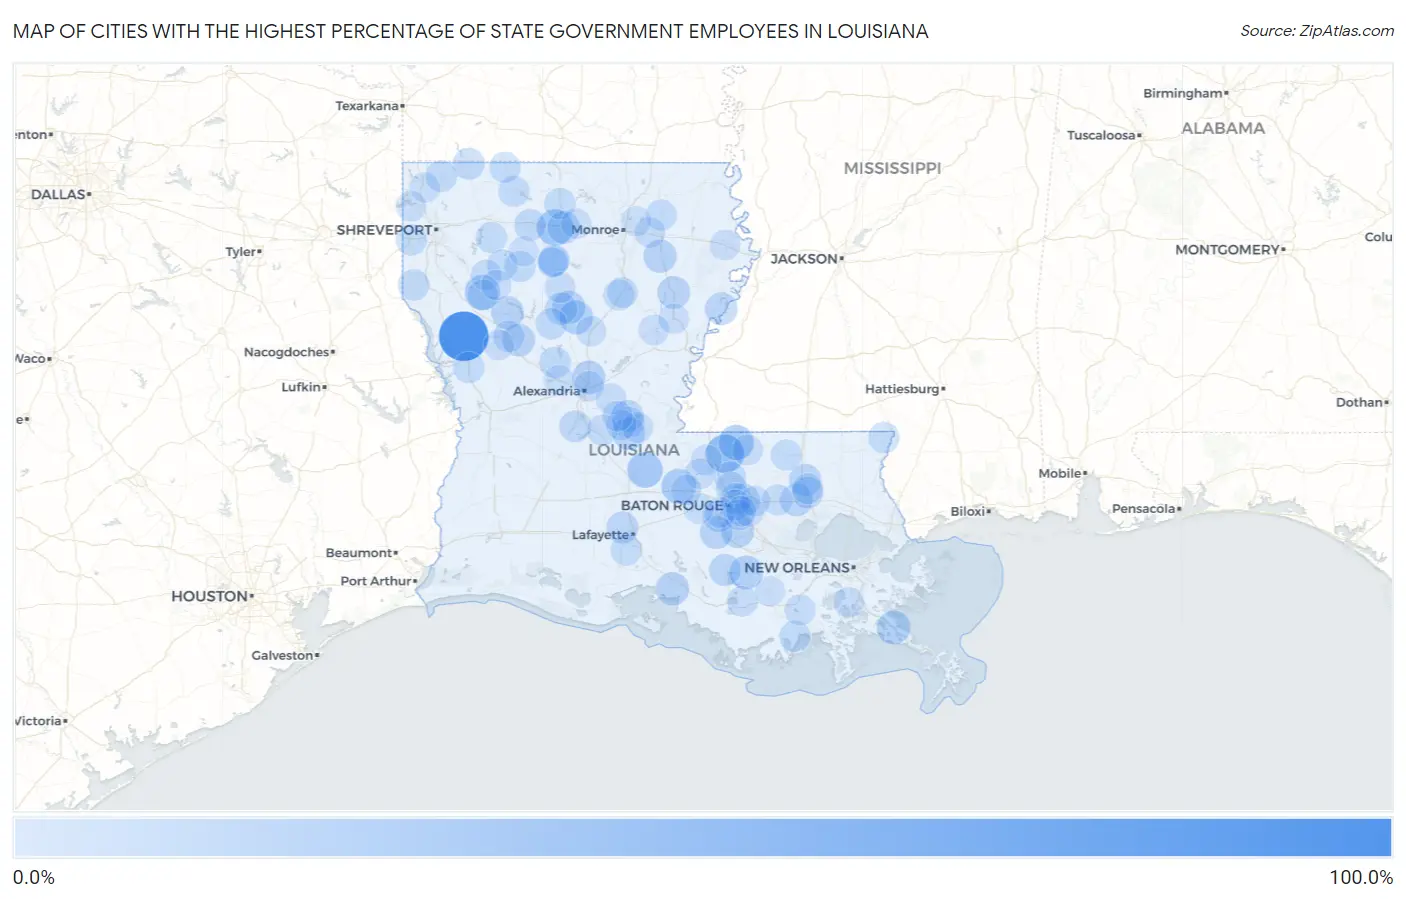
Map of Cities with the Highest Percentage of State Government Employees in Louisiana
0.0%
100.0%
Cities with the Highest Percentage of State Government Employees in Louisiana
| City | % State Government Employees | vs State | vs National | |
| 1. | Belmont | 96.4% | 5.8%(+90.7)#1 | 4.2%(+92.2)#38 |
| 2. | Jackson | 44.9% | 5.8%(+39.2)#2 | 4.2%(+40.7)#168 |
| 3. | Grambling | 36.2% | 5.8%(+30.4)#3 | 4.2%(+31.9)#268 |
| 4. | Palmetto | 32.3% | 5.8%(+26.5)#4 | 4.2%(+28.1)#371 |
| 5. | Edgefield | 31.6% | 5.8%(+25.9)#5 | 4.2%(+27.4)#393 |
| 6. | Wilson | 30.5% | 5.8%(+24.7)#6 | 4.2%(+26.2)#427 |
| 7. | Fordoche | 29.1% | 5.8%(+23.3)#7 | 4.2%(+24.9)#464 |
| 8. | Jordan Hill | 24.8% | 5.8%(+19.1)#8 | 4.2%(+20.6)#681 |
| 9. | Napoleonville | 24.6% | 5.8%(+18.8)#9 | 4.2%(+20.3)#701 |
| 10. | Port Sulphur | 24.5% | 5.8%(+18.7)#10 | 4.2%(+20.3)#704 |
| 11. | Ball | 23.6% | 5.8%(+17.9)#11 | 4.2%(+19.4)#758 |
| 12. | Glencoe | 22.9% | 5.8%(+17.1)#12 | 4.2%(+18.6)#799 |
| 13. | Mangham | 22.3% | 5.8%(+16.6)#13 | 4.2%(+18.1)#844 |
| 14. | Joyce | 22.2% | 5.8%(+16.4)#14 | 4.2%(+18.0)#857 |
| 15. | St Gabriel | 21.9% | 5.8%(+16.1)#15 | 4.2%(+17.6)#888 |
| 16. | Crescent | 21.3% | 5.8%(+15.5)#16 | 4.2%(+17.0)#948 |
| 17. | Gilbert | 20.6% | 5.8%(+14.9)#17 | 4.2%(+16.4)#1,006 |
| 18. | Campti | 20.6% | 5.8%(+14.8)#18 | 4.2%(+16.4)#1,009 |
| 19. | Point Place | 20.2% | 5.8%(+14.5)#19 | 4.2%(+16.0)#1,044 |
| 20. | Ruston | 19.6% | 5.8%(+13.8)#20 | 4.2%(+15.3)#1,120 |
| 21. | St Joseph | 19.5% | 5.8%(+13.7)#21 | 4.2%(+15.2)#1,124 |
| 22. | Cottonport | 19.2% | 5.8%(+13.5)#22 | 4.2%(+15.0)#1,153 |
| 23. | Albany | 19.2% | 5.8%(+13.4)#23 | 4.2%(+14.9)#1,162 |
| 24. | Independence | 18.7% | 5.8%(+12.9)#24 | 4.2%(+14.5)#1,219 |
| 25. | Monticello | 18.4% | 5.8%(+12.6)#25 | 4.2%(+14.1)#1,263 |
| 26. | Marksville | 18.1% | 5.8%(+12.3)#26 | 4.2%(+13.8)#1,319 |
| 27. | Winnfield | 17.7% | 5.8%(+11.9)#27 | 4.2%(+13.5)#1,367 |
| 28. | Pierre Part | 17.5% | 5.8%(+11.7)#28 | 4.2%(+13.3)#1,399 |
| 29. | Ossun | 17.3% | 5.8%(+11.5)#29 | 4.2%(+13.1)#1,428 |
| 30. | Natalbany | 17.1% | 5.8%(+11.3)#30 | 4.2%(+12.9)#1,460 |
| 31. | Zachary | 16.3% | 5.8%(+10.5)#31 | 4.2%(+12.1)#1,623 |
| 32. | Springhill | 16.1% | 5.8%(+10.4)#32 | 4.2%(+11.9)#1,656 |
| 33. | Forest Hill | 16.0% | 5.8%(+10.2)#33 | 4.2%(+11.7)#1,689 |
| 34. | Arcadia | 15.9% | 5.8%(+10.2)#34 | 4.2%(+11.7)#1,693 |
| 35. | Addis | 15.8% | 5.8%(+10.0)#35 | 4.2%(+11.6)#1,717 |
| 36. | Mansura | 15.4% | 5.8%(+9.66)#36 | 4.2%(+11.2)#1,817 |
| 37. | Plain Dealing | 15.1% | 5.8%(+9.30)#37 | 4.2%(+10.8)#1,899 |
| 38. | Colfax | 15.1% | 5.8%(+9.28)#38 | 4.2%(+10.8)#1,903 |
| 39. | Merrydale | 15.0% | 5.8%(+9.24)#39 | 4.2%(+10.8)#1,910 |
| 40. | Atlanta | 14.9% | 5.8%(+9.15)#40 | 4.2%(+10.7)#1,932 |
| 41. | Longstreet | 14.8% | 5.8%(+9.04)#41 | 4.2%(+10.6)#1,961 |
| 42. | North Hodge | 14.5% | 5.8%(+8.68)#42 | 4.2%(+10.2)#2,061 |
| 43. | Chauvin | 14.4% | 5.8%(+8.60)#43 | 4.2%(+10.1)#2,093 |
| 44. | Fisher | 14.3% | 5.8%(+8.51)#44 | 4.2%(+10.0)#2,126 |
| 45. | Lucky | 14.3% | 5.8%(+8.51)#45 | 4.2%(+10.0)#2,132 |
| 46. | Natchitoches | 14.2% | 5.8%(+8.40)#46 | 4.2%(+9.93)#2,181 |
| 47. | Heflin | 14.2% | 5.8%(+8.37)#47 | 4.2%(+9.91)#2,187 |
| 48. | Dubach | 14.0% | 5.8%(+8.26)#48 | 4.2%(+9.80)#2,221 |
| 49. | Milton | 14.0% | 5.8%(+8.18)#49 | 4.2%(+9.71)#2,248 |
| 50. | Baker | 13.7% | 5.8%(+7.95)#50 | 4.2%(+9.48)#2,322 |
| 51. | Angie | 13.4% | 5.8%(+7.62)#51 | 4.2%(+9.15)#2,423 |
| 52. | Homer | 13.3% | 5.8%(+7.56)#52 | 4.2%(+9.10)#2,443 |
| 53. | Haynesville | 13.3% | 5.8%(+7.54)#53 | 4.2%(+9.08)#2,465 |
| 54. | Castor | 13.3% | 5.8%(+7.49)#54 | 4.2%(+9.02)#2,481 |
| 55. | East Hodge | 13.3% | 5.8%(+7.48)#55 | 4.2%(+9.01)#2,488 |
| 56. | Greenwood | 13.1% | 5.8%(+7.34)#56 | 4.2%(+8.87)#2,526 |
| 57. | Greensburg | 13.1% | 5.8%(+7.30)#57 | 4.2%(+8.84)#2,544 |
| 58. | Clarks | 13.0% | 5.8%(+7.27)#58 | 4.2%(+8.80)#2,550 |
| 59. | Cheneyville | 12.8% | 5.8%(+7.02)#59 | 4.2%(+8.55)#2,641 |
| 60. | Oak Ridge | 12.8% | 5.8%(+6.99)#60 | 4.2%(+8.52)#2,654 |
| 61. | Lockport Heights | 12.5% | 5.8%(+6.69)#61 | 4.2%(+8.22)#2,778 |
| 62. | Moreauville | 12.2% | 5.8%(+6.39)#62 | 4.2%(+7.92)#2,904 |
| 63. | Dodson | 12.0% | 5.8%(+6.19)#63 | 4.2%(+7.72)#2,991 |
| 64. | Livingston | 11.9% | 5.8%(+6.09)#64 | 4.2%(+7.63)#3,033 |
| 65. | St Francisville | 11.9% | 5.8%(+6.08)#65 | 4.2%(+7.61)#3,038 |
| 66. | Hessmer | 11.7% | 5.8%(+5.91)#66 | 4.2%(+7.45)#3,127 |
| 67. | Tickfaw | 11.7% | 5.8%(+5.88)#67 | 4.2%(+7.42)#3,137 |
| 68. | Clinton | 11.6% | 5.8%(+5.85)#68 | 4.2%(+7.39)#3,155 |
| 69. | Bayou L Ourse | 11.5% | 5.8%(+5.71)#69 | 4.2%(+7.24)#3,230 |
| 70. | Grayson | 11.4% | 5.8%(+5.62)#70 | 4.2%(+7.16)#3,263 |
| 71. | Baton Rouge | 11.4% | 5.8%(+5.61)#71 | 4.2%(+7.14)#3,274 |
| 72. | Center Point | 11.3% | 5.8%(+5.53)#72 | 4.2%(+7.07)#3,318 |
| 73. | Start | 11.3% | 5.8%(+5.53)#73 | 4.2%(+7.06)#3,319 |
| 74. | Hall Summit | 11.3% | 5.8%(+5.53)#74 | 4.2%(+7.06)#3,325 |
| 75. | Harrisonburg | 11.2% | 5.8%(+5.44)#75 | 4.2%(+6.97)#3,371 |
| 76. | Provencal | 11.2% | 5.8%(+5.43)#76 | 4.2%(+6.96)#3,374 |
| 77. | Ventress | 11.2% | 5.8%(+5.38)#77 | 4.2%(+6.92)#3,396 |
| 78. | Tallulah | 11.1% | 5.8%(+5.37)#78 | 4.2%(+6.91)#3,405 |
| 79. | Oak Hills Place | 11.1% | 5.8%(+5.28)#79 | 4.2%(+6.81)#3,479 |
| 80. | Fifth Ward | 11.0% | 5.8%(+5.26)#80 | 4.2%(+6.79)#3,486 |
| 81. | Brusly | 11.0% | 5.8%(+5.22)#81 | 4.2%(+6.75)#3,506 |
| 82. | Livonia | 11.0% | 5.8%(+5.19)#82 | 4.2%(+6.72)#3,523 |
| 83. | Barataria | 10.9% | 5.8%(+5.09)#83 | 4.2%(+6.63)#3,580 |
| 84. | Pineville | 10.8% | 5.8%(+5.03)#84 | 4.2%(+6.56)#3,624 |
| 85. | Shenandoah | 10.8% | 5.8%(+5.02)#85 | 4.2%(+6.55)#3,628 |
| 86. | Mooringsport | 10.8% | 5.8%(+4.98)#86 | 4.2%(+6.52)#3,643 |
| 87. | Coushatta | 10.4% | 5.8%(+4.64)#87 | 4.2%(+6.18)#3,833 |
| 88. | Martin | 10.3% | 5.8%(+4.55)#88 | 4.2%(+6.08)#3,901 |
| 89. | Sicily Island | 10.2% | 5.8%(+4.46)#89 | 4.2%(+5.99)#3,952 |
| 90. | Denham Springs | 10.2% | 5.8%(+4.43)#90 | 4.2%(+5.97)#3,966 |
| 91. | Inniswold | 10.1% | 5.8%(+4.34)#91 | 4.2%(+5.87)#4,025 |
| 92. | Georgetown | 10.0% | 5.8%(+4.22)#92 | 4.2%(+5.76)#4,092 |
| 93. | Choudrant | 10.0% | 5.8%(+4.21)#93 | 4.2%(+5.74)#4,112 |
| 94. | Grosse Tete | 9.9% | 5.8%(+4.16)#94 | 4.2%(+5.70)#4,146 |
| 95. | Boyce | 9.8% | 5.8%(+4.05)#95 | 4.2%(+5.59)#4,205 |
| 96. | Swartz | 9.7% | 5.8%(+3.91)#96 | 4.2%(+5.45)#4,308 |
| 97. | Bienville | 9.7% | 5.8%(+3.90)#97 | 4.2%(+5.44)#4,322 |
| 98. | Hodge | 9.5% | 5.8%(+3.75)#98 | 4.2%(+5.28)#4,427 |
| 99. | Gilliam | 9.4% | 5.8%(+3.66)#99 | 4.2%(+5.19)#4,494 |
| 100. | Thibodaux | 9.1% | 5.8%(+3.35)#100 | 4.2%(+4.88)#4,713 |
Common Questions
What are the Top 10 Cities with the Highest Percentage of State Government Employees in Louisiana?
Top 10 Cities with the Highest Percentage of State Government Employees in Louisiana are:
#1
96.4%
#2
44.9%
#3
36.2%
#4
32.3%
#5
31.6%
#6
30.5%
#7
29.1%
#8
24.8%
#9
24.6%
#10
24.5%
What city has the Highest Percentage of State Government Employees in Louisiana?
Belmont has the Highest Percentage of State Government Employees in Louisiana with 96.4%.
What is the Percentage of State Government Employees in the State of Louisiana?
Percentage of State Government Employees in Louisiana is 5.8%.
What is the Percentage of State Government Employees in the United States?
Percentage of State Government Employees in the United States is 4.2%.