Cities with the Highest Percentage of State Government Employees in Michigan
RELATED REPORTS & OPTIONS
State Government Employees
Michigan
Compare Cities
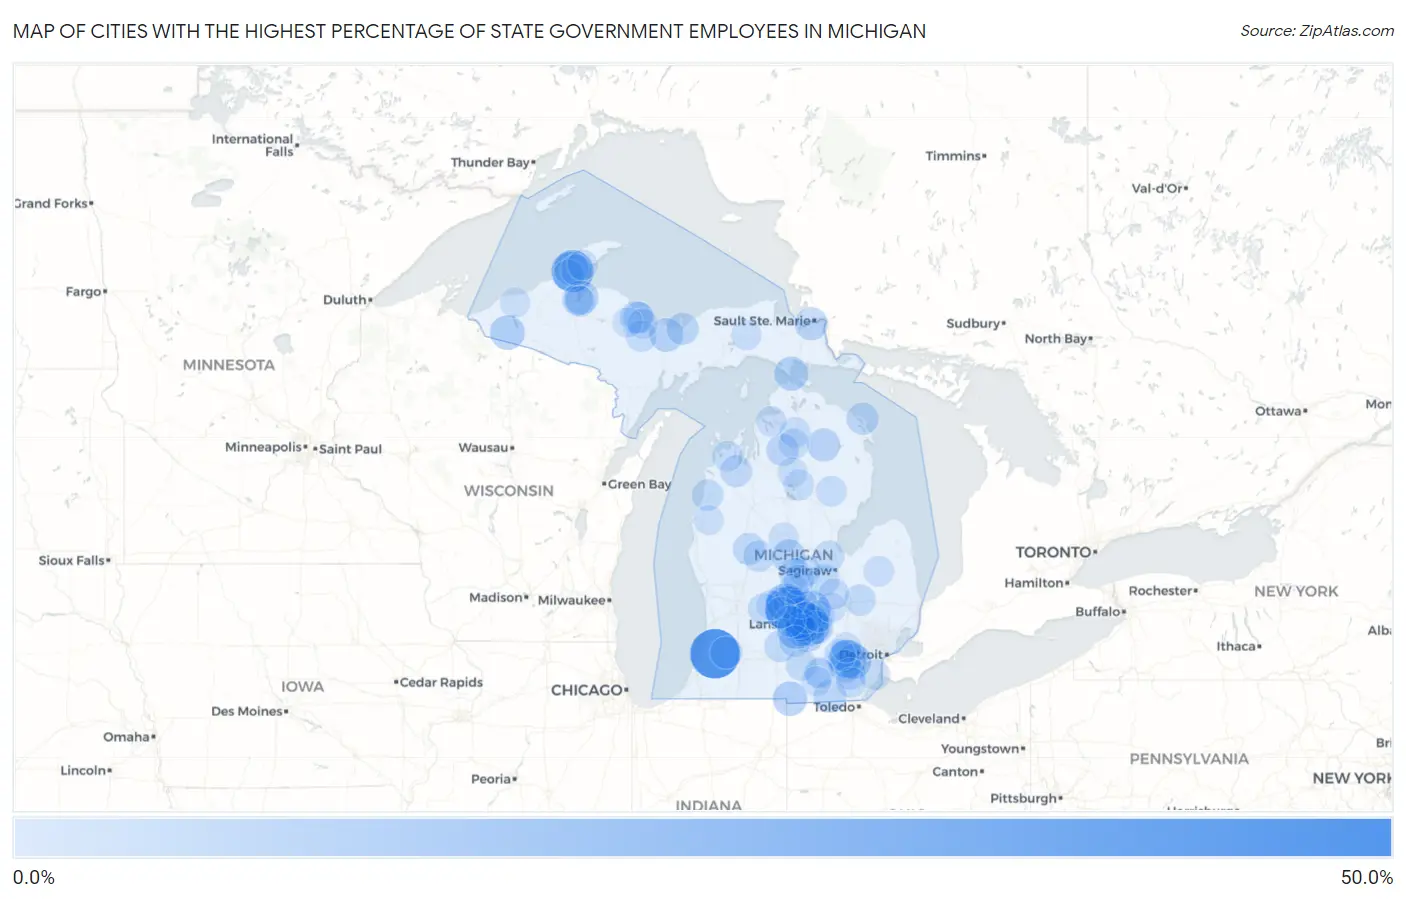
Map of Cities with the Highest Percentage of State Government Employees in Michigan
0.0%
50.0%
Cities with the Highest Percentage of State Government Employees in Michigan
| City | % State Government Employees | vs State | vs National | |
| 1. | Dodgeville | 42.9% | 3.7%(+39.2)#1 | 4.2%(+38.6)#184 |
| 2. | Breedsville | 40.9% | 3.7%(+37.2)#2 | 4.2%(+36.7)#205 |
| 3. | Westphalia | 31.8% | 3.7%(+28.2)#3 | 4.2%(+27.6)#389 |
| 4. | Pelkie | 31.6% | 3.7%(+27.9)#4 | 4.2%(+27.3)#396 |
| 5. | Houghton | 27.8% | 3.7%(+24.1)#5 | 4.2%(+23.5)#538 |
| 6. | East Lansing | 22.2% | 3.7%(+18.6)#6 | 4.2%(+18.0)#851 |
| 7. | Okemos | 21.9% | 3.7%(+18.2)#7 | 4.2%(+17.6)#885 |
| 8. | Rock | 21.3% | 3.7%(+17.7)#8 | 4.2%(+17.1)#944 |
| 9. | Lake Victoria | 20.5% | 3.7%(+16.8)#9 | 4.2%(+16.2)#1,024 |
| 10. | Ann Arbor | 20.4% | 3.7%(+16.8)#10 | 4.2%(+16.2)#1,028 |
| 11. | Pewamo | 20.2% | 3.7%(+16.5)#11 | 4.2%(+16.0)#1,051 |
| 12. | Dimondale | 19.9% | 3.7%(+16.2)#12 | 4.2%(+15.6)#1,094 |
| 13. | Haslett | 19.1% | 3.7%(+15.4)#13 | 4.2%(+14.9)#1,167 |
| 14. | Paris | 16.7% | 3.7%(+13.0)#14 | 4.2%(+12.4)#1,546 |
| 15. | Dewitt | 15.5% | 3.7%(+11.8)#15 | 4.2%(+11.2)#1,814 |
| 16. | Ypsilanti | 15.1% | 3.7%(+11.4)#16 | 4.2%(+10.8)#1,894 |
| 17. | Fulton | 14.8% | 3.7%(+11.1)#17 | 4.2%(+10.6)#1,960 |
| 18. | Marenisco | 14.3% | 3.7%(+10.6)#18 | 4.2%(+10.0)#2,121 |
| 19. | Camden | 13.9% | 3.7%(+10.2)#19 | 4.2%(+9.64)#2,272 |
| 20. | Hancock | 13.8% | 3.7%(+10.2)#20 | 4.2%(+9.60)#2,282 |
| 21. | St Ignace | 13.6% | 3.7%(+9.88)#21 | 4.2%(+9.31)#2,369 |
| 22. | Zeba | 13.5% | 3.7%(+9.79)#22 | 4.2%(+9.22)#2,399 |
| 23. | Mount Pleasant | 13.1% | 3.7%(+9.42)#23 | 4.2%(+8.85)#2,541 |
| 24. | Mason | 12.9% | 3.7%(+9.26)#24 | 4.2%(+8.69)#2,589 |
| 25. | Chatham | 12.8% | 3.7%(+9.15)#25 | 4.2%(+8.58)#2,633 |
| 26. | Waverly | 12.1% | 3.7%(+8.39)#26 | 4.2%(+7.82)#2,947 |
| 27. | Williamston | 12.0% | 3.7%(+8.35)#27 | 4.2%(+7.78)#2,965 |
| 28. | Lansing | 11.8% | 3.7%(+8.09)#28 | 4.2%(+7.52)#3,099 |
| 29. | Sault Ste Marie | 11.7% | 3.7%(+8.02)#29 | 4.2%(+7.45)#3,125 |
| 30. | Atlanta | 11.6% | 3.7%(+7.93)#30 | 4.2%(+7.36)#3,167 |
| 31. | Edgemont Park | 11.6% | 3.7%(+7.92)#31 | 4.2%(+7.35)#3,178 |
| 32. | Brimley | 11.5% | 3.7%(+7.86)#32 | 4.2%(+7.30)#3,198 |
| 33. | Fowler | 11.5% | 3.7%(+7.84)#33 | 4.2%(+7.27)#3,218 |
| 34. | Jasper | 11.2% | 3.7%(+7.56)#34 | 4.2%(+6.99)#3,366 |
| 35. | Barton Hills | 10.8% | 3.7%(+7.17)#35 | 4.2%(+6.60)#3,596 |
| 36. | Trowbridge Park | 10.8% | 3.7%(+7.12)#36 | 4.2%(+6.55)#3,627 |
| 37. | Holt | 10.8% | 3.7%(+7.09)#37 | 4.2%(+6.52)#3,639 |
| 38. | Lakes Of The North | 10.6% | 3.7%(+6.88)#38 | 4.2%(+6.31)#3,763 |
| 39. | Saline | 10.4% | 3.7%(+6.75)#39 | 4.2%(+6.18)#3,829 |
| 40. | Gobles | 10.4% | 3.7%(+6.75)#40 | 4.2%(+6.18)#3,830 |
| 41. | Munising | 10.3% | 3.7%(+6.61)#41 | 4.2%(+6.04)#3,928 |
| 42. | Tower | 10.3% | 3.7%(+6.58)#42 | 4.2%(+6.01)#3,941 |
| 43. | Presque Isle Harbor | 10.2% | 3.7%(+6.55)#43 | 4.2%(+5.98)#3,960 |
| 44. | St Johns | 10.0% | 3.7%(+6.30)#44 | 4.2%(+5.73)#4,119 |
| 45. | Big Rapids | 9.8% | 3.7%(+6.16)#45 | 4.2%(+5.59)#4,202 |
| 46. | St Charles | 9.8% | 3.7%(+6.13)#46 | 4.2%(+5.56)#4,224 |
| 47. | Grawn | 9.7% | 3.7%(+6.00)#47 | 4.2%(+5.43)#4,329 |
| 48. | Bath | 9.6% | 3.7%(+5.95)#48 | 4.2%(+5.38)#4,355 |
| 49. | Saranac | 9.5% | 3.7%(+5.85)#49 | 4.2%(+5.28)#4,426 |
| 50. | Milan | 9.5% | 3.7%(+5.84)#50 | 4.2%(+5.27)#4,443 |
| 51. | Portland | 9.5% | 3.7%(+5.79)#51 | 4.2%(+5.22)#4,477 |
| 52. | Olivet | 9.4% | 3.7%(+5.74)#52 | 4.2%(+5.17)#4,500 |
| 53. | Breckenridge | 9.4% | 3.7%(+5.69)#53 | 4.2%(+5.12)#4,550 |
| 54. | Perry | 9.3% | 3.7%(+5.63)#54 | 4.2%(+5.06)#4,596 |
| 55. | Eaton Rapids | 9.3% | 3.7%(+5.62)#55 | 4.2%(+5.05)#4,598 |
| 56. | Onekama | 9.1% | 3.7%(+5.42)#56 | 4.2%(+4.85)#4,736 |
| 57. | Davison | 9.1% | 3.7%(+5.41)#57 | 4.2%(+4.84)#4,760 |
| 58. | Canadian Lakes | 9.0% | 3.7%(+5.37)#58 | 4.2%(+4.80)#4,779 |
| 59. | Alma | 9.0% | 3.7%(+5.32)#59 | 4.2%(+4.75)#4,814 |
| 60. | Dexter | 9.0% | 3.7%(+5.31)#60 | 4.2%(+4.74)#4,817 |
| 61. | Auburn | 8.9% | 3.7%(+5.18)#61 | 4.2%(+4.61)#4,927 |
| 62. | Spring Arbor | 8.7% | 3.7%(+5.07)#62 | 4.2%(+4.50)#5,007 |
| 63. | Cannonsburg | 8.7% | 3.7%(+5.06)#63 | 4.2%(+4.50)#5,012 |
| 64. | Marquette | 8.6% | 3.7%(+4.96)#64 | 4.2%(+4.39)#5,112 |
| 65. | Grand Ledge | 8.6% | 3.7%(+4.95)#65 | 4.2%(+4.38)#5,115 |
| 66. | K I Sawyer | 8.6% | 3.7%(+4.95)#66 | 4.2%(+4.38)#5,119 |
| 67. | Mohawk | 8.4% | 3.7%(+4.76)#67 | 4.2%(+4.19)#5,295 |
| 68. | South Range | 8.4% | 3.7%(+4.70)#68 | 4.2%(+4.13)#5,352 |
| 69. | Baraga | 8.3% | 3.7%(+4.66)#69 | 4.2%(+4.09)#5,381 |
| 70. | Lupton | 8.2% | 3.7%(+4.56)#70 | 4.2%(+3.99)#5,484 |
| 71. | Roscommon | 8.1% | 3.7%(+4.47)#71 | 4.2%(+3.90)#5,569 |
| 72. | Hurontown | 8.1% | 3.7%(+4.43)#72 | 4.2%(+3.87)#5,611 |
| 73. | Dollar Bay | 8.1% | 3.7%(+4.41)#73 | 4.2%(+3.84)#5,630 |
| 74. | Chassell | 8.0% | 3.7%(+4.37)#74 | 4.2%(+3.80)#5,660 |
| 75. | New Lothrop | 8.0% | 3.7%(+4.28)#75 | 4.2%(+3.72)#5,748 |
| 76. | Vanderbilt | 7.9% | 3.7%(+4.28)#76 | 4.2%(+3.71)#5,764 |
| 77. | Maple City | 7.9% | 3.7%(+4.22)#77 | 4.2%(+3.65)#5,828 |
| 78. | Gaylord | 7.8% | 3.7%(+4.15)#78 | 4.2%(+3.58)#5,903 |
| 79. | L Anse | 7.8% | 3.7%(+4.14)#79 | 4.2%(+3.57)#5,914 |
| 80. | Rockwood | 7.8% | 3.7%(+4.13)#80 | 4.2%(+3.56)#5,923 |
| 81. | Ithaca | 7.7% | 3.7%(+4.00)#81 | 4.2%(+3.44)#6,070 |
| 82. | Lake Linden | 7.6% | 3.7%(+3.89)#82 | 4.2%(+3.33)#6,177 |
| 83. | Kingston | 7.5% | 3.7%(+3.87)#83 | 4.2%(+3.30)#6,201 |
| 84. | Horton Bay | 7.4% | 3.7%(+3.76)#84 | 4.2%(+3.19)#6,332 |
| 85. | Newberry | 7.4% | 3.7%(+3.73)#85 | 4.2%(+3.17)#6,352 |
| 86. | Harvey | 7.4% | 3.7%(+3.69)#86 | 4.2%(+3.12)#6,398 |
| 87. | Dundee | 7.2% | 3.7%(+3.55)#87 | 4.2%(+2.98)#6,566 |
| 88. | Grayling | 7.1% | 3.7%(+3.43)#88 | 4.2%(+2.86)#6,706 |
| 89. | Vineyard Lake | 7.1% | 3.7%(+3.42)#89 | 4.2%(+2.85)#6,717 |
| 90. | Farwell | 7.1% | 3.7%(+3.41)#90 | 4.2%(+2.84)#6,729 |
| 91. | Millburg | 7.1% | 3.7%(+3.39)#91 | 4.2%(+2.82)#6,755 |
| 92. | Brooklyn | 7.0% | 3.7%(+3.37)#92 | 4.2%(+2.80)#6,770 |
| 93. | Manitou Beach Devils Lake | 7.0% | 3.7%(+3.36)#93 | 4.2%(+2.79)#6,782 |
| 94. | Whitmore Lake | 7.0% | 3.7%(+3.32)#94 | 4.2%(+2.75)#6,833 |
| 95. | Ionia | 6.9% | 3.7%(+3.25)#95 | 4.2%(+2.68)#6,911 |
| 96. | Negaunee | 6.9% | 3.7%(+3.23)#96 | 4.2%(+2.66)#6,932 |
| 97. | White Pine | 6.9% | 3.7%(+3.22)#97 | 4.2%(+2.65)#6,940 |
| 98. | Perrinton | 6.9% | 3.7%(+3.18)#98 | 4.2%(+2.61)#6,984 |
| 99. | Fountain | 6.8% | 3.7%(+3.18)#99 | 4.2%(+2.61)#7,001 |
| 100. | Vernon | 6.8% | 3.7%(+3.16)#100 | 4.2%(+2.60)#7,022 |
Common Questions
What are the Top 10 Cities with the Highest Percentage of State Government Employees in Michigan?
Top 10 Cities with the Highest Percentage of State Government Employees in Michigan are:
#1
40.9%
#2
31.8%
#3
27.8%
#4
22.2%
#5
21.9%
#6
20.5%
#7
20.4%
#8
20.2%
#9
19.9%
#10
19.1%
What city has the Highest Percentage of State Government Employees in Michigan?
Breedsville has the Highest Percentage of State Government Employees in Michigan with 40.9%.
What is the Percentage of State Government Employees in the State of Michigan?
Percentage of State Government Employees in Michigan is 3.7%.
What is the Percentage of State Government Employees in the United States?
Percentage of State Government Employees in the United States is 4.2%.