Cities with the Highest Percentage of State Government Employees in Massachusetts
RELATED REPORTS & OPTIONS
State Government Employees
Massachusetts
Compare Cities
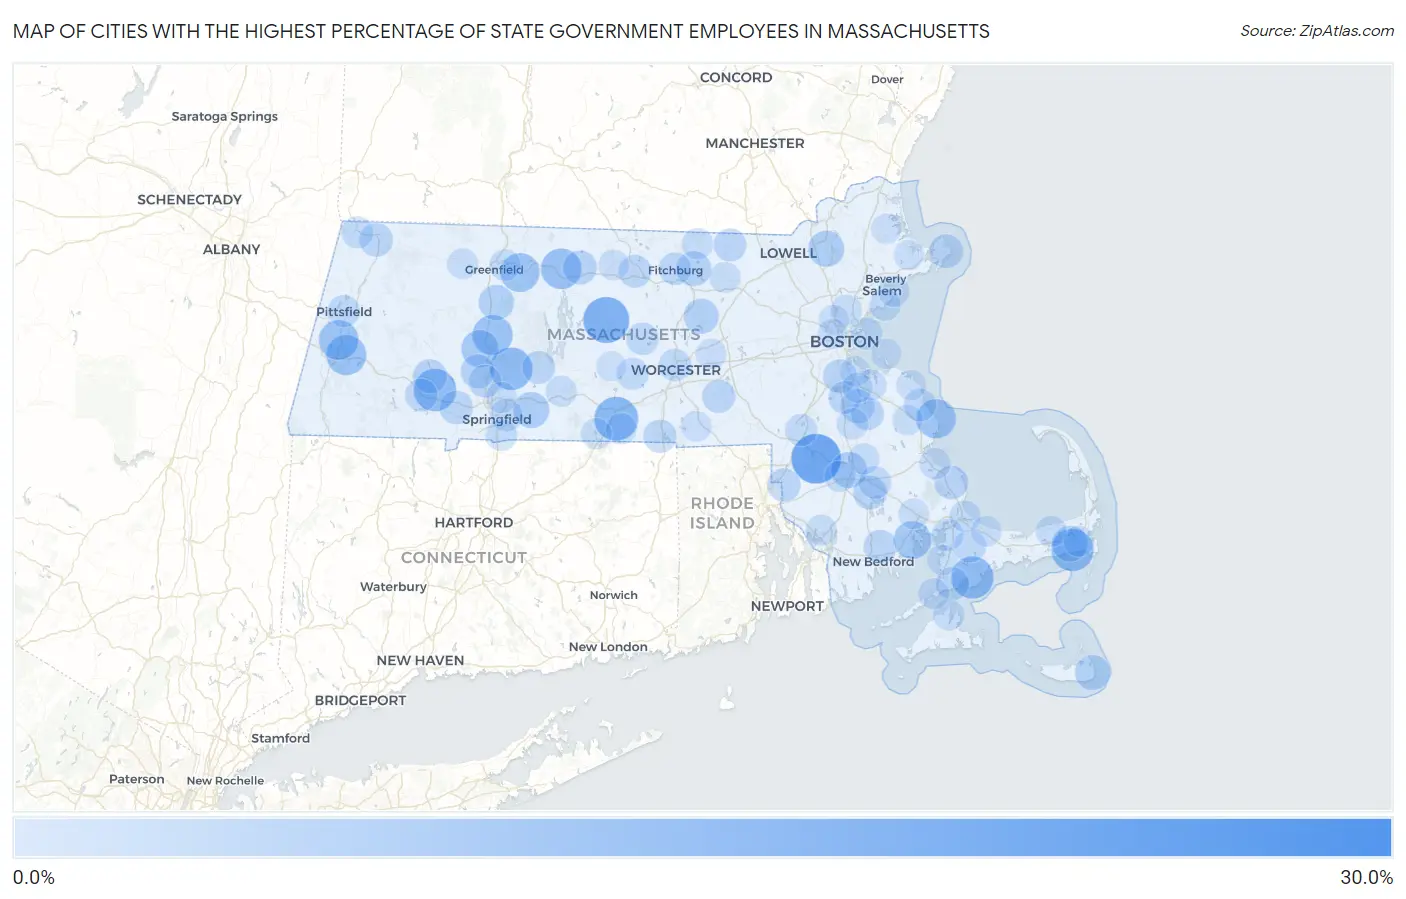
Map of Cities with the Highest Percentage of State Government Employees in Massachusetts
0.0%
30.0%
Cities with the Highest Percentage of State Government Employees in Massachusetts
| City | % State Government Employees | vs State | vs National | |
| 1. | Amherst | 26.8% | 3.7%(+23.1)#1 | 4.2%(+22.6)#580 |
| 2. | Norton Center | 20.2% | 3.7%(+16.5)#2 | 4.2%(+16.0)#1,045 |
| 3. | Barre | 17.2% | 3.7%(+13.4)#3 | 4.2%(+12.9)#1,450 |
| 4. | Sturbridge | 15.2% | 3.7%(+11.5)#4 | 4.2%(+11.0)#1,861 |
| 5. | Granby | 14.2% | 3.7%(+10.5)#5 | 4.2%(+9.96)#2,172 |
| 6. | Russell | 14.1% | 3.7%(+10.4)#6 | 4.2%(+9.89)#2,191 |
| 7. | Harwich Port | 14.0% | 3.7%(+10.2)#7 | 4.2%(+9.71)#2,250 |
| 8. | Seabrook | 13.9% | 3.7%(+10.2)#8 | 4.2%(+9.64)#2,271 |
| 9. | Orange | 12.4% | 3.7%(+8.73)#9 | 4.2%(+8.19)#2,786 |
| 10. | Lee | 12.0% | 3.7%(+8.27)#10 | 4.2%(+7.74)#2,985 |
| 11. | Hatfield | 12.0% | 3.7%(+8.25)#11 | 4.2%(+7.71)#2,993 |
| 12. | Lenox | 11.6% | 3.7%(+7.90)#12 | 4.2%(+7.37)#3,163 |
| 13. | Ocean Bluff Brant Rock | 11.4% | 3.7%(+7.69)#13 | 4.2%(+7.15)#3,267 |
| 14. | Millers Falls | 11.1% | 3.7%(+7.40)#14 | 4.2%(+6.87)#3,423 |
| 15. | Marion Center | 10.1% | 3.7%(+6.37)#15 | 4.2%(+5.84)#4,050 |
| 16. | Northampton | 9.6% | 3.7%(+5.93)#16 | 4.2%(+5.40)#4,348 |
| 17. | Wilbraham | 8.5% | 3.7%(+4.81)#17 | 4.2%(+4.28)#5,209 |
| 18. | Raynham Center | 8.5% | 3.7%(+4.80)#18 | 4.2%(+4.27)#5,219 |
| 19. | Andover | 8.5% | 3.7%(+4.79)#19 | 4.2%(+4.26)#5,236 |
| 20. | Harwich Center | 8.3% | 3.7%(+4.62)#20 | 4.2%(+4.09)#5,382 |
| 21. | South Deerfield | 7.8% | 3.7%(+4.09)#21 | 4.2%(+3.56)#5,921 |
| 22. | South Lancaster | 7.7% | 3.7%(+4.03)#22 | 4.2%(+3.49)#5,997 |
| 23. | Siasconset | 7.7% | 3.7%(+3.98)#23 | 4.2%(+3.45)#6,049 |
| 24. | Lunenburg | 7.6% | 3.7%(+3.85)#24 | 4.2%(+3.31)#6,190 |
| 25. | Huntington | 6.8% | 3.7%(+3.08)#25 | 4.2%(+2.55)#7,077 |
| 26. | Holbrook | 6.8% | 3.7%(+3.07)#26 | 4.2%(+2.54)#7,084 |
| 27. | Athol | 6.8% | 3.7%(+3.04)#27 | 4.2%(+2.51)#7,123 |
| 28. | Milton | 6.7% | 3.7%(+3.02)#28 | 4.2%(+2.49)#7,153 |
| 29. | Rockport | 6.7% | 3.7%(+2.96)#29 | 4.2%(+2.42)#7,220 |
| 30. | Easthampton Town | 6.6% | 3.7%(+2.90)#30 | 4.2%(+2.37)#7,315 |
| 31. | The Pinehills | 6.5% | 3.7%(+2.83)#31 | 4.2%(+2.30)#7,416 |
| 32. | North Lakeville | 6.5% | 3.7%(+2.79)#32 | 4.2%(+2.25)#7,480 |
| 33. | North Adams | 6.4% | 3.7%(+2.71)#33 | 4.2%(+2.18)#7,577 |
| 34. | Westfield | 6.3% | 3.7%(+2.63)#34 | 4.2%(+2.10)#7,704 |
| 35. | Upton | 6.2% | 3.7%(+2.50)#35 | 4.2%(+1.97)#7,889 |
| 36. | North Seekonk | 6.2% | 3.7%(+2.48)#36 | 4.2%(+1.95)#7,915 |
| 37. | Cedar Crest | 6.1% | 3.7%(+2.39)#37 | 4.2%(+1.85)#8,068 |
| 38. | Webster | 6.1% | 3.7%(+2.37)#38 | 4.2%(+1.83)#8,103 |
| 39. | Gardner | 6.0% | 3.7%(+2.27)#39 | 4.2%(+1.73)#8,282 |
| 40. | Acushnet Center | 5.9% | 3.7%(+2.22)#40 | 4.2%(+1.69)#8,366 |
| 41. | Abington | 5.8% | 3.7%(+2.08)#41 | 4.2%(+1.54)#8,596 |
| 42. | Teaticket | 5.8% | 3.7%(+2.07)#42 | 4.2%(+1.53)#8,617 |
| 43. | East Pepperell | 5.8% | 3.7%(+2.05)#43 | 4.2%(+1.52)#8,644 |
| 44. | Randolph Town | 5.8% | 3.7%(+2.04)#44 | 4.2%(+1.51)#8,659 |
| 45. | Holyoke | 5.7% | 3.7%(+2.03)#45 | 4.2%(+1.50)#8,676 |
| 46. | Belchertown | 5.7% | 3.7%(+2.02)#46 | 4.2%(+1.48)#8,698 |
| 47. | Blandford | 5.7% | 3.7%(+1.97)#47 | 4.2%(+1.44)#8,786 |
| 48. | Marshfield Hills | 5.7% | 3.7%(+1.95)#48 | 4.2%(+1.42)#8,831 |
| 49. | Worcester | 5.6% | 3.7%(+1.88)#49 | 4.2%(+1.35)#8,937 |
| 50. | Fitchburg | 5.6% | 3.7%(+1.87)#50 | 4.2%(+1.34)#8,953 |
| 51. | Middleborough Center | 5.5% | 3.7%(+1.83)#51 | 4.2%(+1.29)#9,054 |
| 52. | Forestdale | 5.5% | 3.7%(+1.80)#52 | 4.2%(+1.26)#9,104 |
| 53. | Rutland | 5.5% | 3.7%(+1.79)#53 | 4.2%(+1.25)#9,125 |
| 54. | Springfield | 5.4% | 3.7%(+1.71)#54 | 4.2%(+1.17)#9,275 |
| 55. | Pittsfield | 5.3% | 3.7%(+1.62)#55 | 4.2%(+1.08)#9,442 |
| 56. | Winthrop Town | 5.2% | 3.7%(+1.54)#56 | 4.2%(+1.00)#9,616 |
| 57. | Foxborough | 5.2% | 3.7%(+1.49)#57 | 4.2%(+0.958)#9,698 |
| 58. | Monument Beach | 5.2% | 3.7%(+1.45)#58 | 4.2%(+0.921)#9,787 |
| 59. | Spencer | 5.1% | 3.7%(+1.40)#59 | 4.2%(+0.868)#9,892 |
| 60. | Williamstown | 5.1% | 3.7%(+1.36)#60 | 4.2%(+0.826)#9,987 |
| 61. | Greenfield | 5.0% | 3.7%(+1.28)#61 | 4.2%(+0.744)#10,161 |
| 62. | Longmeadow | 4.8% | 3.7%(+1.07)#62 | 4.2%(+0.541)#10,600 |
| 63. | Swampscott | 4.7% | 3.7%(+0.978)#63 | 4.2%(+0.444)#10,809 |
| 64. | Sagamore | 4.6% | 3.7%(+0.891)#64 | 4.2%(+0.358)#10,989 |
| 65. | Turners Falls | 4.6% | 3.7%(+0.870)#65 | 4.2%(+0.337)#11,042 |
| 66. | Townsend | 4.5% | 3.7%(+0.807)#66 | 4.2%(+0.274)#11,207 |
| 67. | Brockton | 4.5% | 3.7%(+0.797)#67 | 4.2%(+0.264)#11,224 |
| 68. | Salem | 4.5% | 3.7%(+0.766)#68 | 4.2%(+0.233)#11,292 |
| 69. | Southbridge Town | 4.5% | 3.7%(+0.750)#69 | 4.2%(+0.217)#11,331 |
| 70. | Bridgewater Town | 4.4% | 3.7%(+0.723)#70 | 4.2%(+0.190)#11,398 |
| 71. | Plymouth | 4.4% | 3.7%(+0.722)#71 | 4.2%(+0.189)#11,400 |
| 72. | Chicopee | 4.4% | 3.7%(+0.719)#72 | 4.2%(+0.185)#11,407 |
| 73. | Taunton | 4.4% | 3.7%(+0.661)#73 | 4.2%(+0.128)#11,533 |
| 74. | Palmer Town | 4.4% | 3.7%(+0.659)#74 | 4.2%(+0.126)#11,540 |
| 75. | Ayer | 4.3% | 3.7%(+0.590)#75 | 4.2%(+0.057)#11,705 |
| 76. | Somerset | 4.3% | 3.7%(+0.559)#76 | 4.2%(+0.026)#11,780 |
| 77. | East Dennis | 4.3% | 3.7%(+0.558)#77 | 4.2%(+0.024)#11,785 |
| 78. | Melrose | 4.2% | 3.7%(+0.539)#78 | 4.2%(+0.005)#11,845 |
| 79. | Holland | 4.2% | 3.7%(+0.535)#79 | 4.2%(+0.002)#11,851 |
| 80. | Vineyard Haven | 4.2% | 3.7%(+0.478)#80 | 4.2%(-0.056)#11,990 |
| 81. | Shelburne Falls | 4.2% | 3.7%(+0.469)#81 | 4.2%(-0.065)#12,011 |
| 82. | Woods Hole | 4.2% | 3.7%(+0.458)#82 | 4.2%(-0.076)#12,029 |
| 83. | Weymouth Town | 4.1% | 3.7%(+0.382)#83 | 4.2%(-0.151)#12,246 |
| 84. | West Wareham | 4.1% | 3.7%(+0.350)#84 | 4.2%(-0.183)#12,343 |
| 85. | North Pembroke | 4.0% | 3.7%(+0.269)#85 | 4.2%(-0.264)#12,554 |
| 86. | Baldwinville | 4.0% | 3.7%(+0.251)#86 | 4.2%(-0.282)#12,597 |
| 87. | East Harwich | 4.0% | 3.7%(+0.242)#87 | 4.2%(-0.292)#12,632 |
| 88. | North Falmouth | 3.8% | 3.7%(+0.134)#88 | 4.2%(-0.400)#12,928 |
| 89. | East Sandwich | 3.8% | 3.7%(+0.130)#89 | 4.2%(-0.403)#12,936 |
| 90. | Northborough | 3.8% | 3.7%(+0.117)#90 | 4.2%(-0.417)#12,967 |
| 91. | East Douglas | 3.8% | 3.7%(+0.105)#91 | 4.2%(-0.428)#13,013 |
| 92. | Quincy | 3.7% | 3.7%(+0.037)#92 | 4.2%(-0.497)#13,231 |
| 93. | Braintree Town | 3.7% | 3.7%(+0.031)#93 | 4.2%(-0.503)#13,243 |
| 94. | Medford | 3.7% | 3.7%(-0.004)#94 | 4.2%(-0.537)#13,323 |
| 95. | North Scituate | 3.7% | 3.7%(-0.037)#95 | 4.2%(-0.570)#13,431 |
| 96. | Hull | 3.7% | 3.7%(-0.049)#96 | 4.2%(-0.583)#13,465 |
| 97. | Rowley | 3.6% | 3.7%(-0.074)#97 | 4.2%(-0.608)#13,552 |
| 98. | Cambridge | 3.6% | 3.7%(-0.099)#98 | 4.2%(-0.632)#13,625 |
| 99. | Essex | 3.6% | 3.7%(-0.134)#99 | 4.2%(-0.667)#13,738 |
| 100. | North Brookfield | 3.6% | 3.7%(-0.151)#100 | 4.2%(-0.684)#13,797 |
Common Questions
What are the Top 10 Cities with the Highest Percentage of State Government Employees in Massachusetts?
Top 10 Cities with the Highest Percentage of State Government Employees in Massachusetts are:
#1
20.2%
#2
17.2%
#3
15.2%
#4
14.2%
#5
14.1%
#6
14.0%
#7
13.9%
#8
12.4%
#9
12.0%
#10
12.0%
What city has the Highest Percentage of State Government Employees in Massachusetts?
Norton Center has the Highest Percentage of State Government Employees in Massachusetts with 20.2%.
What is the Percentage of State Government Employees in the State of Massachusetts?
Percentage of State Government Employees in Massachusetts is 3.7%.
What is the Percentage of State Government Employees in the United States?
Percentage of State Government Employees in the United States is 4.2%.