Cities with the Highest Percentage of State Government Employees in Maine
RELATED REPORTS & OPTIONS
State Government Employees
Maine
Compare Cities
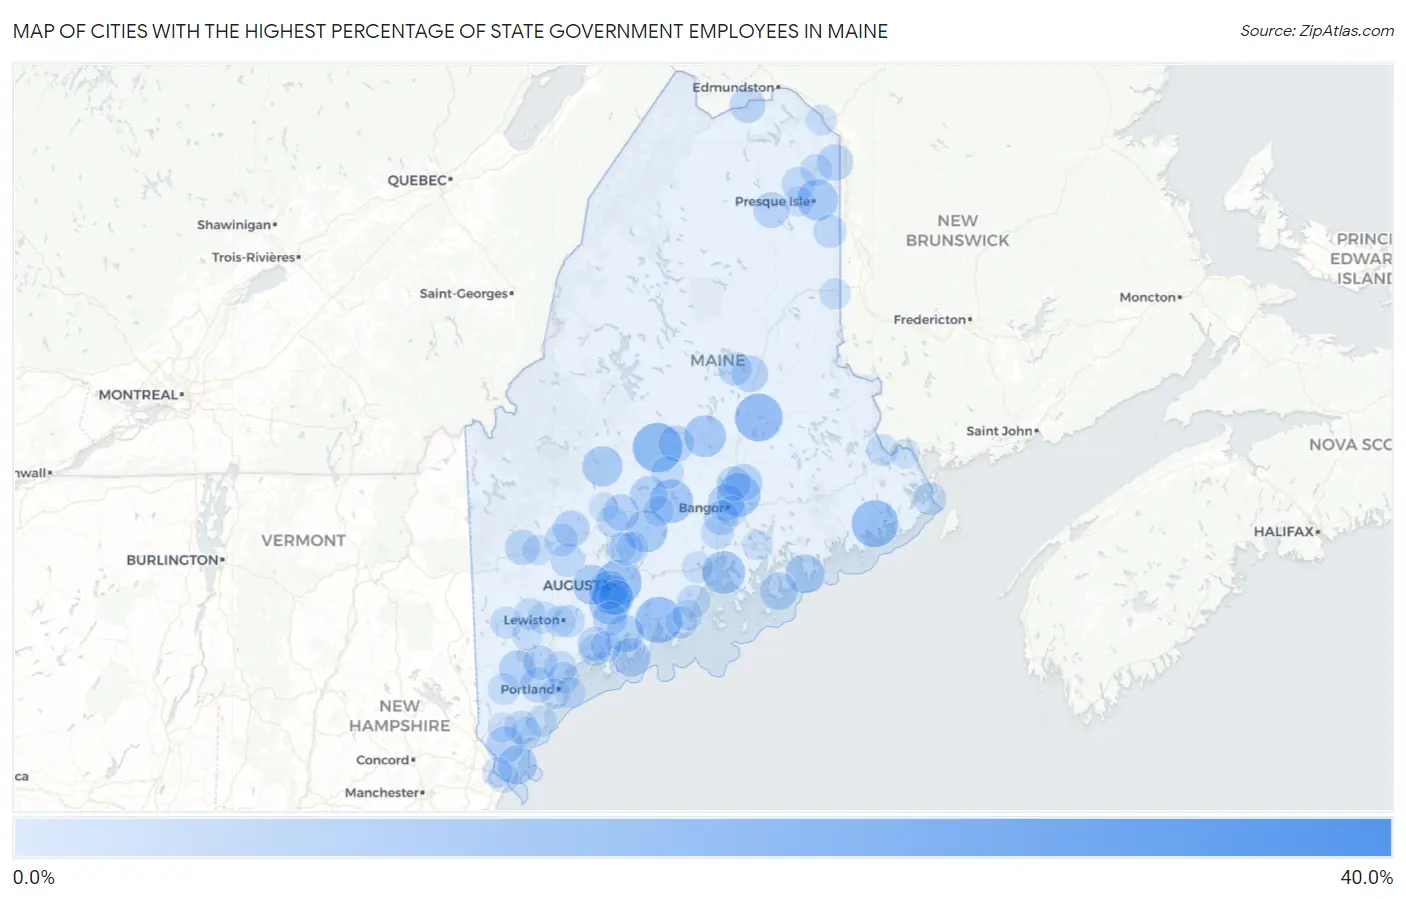
Map of Cities with the Highest Percentage of State Government Employees in Maine
0.0%
40.0%
Cities with the Highest Percentage of State Government Employees in Maine
| City | % State Government Employees | vs State | vs National | |
| 1. | Patten | 38.1% | 3.9%(+34.1)#1 | 4.2%(+33.8)#237 |
| 2. | Guilford | 17.9% | 3.9%(+14.0)#2 | 4.2%(+13.7)#1,340 |
| 3. | Lincoln | 16.5% | 3.9%(+12.6)#3 | 4.2%(+12.3)#1,585 |
| 4. | Machias | 15.7% | 3.9%(+11.8)#4 | 4.2%(+11.5)#1,744 |
| 5. | Waldoboro | 15.4% | 3.9%(+11.5)#5 | 4.2%(+11.2)#1,826 |
| 6. | Augusta | 14.6% | 3.9%(+10.7)#6 | 4.2%(+10.3)#2,026 |
| 7. | Newport | 13.0% | 3.9%(+9.07)#7 | 4.2%(+8.75)#2,564 |
| 8. | Orono | 12.7% | 3.9%(+8.81)#8 | 4.2%(+8.49)#2,664 |
| 9. | Castine | 12.3% | 3.9%(+8.39)#9 | 4.2%(+8.07)#2,839 |
| 10. | Clinton | 11.6% | 3.9%(+7.72)#10 | 4.2%(+7.41)#3,145 |
| 11. | Milo | 11.6% | 3.9%(+7.71)#11 | 4.2%(+7.39)#3,153 |
| 12. | Gardiner | 11.1% | 3.9%(+7.22)#12 | 4.2%(+6.90)#3,408 |
| 13. | Presque Isle | 11.0% | 3.9%(+7.10)#13 | 4.2%(+6.78)#3,493 |
| 14. | Farmingdale | 10.3% | 3.9%(+6.39)#14 | 4.2%(+6.07)#3,908 |
| 15. | Milbridge | 10.2% | 3.9%(+6.28)#15 | 4.2%(+5.96)#3,970 |
| 16. | Bingham | 10.1% | 3.9%(+6.22)#16 | 4.2%(+5.90)#4,010 |
| 17. | Winthrop | 10.0% | 3.9%(+6.08)#17 | 4.2%(+5.76)#4,079 |
| 18. | Island Falls | 9.9% | 3.9%(+5.99)#18 | 4.2%(+5.68)#4,157 |
| 19. | Hallowell | 9.3% | 3.9%(+5.39)#19 | 4.2%(+5.07)#4,585 |
| 20. | Oakfield | 9.2% | 3.9%(+5.29)#20 | 4.2%(+4.97)#4,659 |
| 21. | Winter Harbor | 9.2% | 3.9%(+5.29)#21 | 4.2%(+4.97)#4,660 |
| 22. | Cape Neddick | 9.1% | 3.9%(+5.20)#22 | 4.2%(+4.88)#4,714 |
| 23. | Boothbay Harbor | 8.8% | 3.9%(+4.90)#23 | 4.2%(+4.58)#4,950 |
| 24. | Wiscasset | 8.4% | 3.9%(+4.43)#24 | 4.2%(+4.12)#5,364 |
| 25. | Kingfield | 8.2% | 3.9%(+4.27)#25 | 4.2%(+3.95)#5,529 |
| 26. | Southwest Harbor | 8.0% | 3.9%(+4.05)#26 | 4.2%(+3.73)#5,729 |
| 27. | Hartland | 7.9% | 3.9%(+4.00)#27 | 4.2%(+3.68)#5,798 |
| 28. | North Berwick | 7.8% | 3.9%(+3.87)#28 | 4.2%(+3.55)#5,932 |
| 29. | Milford | 7.5% | 3.9%(+3.61)#29 | 4.2%(+3.29)#6,214 |
| 30. | Danforth | 7.5% | 3.9%(+3.56)#30 | 4.2%(+3.24)#6,279 |
| 31. | Steep Falls | 7.4% | 3.9%(+3.52)#31 | 4.2%(+3.20)#6,317 |
| 32. | Bangor | 7.3% | 3.9%(+3.39)#32 | 4.2%(+3.07)#6,449 |
| 33. | Skowhegan | 7.2% | 3.9%(+3.33)#33 | 4.2%(+3.01)#6,537 |
| 34. | East Millinocket | 7.2% | 3.9%(+3.31)#34 | 4.2%(+2.99)#6,560 |
| 35. | Farmington | 7.1% | 3.9%(+3.18)#35 | 4.2%(+2.86)#6,708 |
| 36. | Dover Foxcroft | 6.9% | 3.9%(+2.97)#36 | 4.2%(+2.65)#6,937 |
| 37. | Limestone | 6.8% | 3.9%(+2.88)#37 | 4.2%(+2.56)#7,066 |
| 38. | Fort Kent | 6.7% | 3.9%(+2.75)#38 | 4.2%(+2.43)#7,217 |
| 39. | Veazie | 6.6% | 3.9%(+2.71)#39 | 4.2%(+2.39)#7,289 |
| 40. | Ashland | 6.5% | 3.9%(+2.61)#40 | 4.2%(+2.29)#7,427 |
| 41. | Gorham | 6.3% | 3.9%(+2.36)#41 | 4.2%(+2.05)#7,771 |
| 42. | Rumford | 6.1% | 3.9%(+2.21)#42 | 4.2%(+1.89)#8,001 |
| 43. | Randolph | 6.1% | 3.9%(+2.20)#43 | 4.2%(+1.88)#8,009 |
| 44. | Hampden | 5.8% | 3.9%(+1.90)#44 | 4.2%(+1.58)#8,544 |
| 45. | Richmond | 5.6% | 3.9%(+1.71)#45 | 4.2%(+1.39)#8,860 |
| 46. | Old Town | 5.6% | 3.9%(+1.64)#46 | 4.2%(+1.32)#8,974 |
| 47. | North Windham | 5.4% | 3.9%(+1.46)#47 | 4.2%(+1.14)#9,334 |
| 48. | Topsham | 5.3% | 3.9%(+1.33)#48 | 4.2%(+1.01)#9,606 |
| 49. | Livermore Falls | 5.0% | 3.9%(+1.10)#49 | 4.2%(+0.783)#10,085 |
| 50. | Millinocket | 5.0% | 3.9%(+1.08)#50 | 4.2%(+0.761)#10,123 |
| 51. | Washburn | 5.0% | 3.9%(+1.06)#51 | 4.2%(+0.741)#10,167 |
| 52. | West Kennebunk | 5.0% | 3.9%(+1.06)#52 | 4.2%(+0.739)#10,168 |
| 53. | Waterville | 4.7% | 3.9%(+0.737)#53 | 4.2%(+0.418)#10,863 |
| 54. | Blaine | 4.6% | 3.9%(+0.713)#54 | 4.2%(+0.393)#10,919 |
| 55. | Wilton | 4.6% | 3.9%(+0.646)#55 | 4.2%(+0.327)#11,066 |
| 56. | Cumberland Center | 4.5% | 3.9%(+0.555)#56 | 4.2%(+0.235)#11,282 |
| 57. | Lubec | 4.3% | 3.9%(+0.332)#57 | 4.2%(+0.013)#11,827 |
| 58. | Dexter | 4.1% | 3.9%(+0.202)#58 | 4.2%(-0.117)#12,146 |
| 59. | Camden | 4.1% | 3.9%(+0.171)#59 | 4.2%(-0.148)#12,233 |
| 60. | Winterport | 4.1% | 3.9%(+0.154)#60 | 4.2%(-0.165)#12,298 |
| 61. | Cornish | 3.8% | 3.9%(-0.083)#61 | 4.2%(-0.402)#12,933 |
| 62. | Lewiston | 3.8% | 3.9%(-0.115)#62 | 4.2%(-0.434)#13,036 |
| 63. | Oak Hill | 3.8% | 3.9%(-0.131)#63 | 4.2%(-0.451)#13,080 |
| 64. | Caribou | 3.8% | 3.9%(-0.139)#64 | 4.2%(-0.458)#13,107 |
| 65. | Brunswick | 3.7% | 3.9%(-0.189)#65 | 4.2%(-0.508)#13,255 |
| 66. | Mechanic Falls | 3.6% | 3.9%(-0.330)#66 | 4.2%(-0.649)#13,682 |
| 67. | Bridgton | 3.6% | 3.9%(-0.352)#67 | 4.2%(-0.671)#13,749 |
| 68. | Thomaston | 3.5% | 3.9%(-0.387)#68 | 4.2%(-0.706)#13,862 |
| 69. | Woodland | 3.5% | 3.9%(-0.389)#69 | 4.2%(-0.708)#13,870 |
| 70. | Lake Arrowhead | 3.5% | 3.9%(-0.408)#70 | 4.2%(-0.727)#13,924 |
| 71. | Bradley | 3.4% | 3.9%(-0.490)#71 | 4.2%(-0.809)#14,185 |
| 72. | Winslow | 3.4% | 3.9%(-0.534)#72 | 4.2%(-0.853)#14,316 |
| 73. | Auburn | 3.3% | 3.9%(-0.623)#73 | 4.2%(-0.943)#14,556 |
| 74. | Belfast | 3.3% | 3.9%(-0.639)#74 | 4.2%(-0.958)#14,602 |
| 75. | Norridgewock | 3.1% | 3.9%(-0.787)#75 | 4.2%(-1.11)#15,090 |
| 76. | Oxford | 3.1% | 3.9%(-0.828)#76 | 4.2%(-1.15)#15,209 |
| 77. | Falmouth Foreside | 3.0% | 3.9%(-0.936)#77 | 4.2%(-1.26)#15,537 |
| 78. | Portland | 2.9% | 3.9%(-1.04)#78 | 4.2%(-1.36)#15,871 |
| 79. | Greene | 2.8% | 3.9%(-1.10)#79 | 4.2%(-1.42)#16,115 |
| 80. | Houlton | 2.8% | 3.9%(-1.11)#80 | 4.2%(-1.43)#16,168 |
| 81. | Biddeford | 2.8% | 3.9%(-1.16)#81 | 4.2%(-1.48)#16,327 |
| 82. | Kittery | 2.7% | 3.9%(-1.22)#82 | 4.2%(-1.54)#16,577 |
| 83. | Casco | 2.6% | 3.9%(-1.29)#83 | 4.2%(-1.61)#16,785 |
| 84. | Kennebunk | 2.6% | 3.9%(-1.32)#84 | 4.2%(-1.64)#16,915 |
| 85. | Van Buren | 2.6% | 3.9%(-1.33)#85 | 4.2%(-1.65)#16,955 |
| 86. | Bath | 2.6% | 3.9%(-1.36)#86 | 4.2%(-1.68)#17,081 |
| 87. | Pittsfield | 2.5% | 3.9%(-1.40)#87 | 4.2%(-1.72)#17,208 |
| 88. | Rockland | 2.5% | 3.9%(-1.41)#88 | 4.2%(-1.72)#17,217 |
| 89. | Brewer | 2.5% | 3.9%(-1.41)#89 | 4.2%(-1.73)#17,247 |
| 90. | South Portland | 2.4% | 3.9%(-1.55)#90 | 4.2%(-1.87)#17,752 |
| 91. | Bethel | 2.3% | 3.9%(-1.60)#91 | 4.2%(-1.92)#17,937 |
| 92. | Dixfield | 2.3% | 3.9%(-1.60)#92 | 4.2%(-1.92)#17,958 |
| 93. | Ellsworth | 2.3% | 3.9%(-1.61)#93 | 4.2%(-1.93)#17,992 |
| 94. | South Eliot | 2.3% | 3.9%(-1.64)#94 | 4.2%(-1.96)#18,077 |
| 95. | Oakland | 2.2% | 3.9%(-1.72)#95 | 4.2%(-2.04)#18,356 |
| 96. | Mapleton | 2.2% | 3.9%(-1.75)#96 | 4.2%(-2.07)#18,466 |
| 97. | Northeast Harbor | 2.1% | 3.9%(-1.87)#97 | 4.2%(-2.18)#18,912 |
| 98. | Sanford | 1.9% | 3.9%(-2.04)#98 | 4.2%(-2.36)#19,479 |
| 99. | Calais | 1.9% | 3.9%(-2.05)#99 | 4.2%(-2.37)#19,531 |
| 100. | Madison | 1.8% | 3.9%(-2.09)#100 | 4.2%(-2.41)#19,662 |
1
2Common Questions
What are the Top 10 Cities with the Highest Percentage of State Government Employees in Maine?
Top 10 Cities with the Highest Percentage of State Government Employees in Maine are:
What city has the Highest Percentage of State Government Employees in Maine?
Guilford has the Highest Percentage of State Government Employees in Maine with 17.9%.
What is the Percentage of State Government Employees in the State of Maine?
Percentage of State Government Employees in Maine is 3.9%.
What is the Percentage of State Government Employees in the United States?
Percentage of State Government Employees in the United States is 4.2%.