Cities with the Highest Percentage of State Government Employees in Kentucky
RELATED REPORTS & OPTIONS
State Government Employees
Kentucky
Compare Cities
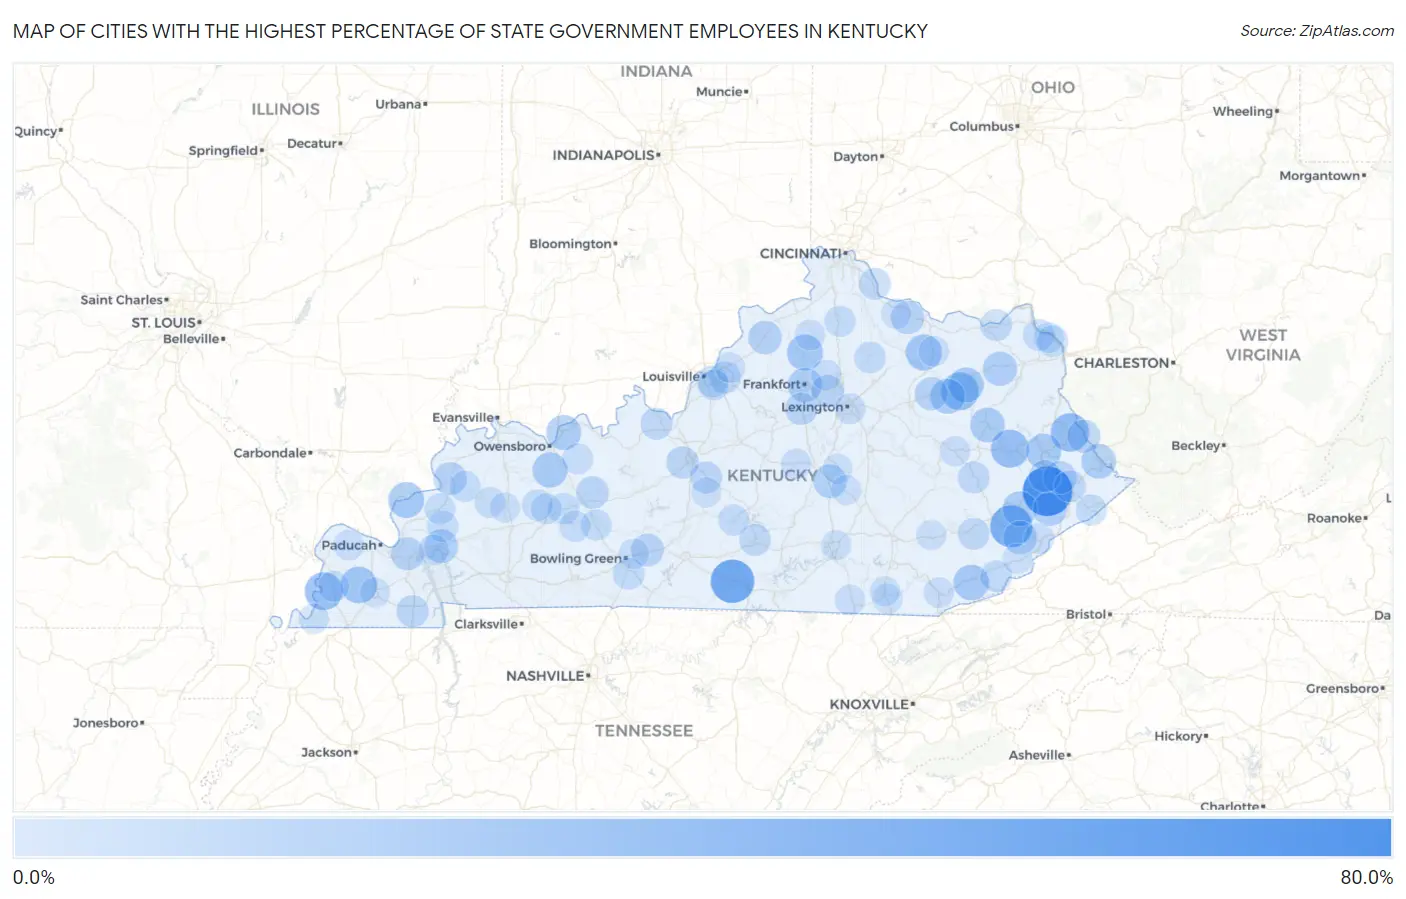
Map of Cities with the Highest Percentage of State Government Employees in Kentucky
0.0%
80.0%
Cities with the Highest Percentage of State Government Employees in Kentucky
| City | % State Government Employees | vs State | vs National | |
| 1. | Mcdowell | 69.8% | 5.5%(+64.3)#1 | 4.2%(+65.6)#51 |
| 2. | Marrowbone | 50.0% | 5.5%(+44.5)#2 | 4.2%(+45.8)#127 |
| 3. | Vicco | 45.7% | 5.5%(+40.1)#3 | 4.2%(+41.4)#161 |
| 4. | Inez | 33.8% | 5.5%(+28.3)#4 | 4.2%(+29.6)#320 |
| 5. | Salyersville | 32.2% | 5.5%(+26.7)#5 | 4.2%(+28.0)#373 |
| 6. | Columbus | 31.9% | 5.5%(+26.4)#6 | 4.2%(+27.7)#385 |
| 7. | Lakeview Heights | 31.1% | 5.5%(+25.6)#7 | 4.2%(+26.9)#405 |
| 8. | Fancy Farm | 27.8% | 5.5%(+22.2)#8 | 4.2%(+23.5)#532 |
| 9. | Elizaville | 26.2% | 5.5%(+20.7)#9 | 4.2%(+21.9)#604 |
| 10. | Monterey | 25.6% | 5.5%(+20.1)#10 | 4.2%(+21.3)#636 |
| 11. | Carrsville | 25.0% | 5.5%(+19.5)#11 | 4.2%(+20.8)#669 |
| 12. | South Wallins | 24.4% | 5.5%(+18.9)#12 | 4.2%(+20.1)#714 |
| 13. | Auxier | 23.2% | 5.5%(+17.6)#13 | 4.2%(+18.9)#785 |
| 14. | Morehead | 22.7% | 5.5%(+17.2)#14 | 4.2%(+18.5)#810 |
| 15. | Utica | 22.6% | 5.5%(+17.1)#15 | 4.2%(+18.4)#818 |
| 16. | Maceo | 22.2% | 5.5%(+16.7)#16 | 4.2%(+18.0)#852 |
| 17. | Salt Lick | 22.1% | 5.5%(+16.6)#17 | 4.2%(+17.9)#870 |
| 18. | Hindman | 21.7% | 5.5%(+16.2)#18 | 4.2%(+17.5)#899 |
| 19. | West Liberty | 21.7% | 5.5%(+16.2)#19 | 4.2%(+17.5)#905 |
| 20. | South Williamson | 21.5% | 5.5%(+16.0)#20 | 4.2%(+17.3)#928 |
| 21. | Frankfort | 20.2% | 5.5%(+14.7)#21 | 4.2%(+16.0)#1,050 |
| 22. | Wheelwright | 19.9% | 5.5%(+14.4)#22 | 4.2%(+15.6)#1,091 |
| 23. | Olive Hill | 19.8% | 5.5%(+14.3)#23 | 4.2%(+15.5)#1,100 |
| 24. | Yelvington | 18.7% | 5.5%(+13.2)#24 | 4.2%(+14.5)#1,220 |
| 25. | Eddyville | 18.6% | 5.5%(+13.1)#25 | 4.2%(+14.4)#1,228 |
| 26. | Stanford | 18.5% | 5.5%(+12.9)#26 | 4.2%(+14.2)#1,248 |
| 27. | Blackey | 18.2% | 5.5%(+12.7)#27 | 4.2%(+13.9)#1,294 |
| 28. | Campbellsburg | 17.9% | 5.5%(+12.4)#28 | 4.2%(+13.7)#1,334 |
| 29. | Germantown | 17.2% | 5.5%(+11.7)#29 | 4.2%(+13.0)#1,439 |
| 30. | Sturgis | 16.9% | 5.5%(+11.3)#30 | 4.2%(+12.6)#1,505 |
| 31. | Betsy Layne | 16.7% | 5.5%(+11.2)#31 | 4.2%(+12.5)#1,526 |
| 32. | Calvert City | 16.7% | 5.5%(+11.1)#32 | 4.2%(+12.4)#1,538 |
| 33. | Warfield | 16.7% | 5.5%(+11.1)#33 | 4.2%(+12.4)#1,548 |
| 34. | Owingsville | 16.4% | 5.5%(+10.8)#34 | 4.2%(+12.1)#1,613 |
| 35. | Oakland | 15.6% | 5.5%(+10.1)#35 | 4.2%(+11.4)#1,762 |
| 36. | Midway | 15.4% | 5.5%(+9.91)#36 | 4.2%(+11.2)#1,818 |
| 37. | Rosine | 15.1% | 5.5%(+9.57)#37 | 4.2%(+10.9)#1,891 |
| 38. | West Van Lear | 14.8% | 5.5%(+9.30)#38 | 4.2%(+10.6)#1,956 |
| 39. | Pleasant Ridge | 14.2% | 5.5%(+8.68)#39 | 4.2%(+9.97)#2,167 |
| 40. | Cecilia | 14.1% | 5.5%(+8.56)#40 | 4.2%(+9.84)#2,206 |
| 41. | Lawrenceburg | 14.1% | 5.5%(+8.55)#41 | 4.2%(+9.83)#2,214 |
| 42. | Martin | 13.7% | 5.5%(+8.18)#42 | 4.2%(+9.47)#2,325 |
| 43. | Hodgenville | 13.5% | 5.5%(+7.96)#43 | 4.2%(+9.24)#2,390 |
| 44. | Murray | 13.4% | 5.5%(+7.86)#44 | 4.2%(+9.15)#2,424 |
| 45. | Wildwood | 13.0% | 5.5%(+7.44)#45 | 4.2%(+8.72)#2,578 |
| 46. | Jackson | 12.9% | 5.5%(+7.40)#46 | 4.2%(+8.69)#2,590 |
| 47. | Garrison | 12.7% | 5.5%(+7.20)#47 | 4.2%(+8.48)#2,665 |
| 48. | Pikeville | 12.4% | 5.5%(+6.90)#48 | 4.2%(+8.18)#2,795 |
| 49. | Columbia | 12.4% | 5.5%(+6.90)#49 | 4.2%(+8.18)#2,796 |
| 50. | Mentor | 12.4% | 5.5%(+6.87)#50 | 4.2%(+8.15)#2,806 |
| 51. | Ekron | 12.3% | 5.5%(+6.82)#51 | 4.2%(+8.10)#2,827 |
| 52. | Hyden | 12.3% | 5.5%(+6.76)#52 | 4.2%(+8.05)#2,853 |
| 53. | Evarts | 12.2% | 5.5%(+6.68)#53 | 4.2%(+7.97)#2,886 |
| 54. | Plano | 12.0% | 5.5%(+6.52)#54 | 4.2%(+7.80)#2,956 |
| 55. | Greenup | 12.0% | 5.5%(+6.45)#55 | 4.2%(+7.74)#2,987 |
| 56. | Bellefonte | 11.8% | 5.5%(+6.26)#56 | 4.2%(+7.55)#3,074 |
| 57. | Cynthiana | 11.6% | 5.5%(+6.05)#57 | 4.2%(+7.33)#3,185 |
| 58. | Strathmoor Manor | 11.2% | 5.5%(+5.67)#58 | 4.2%(+6.96)#3,377 |
| 59. | Fredonia | 11.2% | 5.5%(+5.63)#59 | 4.2%(+6.92)#3,395 |
| 60. | Rockport | 11.1% | 5.5%(+5.58)#60 | 4.2%(+6.87)#3,434 |
| 61. | Knottsville | 11.1% | 5.5%(+5.58)#61 | 4.2%(+6.87)#3,440 |
| 62. | Greensburg | 10.6% | 5.5%(+5.07)#62 | 4.2%(+6.36)#3,740 |
| 63. | Williamstown | 10.5% | 5.5%(+4.97)#63 | 4.2%(+6.26)#3,794 |
| 64. | Bremen | 10.4% | 5.5%(+4.84)#64 | 4.2%(+6.13)#3,873 |
| 65. | Morgantown | 10.4% | 5.5%(+4.83)#65 | 4.2%(+6.12)#3,878 |
| 66. | Wheatcroft | 10.3% | 5.5%(+4.82)#66 | 4.2%(+6.10)#3,887 |
| 67. | Elkhorn City | 10.2% | 5.5%(+4.69)#67 | 4.2%(+5.97)#3,964 |
| 68. | Rochester | 10.1% | 5.5%(+4.58)#68 | 4.2%(+5.87)#4,030 |
| 69. | Whitesville | 9.9% | 5.5%(+4.37)#69 | 4.2%(+5.66)#4,164 |
| 70. | South Carrollton | 9.8% | 5.5%(+4.28)#70 | 4.2%(+5.56)#4,232 |
| 71. | Arlington | 9.8% | 5.5%(+4.25)#71 | 4.2%(+5.54)#4,246 |
| 72. | Lexington | 9.6% | 5.5%(+4.12)#72 | 4.2%(+5.40)#4,343 |
| 73. | Nebo | 9.6% | 5.5%(+4.09)#73 | 4.2%(+5.37)#4,362 |
| 74. | West Buechel | 9.6% | 5.5%(+4.03)#74 | 4.2%(+5.32)#4,410 |
| 75. | Marion | 9.3% | 5.5%(+3.78)#75 | 4.2%(+5.07)#4,586 |
| 76. | Kevil | 9.0% | 5.5%(+3.52)#76 | 4.2%(+4.81)#4,777 |
| 77. | Owenton | 8.9% | 5.5%(+3.35)#77 | 4.2%(+4.64)#4,906 |
| 78. | Stearns | 8.7% | 5.5%(+3.14)#78 | 4.2%(+4.43)#5,077 |
| 79. | Stamping Ground | 8.7% | 5.5%(+3.13)#79 | 4.2%(+4.42)#5,087 |
| 80. | Flemingsburg | 8.6% | 5.5%(+3.04)#80 | 4.2%(+4.32)#5,171 |
| 81. | Whitesburg | 8.5% | 5.5%(+2.98)#81 | 4.2%(+4.26)#5,220 |
| 82. | Perryville | 8.5% | 5.5%(+2.96)#82 | 4.2%(+4.24)#5,251 |
| 83. | Kuttawa | 8.5% | 5.5%(+2.93)#83 | 4.2%(+4.22)#5,271 |
| 84. | Flatwoods | 8.4% | 5.5%(+2.87)#84 | 4.2%(+4.15)#5,326 |
| 85. | Campton | 8.3% | 5.5%(+2.81)#85 | 4.2%(+4.09)#5,398 |
| 86. | Pineville | 8.3% | 5.5%(+2.79)#86 | 4.2%(+4.07)#5,423 |
| 87. | Plum Springs | 8.2% | 5.5%(+2.67)#87 | 4.2%(+3.95)#5,519 |
| 88. | Hickman | 8.1% | 5.5%(+2.55)#88 | 4.2%(+3.84)#5,629 |
| 89. | Coldstream | 8.1% | 5.5%(+2.52)#89 | 4.2%(+3.81)#5,655 |
| 90. | Lancaster | 8.0% | 5.5%(+2.47)#90 | 4.2%(+3.76)#5,697 |
| 91. | Brooksville | 7.9% | 5.5%(+2.41)#91 | 4.2%(+3.69)#5,779 |
| 92. | Manchester | 7.9% | 5.5%(+2.39)#92 | 4.2%(+3.68)#5,801 |
| 93. | Magnolia | 7.9% | 5.5%(+2.39)#93 | 4.2%(+3.68)#5,803 |
| 94. | Cumberland | 7.9% | 5.5%(+2.37)#94 | 4.2%(+3.66)#5,818 |
| 95. | Emlyn | 7.8% | 5.5%(+2.24)#95 | 4.2%(+3.53)#5,953 |
| 96. | Somerset | 7.7% | 5.5%(+2.21)#96 | 4.2%(+3.50)#5,996 |
| 97. | Mayfield | 7.7% | 5.5%(+2.13)#97 | 4.2%(+3.42)#6,085 |
| 98. | Williamsburg | 7.6% | 5.5%(+2.10)#98 | 4.2%(+3.39)#6,108 |
| 99. | Crab Orchard | 7.6% | 5.5%(+2.03)#99 | 4.2%(+3.31)#6,192 |
| 100. | Madisonville | 7.5% | 5.5%(+2.02)#100 | 4.2%(+3.31)#6,196 |
Common Questions
What are the Top 10 Cities with the Highest Percentage of State Government Employees in Kentucky?
Top 10 Cities with the Highest Percentage of State Government Employees in Kentucky are:
#1
69.8%
#2
50.0%
#3
45.7%
#4
33.8%
#5
32.2%
#6
31.9%
#7
31.1%
#8
27.8%
#9
26.2%
#10
25.6%
What city has the Highest Percentage of State Government Employees in Kentucky?
McDowell has the Highest Percentage of State Government Employees in Kentucky with 69.8%.
What is the Percentage of State Government Employees in the State of Kentucky?
Percentage of State Government Employees in Kentucky is 5.5%.
What is the Percentage of State Government Employees in the United States?
Percentage of State Government Employees in the United States is 4.2%.