Cities with the Highest Percentage of Irish Population in Vermont
RELATED REPORTS & OPTIONS
Irish
Vermont
Compare Cities
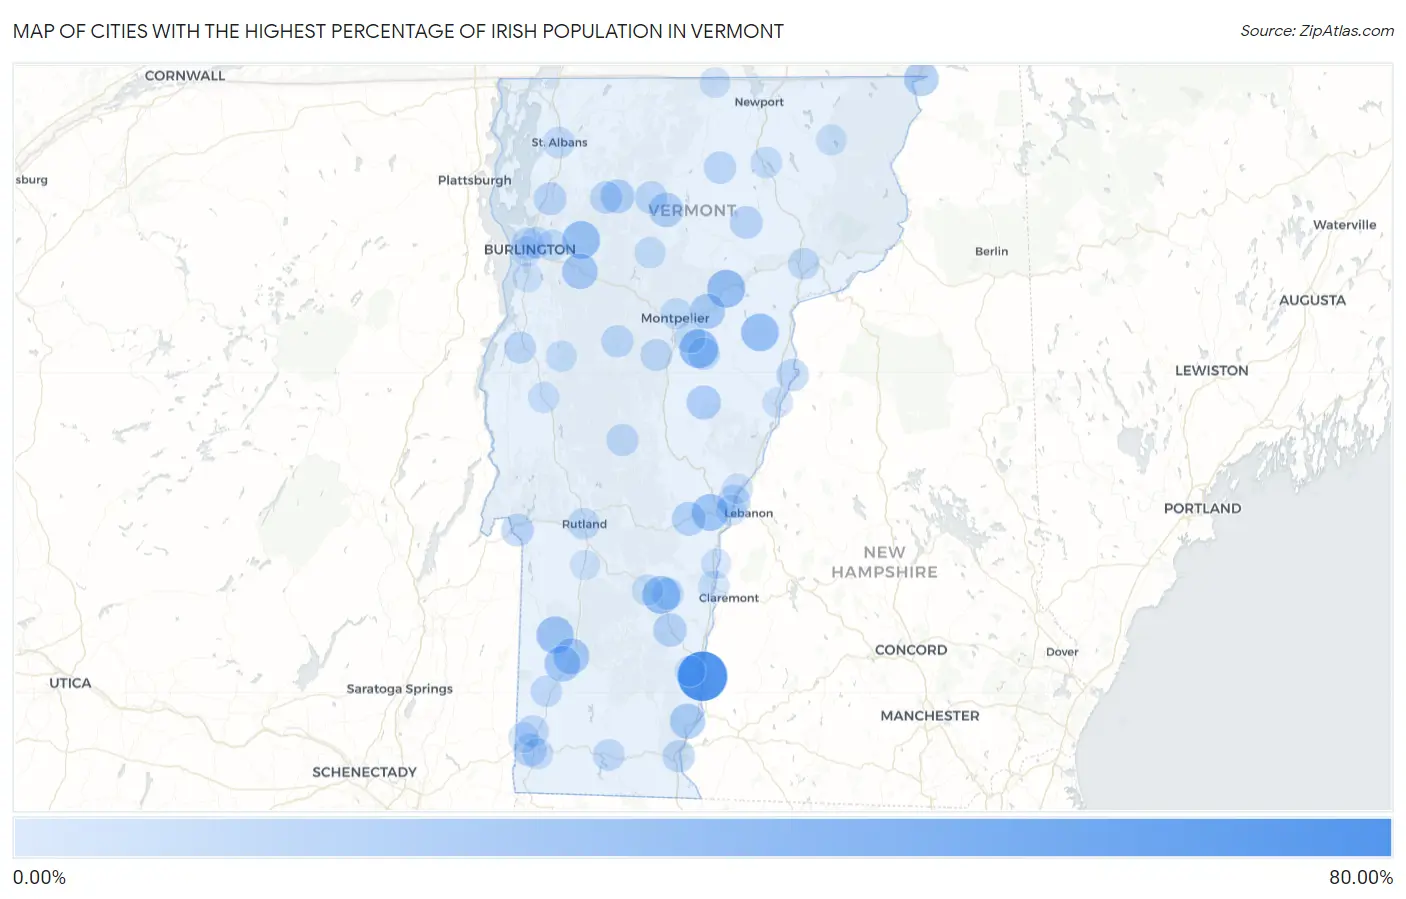
Map of Cities with the Highest Percentage of Irish Population in Vermont
0.00%
80.00%
Cities with the Highest Percentage of Irish Population in Vermont
| City | Irish | vs State | vs National | |
| 1. | North Westminster | 74.05% | 16.39%(+57.7)#1 | 9.46%(+64.6)#47 |
| 2. | Lyndon | 67.24% | 16.39%(+50.9)#2 | 9.46%(+57.8)#68 |
| 3. | Lyndon Center | 50.51% | 16.39%(+34.1)#3 | 9.46%(+41.1)#205 |
| 4. | Whitingham | 41.28% | 16.39%(+24.9)#4 | 9.46%(+31.8)#407 |
| 5. | Websterville | 39.76% | 16.39%(+23.4)#5 | 9.46%(+30.3)#468 |
| 6. | Marshfield | 37.80% | 16.39%(+21.4)#6 | 9.46%(+28.3)#549 |
| 7. | West Pawlet | 37.54% | 16.39%(+21.2)#7 | 9.46%(+28.1)#556 |
| 8. | Proctorsville | 37.05% | 16.39%(+20.7)#8 | 9.46%(+27.6)#573 |
| 9. | Jericho | 36.88% | 16.39%(+20.5)#9 | 9.46%(+27.4)#580 |
| 10. | Groton | 36.81% | 16.39%(+20.4)#10 | 9.46%(+27.3)#583 |
| 11. | Dorset | 35.29% | 16.39%(+18.9)#11 | 9.46%(+25.8)#662 |
| 12. | Jamaica | 35.29% | 16.39%(+18.9)#12 | 9.46%(+25.8)#664 |
| 13. | Quechee | 34.12% | 16.39%(+17.7)#13 | 9.46%(+24.7)#728 |
| 14. | Chittenden | 33.33% | 16.39%(+16.9)#14 | 9.46%(+23.9)#777 |
| 15. | Weston | 33.33% | 16.39%(+16.9)#15 | 9.46%(+23.9)#781 |
| 16. | Gilman | 32.24% | 16.39%(+15.9)#16 | 9.46%(+22.8)#874 |
| 17. | Manchester Center | 31.44% | 16.39%(+15.1)#17 | 9.46%(+22.0)#954 |
| 18. | Manchester | 30.87% | 16.39%(+14.5)#18 | 9.46%(+21.4)#1,018 |
| 19. | Richmond | 30.04% | 16.39%(+13.7)#19 | 9.46%(+20.6)#1,120 |
| 20. | Putney | 29.44% | 16.39%(+13.1)#20 | 9.46%(+20.0)#1,203 |
| 21. | Plainfield | 29.07% | 16.39%(+12.7)#21 | 9.46%(+19.6)#1,255 |
| 22. | Beecher Falls | 27.72% | 16.39%(+11.3)#22 | 9.46%(+18.3)#1,473 |
| 23. | Hartford | 27.35% | 16.39%(+11.0)#23 | 9.46%(+17.9)#1,528 |
| 24. | Hyde Park | 27.25% | 16.39%(+10.9)#24 | 9.46%(+17.8)#1,546 |
| 25. | Chelsea | 26.34% | 16.39%(+9.95)#25 | 9.46%(+16.9)#1,724 |
| 26. | Castleton Four Corners | 25.90% | 16.39%(+9.51)#26 | 9.46%(+16.4)#1,831 |
| 27. | Jeffersonville | 25.58% | 16.39%(+9.19)#27 | 9.46%(+16.1)#1,894 |
| 28. | Woodstock | 25.17% | 16.39%(+8.78)#28 | 9.46%(+15.7)#1,973 |
| 29. | Chester | 23.88% | 16.39%(+7.49)#29 | 9.46%(+14.4)#2,311 |
| 30. | Grafton | 22.99% | 16.39%(+6.60)#30 | 9.46%(+13.5)#2,607 |
| 31. | Old Bennington | 22.36% | 16.39%(+5.97)#31 | 9.46%(+12.9)#2,811 |
| 32. | Townshend | 22.35% | 16.39%(+5.96)#32 | 9.46%(+12.9)#2,815 |
| 33. | Milton | 22.33% | 16.39%(+5.94)#33 | 9.46%(+12.9)#2,821 |
| 34. | Wilder | 22.29% | 16.39%(+5.90)#34 | 9.46%(+12.8)#2,839 |
| 35. | Greensboro Bend | 22.26% | 16.39%(+5.87)#35 | 9.46%(+12.8)#2,854 |
| 36. | Lunenburg | 21.93% | 16.39%(+5.54)#36 | 9.46%(+12.5)#2,990 |
| 37. | Fair Haven | 21.80% | 16.39%(+5.41)#37 | 9.46%(+12.3)#3,059 |
| 38. | Bolton | 21.62% | 16.39%(+5.23)#38 | 9.46%(+12.2)#3,115 |
| 39. | Albany | 21.39% | 16.39%(+5.00)#39 | 9.46%(+11.9)#3,209 |
| 40. | Newbury | 21.21% | 16.39%(+4.82)#40 | 9.46%(+11.8)#3,276 |
| 41. | Cambridge | 21.21% | 16.39%(+4.82)#41 | 9.46%(+11.8)#3,277 |
| 42. | Brattleboro | 21.16% | 16.39%(+4.77)#42 | 9.46%(+11.7)#3,299 |
| 43. | North Pownal | 21.03% | 16.39%(+4.64)#43 | 9.46%(+11.6)#3,355 |
| 44. | Proctor | 20.94% | 16.39%(+4.55)#44 | 9.46%(+11.5)#3,389 |
| 45. | Johnson | 20.94% | 16.39%(+4.55)#45 | 9.46%(+11.5)#3,393 |
| 46. | East Barre | 20.77% | 16.39%(+4.38)#46 | 9.46%(+11.3)#3,472 |
| 47. | Cavendish | 20.67% | 16.39%(+4.28)#47 | 9.46%(+11.2)#3,529 |
| 48. | Waitsfield | 20.61% | 16.39%(+4.22)#48 | 9.46%(+11.2)#3,557 |
| 49. | Stamford | 20.45% | 16.39%(+4.06)#49 | 9.46%(+11.0)#3,632 |
| 50. | Burlington | 20.44% | 16.39%(+4.05)#50 | 9.46%(+11.0)#3,638 |
| 51. | Wardsboro | 20.41% | 16.39%(+4.02)#51 | 9.46%(+11.0)#3,653 |
| 52. | Northfield | 20.21% | 16.39%(+3.82)#52 | 9.46%(+10.7)#3,749 |
| 53. | South Shaftsbury | 20.14% | 16.39%(+3.75)#53 | 9.46%(+10.7)#3,776 |
| 54. | Rochester | 19.93% | 16.39%(+3.54)#54 | 9.46%(+10.5)#3,906 |
| 55. | Vergennes | 19.60% | 16.39%(+3.21)#55 | 9.46%(+10.1)#4,094 |
| 56. | Wilmington | 19.48% | 16.39%(+3.09)#56 | 9.46%(+10.0)#4,160 |
| 57. | Underhill Flats | 19.38% | 16.39%(+2.99)#57 | 9.46%(+9.93)#4,215 |
| 58. | Rutland | 19.35% | 16.39%(+2.96)#58 | 9.46%(+9.89)#4,243 |
| 59. | Lincoln | 19.31% | 16.39%(+2.92)#59 | 9.46%(+9.85)#4,268 |
| 60. | Winooski | 18.86% | 16.39%(+2.47)#60 | 9.46%(+9.40)#4,547 |
| 61. | Pownal Center | 18.69% | 16.39%(+2.30)#61 | 9.46%(+9.23)#4,677 |
| 62. | Huntington Center | 18.64% | 16.39%(+2.25)#62 | 9.46%(+9.19)#4,699 |
| 63. | Arlington | 18.64% | 16.39%(+2.25)#63 | 9.46%(+9.18)#4,707 |
| 64. | West Woodstock | 18.64% | 16.39%(+2.25)#64 | 9.46%(+9.18)#4,710 |
| 65. | St Johnsbury | 18.63% | 16.39%(+2.24)#65 | 9.46%(+9.17)#4,711 |
| 66. | Algiers | 18.58% | 16.39%(+2.19)#66 | 9.46%(+9.13)#4,734 |
| 67. | St Albans | 18.47% | 16.39%(+2.08)#67 | 9.46%(+9.02)#4,805 |
| 68. | Barre | 18.31% | 16.39%(+1.92)#68 | 9.46%(+8.85)#4,924 |
| 69. | Montpelier | 18.22% | 16.39%(+1.83)#69 | 9.46%(+8.76)#4,981 |
| 70. | Wolcott | 18.13% | 16.39%(+1.74)#70 | 9.46%(+8.67)#5,043 |
| 71. | Barton | 18.00% | 16.39%(+1.61)#71 | 9.46%(+8.54)#5,125 |
| 72. | Westford | 17.73% | 16.39%(+1.34)#72 | 9.46%(+8.28)#5,311 |
| 73. | Stowe | 17.61% | 16.39%(+1.22)#73 | 9.46%(+8.16)#5,391 |
| 74. | North Hyde Park | 17.47% | 16.39%(+1.08)#74 | 9.46%(+8.01)#5,500 |
| 75. | Ludlow | 17.44% | 16.39%(+1.05)#75 | 9.46%(+7.98)#5,526 |
| 76. | Essex Junction | 17.42% | 16.39%(+1.03)#76 | 9.46%(+7.97)#5,539 |
| 77. | Bristol | 17.38% | 16.39%(+0.993)#77 | 9.46%(+7.92)#5,571 |
| 78. | St. George | 17.30% | 16.39%(+0.914)#78 | 9.46%(+7.85)#5,630 |
| 79. | Ascutney | 17.25% | 16.39%(+0.860)#79 | 9.46%(+7.79)#5,683 |
| 80. | Middletown Springs | 16.99% | 16.39%(+0.604)#80 | 9.46%(+7.54)#5,881 |
| 81. | Peacham | 16.96% | 16.39%(+0.575)#81 | 9.46%(+7.51)#5,912 |
| 82. | Bennington | 16.93% | 16.39%(+0.542)#82 | 9.46%(+7.47)#5,949 |
| 83. | Saxtons River | 16.90% | 16.39%(+0.514)#83 | 9.46%(+7.45)#5,967 |
| 84. | Middlebury | 16.79% | 16.39%(+0.405)#84 | 9.46%(+7.34)#6,049 |
| 85. | White River Junction | 16.56% | 16.39%(+0.168)#85 | 9.46%(+7.10)#6,241 |
| 86. | Island Pond | 16.47% | 16.39%(+0.079)#86 | 9.46%(+7.01)#6,322 |
| 87. | Danby | 16.29% | 16.39%(-0.098)#87 | 9.46%(+6.83)#6,484 |
| 88. | East Dorset | 16.21% | 16.39%(-0.184)#88 | 9.46%(+6.75)#6,582 |
| 89. | Huntington | 16.13% | 16.39%(-0.261)#89 | 9.46%(+6.67)#6,647 |
| 90. | North Bennington | 16.06% | 16.39%(-0.333)#90 | 9.46%(+6.60)#6,714 |
| 91. | North Clarendon | 16.04% | 16.39%(-0.352)#91 | 9.46%(+6.58)#6,734 |
| 92. | Bolton Valley | 15.76% | 16.39%(-0.632)#92 | 9.46%(+6.30)#7,004 |
| 93. | North Troy | 15.75% | 16.39%(-0.636)#93 | 9.46%(+6.30)#7,008 |
| 94. | Norwich | 15.38% | 16.39%(-1.01)#94 | 9.46%(+5.92)#7,387 |
| 95. | Windsor | 15.25% | 16.39%(-1.14)#95 | 9.46%(+5.79)#7,506 |
| 96. | Bradford | 14.94% | 16.39%(-1.45)#96 | 9.46%(+5.48)#7,849 |
| 97. | South Burlington | 14.77% | 16.39%(-1.62)#97 | 9.46%(+5.31)#8,044 |
| 98. | Wallingford | 14.38% | 16.39%(-2.01)#98 | 9.46%(+4.92)#8,492 |
| 99. | Shelburne | 14.17% | 16.39%(-2.22)#99 | 9.46%(+4.72)#8,744 |
| 100. | South Londonderry | 14.02% | 16.39%(-2.37)#100 | 9.46%(+4.56)#8,945 |
1
2Common Questions
What are the Top 10 Cities with the Highest Percentage of Irish Population in Vermont?
Top 10 Cities with the Highest Percentage of Irish Population in Vermont are:
#1
74.05%
#2
39.76%
#3
37.80%
#4
37.05%
#5
36.88%
#6
36.81%
#7
35.29%
#8
34.12%
#9
31.44%
#10
30.87%
What city has the Highest Percentage of Irish Population in Vermont?
North Westminster has the Highest Percentage of Irish Population in Vermont with 74.05%.
What is the Percentage of Irish Population in the State of Vermont?
Percentage of Irish Population in Vermont is 16.39%.
What is the Percentage of Irish Population in the United States?
Percentage of Irish Population in the United States is 9.46%.