Cities with the Highest Percentage of Irish Population in Connecticut
RELATED REPORTS & OPTIONS
Irish
Connecticut
Compare Cities
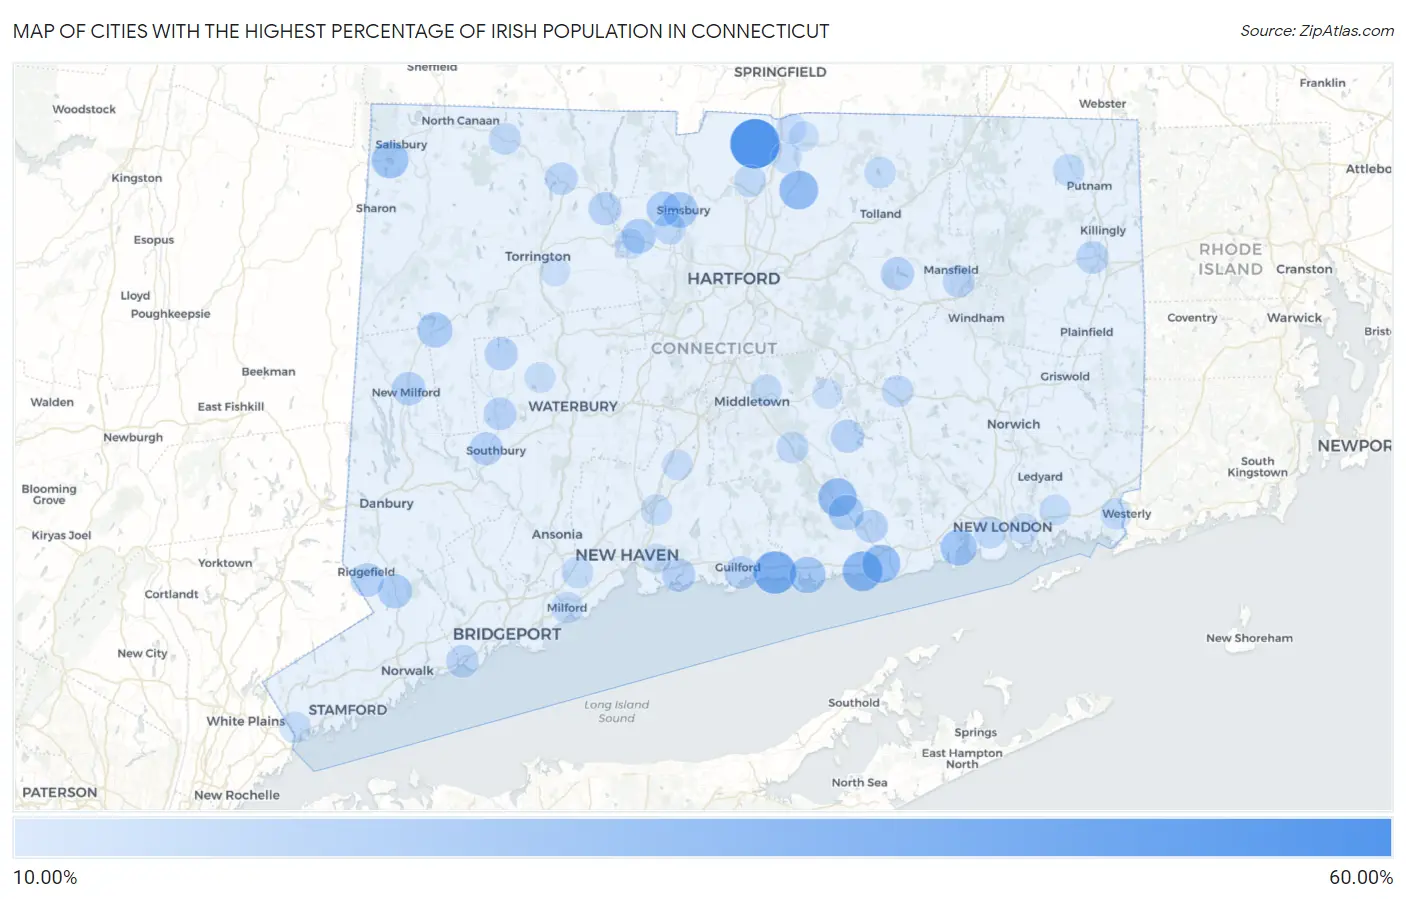
Map of Cities with the Highest Percentage of Irish Population in Connecticut
0.00%
60.00%
Cities with the Highest Percentage of Irish Population in Connecticut
| City | Irish | vs State | vs National | |
| 1. | Candlewood Shores | 55.05% | 14.37%(+40.7)#1 | 9.46%(+45.6)#151 |
| 2. | Suffield Depot | 53.23% | 14.37%(+38.9)#2 | 9.46%(+43.8)#174 |
| 3. | Lake Bungee | 46.99% | 14.37%(+32.6)#3 | 9.46%(+37.5)#278 |
| 4. | West Mountain | 41.13% | 14.37%(+26.8)#4 | 9.46%(+31.7)#414 |
| 5. | Chimney Point | 40.57% | 14.37%(+26.2)#5 | 9.46%(+31.1)#434 |
| 6. | Mill Plain | 40.30% | 14.37%(+25.9)#6 | 9.46%(+30.8)#442 |
| 7. | Madison Center | 40.10% | 14.37%(+25.7)#7 | 9.46%(+30.6)#449 |
| 8. | Groton Long Point Borough | 39.26% | 14.37%(+24.9)#8 | 9.46%(+29.8)#481 |
| 9. | Hawleyville | 38.00% | 14.37%(+23.6)#9 | 9.46%(+28.5)#536 |
| 10. | Riverton | 35.54% | 14.37%(+21.2)#10 | 9.46%(+26.1)#646 |
| 11. | Saybrook Manor | 34.93% | 14.37%(+20.6)#11 | 9.46%(+25.5)#678 |
| 12. | Broad Brook | 33.47% | 14.37%(+19.1)#12 | 9.46%(+24.0)#771 |
| 13. | Chester Center | 32.62% | 14.37%(+18.2)#13 | 9.46%(+23.2)#837 |
| 14. | Plattsville | 32.53% | 14.37%(+18.2)#14 | 9.46%(+23.1)#846 |
| 15. | Candlewood Orchards | 32.52% | 14.37%(+18.1)#15 | 9.46%(+23.1)#847 |
| 16. | Old Saybrook Center | 31.93% | 14.37%(+17.6)#16 | 9.46%(+22.5)#904 |
| 17. | Ball Pond | 30.54% | 14.37%(+16.2)#17 | 9.46%(+21.1)#1,061 |
| 18. | Lakeville | 29.57% | 14.37%(+15.2)#18 | 9.46%(+20.1)#1,181 |
| 19. | Niantic | 28.77% | 14.37%(+14.4)#19 | 9.46%(+19.3)#1,295 |
| 20. | Clinton | 28.65% | 14.37%(+14.3)#20 | 9.46%(+19.2)#1,312 |
| 21. | Woodmont Borough | 28.54% | 14.37%(+14.2)#21 | 9.46%(+19.1)#1,328 |
| 22. | Brookfield Center | 28.24% | 14.37%(+13.9)#22 | 9.46%(+18.8)#1,375 |
| 23. | Lordship | 27.87% | 14.37%(+13.5)#23 | 9.46%(+18.4)#1,450 |
| 24. | Knollcrest | 27.81% | 14.37%(+13.4)#24 | 9.46%(+18.4)#1,458 |
| 25. | Gaylordsville | 27.51% | 14.37%(+13.1)#25 | 9.46%(+18.1)#1,502 |
| 26. | Simsbury Center | 27.32% | 14.37%(+12.9)#26 | 9.46%(+17.9)#1,530 |
| 27. | New Preston | 26.71% | 14.37%(+12.3)#27 | 9.46%(+17.2)#1,640 |
| 28. | Ridgebury | 26.66% | 14.37%(+12.3)#28 | 9.46%(+17.2)#1,653 |
| 29. | Cornwall Bridge | 26.64% | 14.37%(+12.3)#29 | 9.46%(+17.2)#1,660 |
| 30. | Noroton Heights | 26.58% | 14.37%(+12.2)#30 | 9.46%(+17.1)#1,673 |
| 31. | Deep River Center | 26.56% | 14.37%(+12.2)#31 | 9.46%(+17.1)#1,680 |
| 32. | Inglenook | 26.16% | 14.37%(+11.8)#32 | 9.46%(+16.7)#1,769 |
| 33. | Stepney | 26.08% | 14.37%(+11.7)#33 | 9.46%(+16.6)#1,794 |
| 34. | Tokeneke | 26.02% | 14.37%(+11.6)#34 | 9.46%(+16.6)#1,803 |
| 35. | Newtown Borough | 25.93% | 14.37%(+11.6)#35 | 9.46%(+16.5)#1,822 |
| 36. | Canton Valley | 25.74% | 14.37%(+11.4)#36 | 9.46%(+16.3)#1,866 |
| 37. | Candlewood Knolls | 25.29% | 14.37%(+10.9)#37 | 9.46%(+15.8)#1,948 |
| 38. | West Simsbury | 25.18% | 14.37%(+10.8)#38 | 9.46%(+15.7)#1,970 |
| 39. | Georgetown | 25.00% | 14.37%(+10.6)#39 | 9.46%(+15.5)#2,005 |
| 40. | Fenwick Borough | 25.00% | 14.37%(+10.6)#40 | 9.46%(+15.5)#2,023 |
| 41. | Lake Chaffee | 24.58% | 14.37%(+10.2)#41 | 9.46%(+15.1)#2,126 |
| 42. | Daniels Farm | 24.54% | 14.37%(+10.2)#42 | 9.46%(+15.1)#2,135 |
| 43. | Sandy Hook | 24.51% | 14.37%(+10.1)#43 | 9.46%(+15.1)#2,140 |
| 44. | Fairfield University | 24.46% | 14.37%(+10.1)#44 | 9.46%(+15.0)#2,154 |
| 45. | Redding Center | 24.42% | 14.37%(+10.0)#45 | 9.46%(+15.0)#2,165 |
| 46. | Indian Field | 24.39% | 14.37%(+10.0)#46 | 9.46%(+14.9)#2,173 |
| 47. | New Milford | 23.99% | 14.37%(+9.61)#47 | 9.46%(+14.5)#2,280 |
| 48. | Ridgefield | 23.98% | 14.37%(+9.61)#48 | 9.46%(+14.5)#2,281 |
| 49. | New Canaan | 23.84% | 14.37%(+9.46)#49 | 9.46%(+14.4)#2,322 |
| 50. | Branford Center | 23.46% | 14.37%(+9.09)#50 | 9.46%(+14.0)#2,437 |
| 51. | Coventry Lake | 23.41% | 14.37%(+9.03)#51 | 9.46%(+14.0)#2,455 |
| 52. | Heritage Village | 23.28% | 14.37%(+8.91)#52 | 9.46%(+13.8)#2,502 |
| 53. | Bethlehem Village | 23.20% | 14.37%(+8.83)#53 | 9.46%(+13.7)#2,527 |
| 54. | Moodus | 23.17% | 14.37%(+8.79)#54 | 9.46%(+13.7)#2,542 |
| 55. | New Hartford Center | 23.17% | 14.37%(+8.79)#55 | 9.46%(+13.7)#2,543 |
| 56. | Essex Village | 22.94% | 14.37%(+8.56)#56 | 9.46%(+13.5)#2,622 |
| 57. | Stonington Borough | 22.72% | 14.37%(+8.34)#57 | 9.46%(+13.3)#2,694 |
| 58. | Guilford Center | 22.63% | 14.37%(+8.25)#58 | 9.46%(+13.2)#2,716 |
| 59. | Woodbury Center | 22.42% | 14.37%(+8.05)#59 | 9.46%(+13.0)#2,788 |
| 60. | Lakeside Woods | 22.39% | 14.37%(+8.01)#60 | 9.46%(+12.9)#2,800 |
| 61. | East Brooklyn | 22.33% | 14.37%(+7.96)#61 | 9.46%(+12.9)#2,822 |
| 62. | Taylor Corners | 22.26% | 14.37%(+7.89)#62 | 9.46%(+12.8)#2,856 |
| 63. | Southport | 22.24% | 14.37%(+7.87)#63 | 9.46%(+12.8)#2,865 |
| 64. | Winsted | 22.12% | 14.37%(+7.75)#64 | 9.46%(+12.7)#2,917 |
| 65. | Darien Downtown | 22.09% | 14.37%(+7.72)#65 | 9.46%(+12.6)#2,925 |
| 66. | Rock Ridge | 22.01% | 14.37%(+7.64)#66 | 9.46%(+12.6)#2,963 |
| 67. | East | 21.84% | 14.37%(+7.47)#67 | 9.46%(+12.4)#3,031 |
| 68. | Sacred Heart University | 21.51% | 14.37%(+7.14)#68 | 9.46%(+12.1)#3,163 |
| 69. | Mansfield Center | 21.47% | 14.37%(+7.09)#69 | 9.46%(+12.0)#3,176 |
| 70. | Northford | 21.38% | 14.37%(+7.00)#70 | 9.46%(+11.9)#3,214 |
| 71. | Windsor Locks | 20.92% | 14.37%(+6.54)#71 | 9.46%(+11.5)#3,403 |
| 72. | Norfolk | 20.86% | 14.37%(+6.48)#72 | 9.46%(+11.4)#3,423 |
| 73. | Waterford | 20.85% | 14.37%(+6.47)#73 | 9.46%(+11.4)#3,427 |
| 74. | Pleasant Valley | 20.85% | 14.37%(+6.47)#74 | 9.46%(+11.4)#3,428 |
| 75. | Weatogue | 20.78% | 14.37%(+6.40)#75 | 9.46%(+11.3)#3,469 |
| 76. | Colchester | 20.77% | 14.37%(+6.39)#76 | 9.46%(+11.3)#3,480 |
| 77. | Higganum | 20.61% | 14.37%(+6.24)#77 | 9.46%(+11.2)#3,555 |
| 78. | South Woodstock | 20.45% | 14.37%(+6.08)#78 | 9.46%(+11.0)#3,629 |
| 79. | Milford City Balance | 20.35% | 14.37%(+5.98)#79 | 9.46%(+10.9)#3,677 |
| 80. | Orange | 20.25% | 14.37%(+5.88)#80 | 9.46%(+10.8)#3,725 |
| 81. | Crystal Lake | 20.24% | 14.37%(+5.87)#81 | 9.46%(+10.8)#3,731 |
| 82. | Pemberwick | 20.11% | 14.37%(+5.74)#82 | 9.46%(+10.7)#3,788 |
| 83. | Pawcatuck | 20.04% | 14.37%(+5.66)#83 | 9.46%(+10.6)#3,827 |
| 84. | North Haven | 19.79% | 14.37%(+5.42)#84 | 9.46%(+10.3)#3,983 |
| 85. | Portland | 19.67% | 14.37%(+5.29)#85 | 9.46%(+10.2)#4,055 |
| 86. | Old Mystic | 19.32% | 14.37%(+4.95)#86 | 9.46%(+9.86)#4,256 |
| 87. | Southwood Acres | 19.03% | 14.37%(+4.66)#87 | 9.46%(+9.58)#4,419 |
| 88. | Long Hill | 19.00% | 14.37%(+4.63)#88 | 9.46%(+9.55)#4,439 |
| 89. | Wallingford Center | 18.93% | 14.37%(+4.56)#89 | 9.46%(+9.47)#4,493 |
| 90. | Watertown | 18.86% | 14.37%(+4.48)#90 | 9.46%(+9.40)#4,551 |
| 91. | Oronoque | 18.75% | 14.37%(+4.37)#91 | 9.46%(+9.29)#4,639 |
| 92. | Quinnipiac University | 18.66% | 14.37%(+4.28)#92 | 9.46%(+9.20)#4,694 |
| 93. | Sherwood Manor | 18.32% | 14.37%(+3.95)#93 | 9.46%(+8.86)#4,914 |
| 94. | Poplar Plains | 18.17% | 14.37%(+3.79)#94 | 9.46%(+8.71)#5,024 |
| 95. | East Hampton | 18.04% | 14.37%(+3.66)#95 | 9.46%(+8.58)#5,099 |
| 96. | Litchfield Borough | 18.01% | 14.37%(+3.63)#96 | 9.46%(+8.55)#5,121 |
| 97. | Collinsville | 17.97% | 14.37%(+3.60)#97 | 9.46%(+8.52)#5,137 |
| 98. | Northwest Harwinton | 17.83% | 14.37%(+3.46)#98 | 9.46%(+8.38)#5,237 |
| 99. | East Haven | 17.79% | 14.37%(+3.41)#99 | 9.46%(+8.33)#5,268 |
| 100. | Hazardville | 17.74% | 14.37%(+3.36)#100 | 9.46%(+8.28)#5,306 |
Common Questions
What are the Top 10 Cities with the Highest Percentage of Irish Population in Connecticut?
Top 10 Cities with the Highest Percentage of Irish Population in Connecticut are:
#1
53.23%
#2
40.10%
#3
34.93%
#4
33.47%
#5
32.62%
#6
31.93%
#7
29.57%
#8
28.77%
#9
28.65%
#10
27.32%
What city has the Highest Percentage of Irish Population in Connecticut?
Suffield Depot has the Highest Percentage of Irish Population in Connecticut with 53.23%.
What is the Percentage of Irish Population in the State of Connecticut?
Percentage of Irish Population in Connecticut is 14.37%.
What is the Percentage of Irish Population in the United States?
Percentage of Irish Population in the United States is 9.46%.