Cities with the Highest Percentage of Irish Population in Massachusetts
RELATED REPORTS & OPTIONS
Irish
Massachusetts
Compare Cities
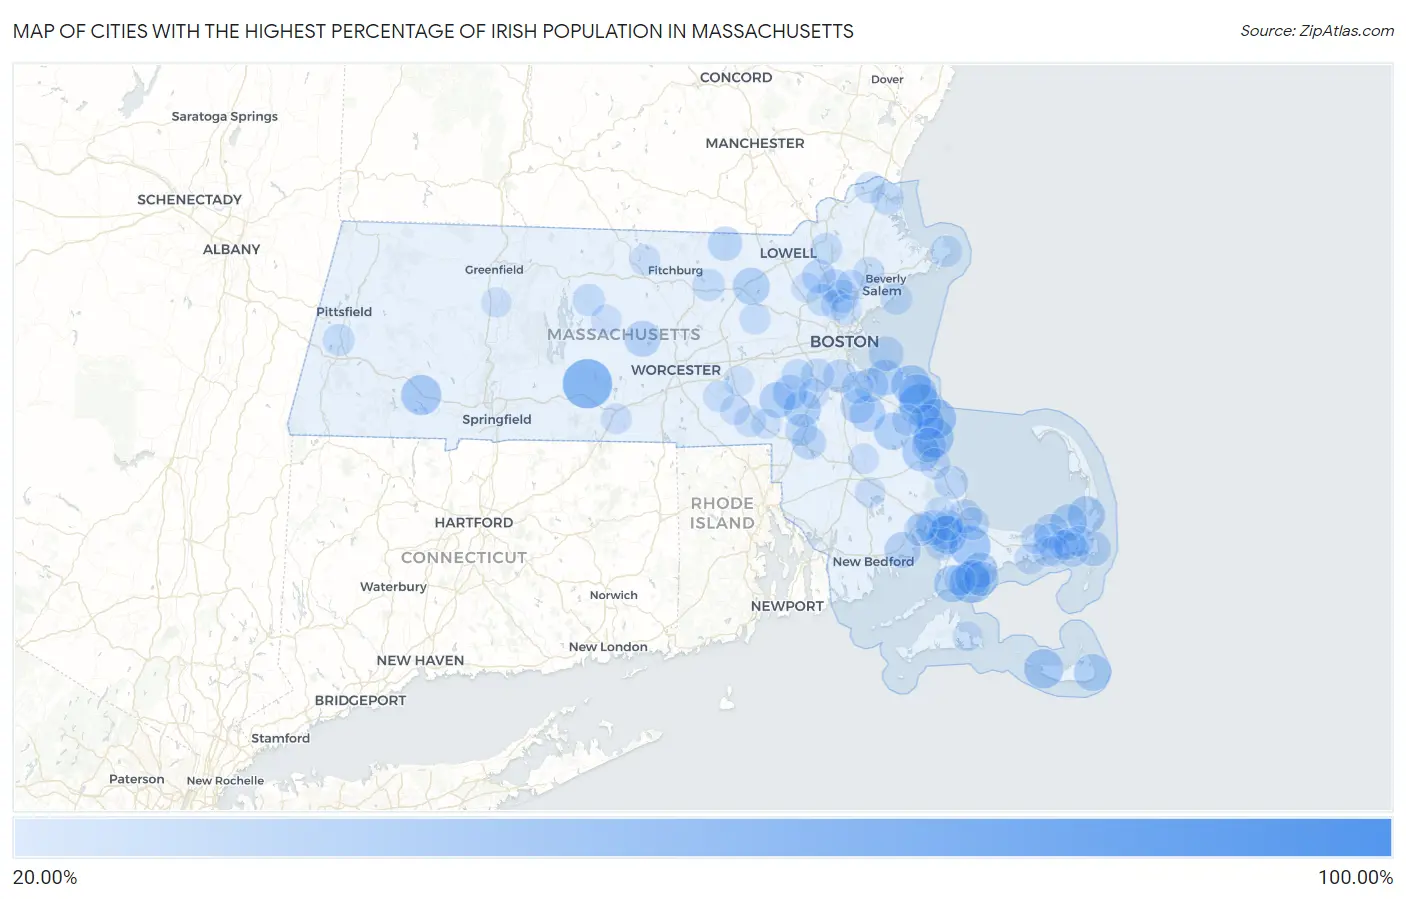
Map of Cities with the Highest Percentage of Irish Population in Massachusetts
0.00%
100.00%
Cities with the Highest Percentage of Irish Population in Massachusetts
| City | Irish | vs State | vs National | |
| 1. | Lenox Dale | 94.51% | 18.90%(+75.6)#1 | 9.46%(+85.1)#25 |
| 2. | Green Harbor | 63.20% | 18.90%(+44.3)#2 | 9.46%(+53.7)#83 |
| 3. | Warren | 61.20% | 18.90%(+42.3)#3 | 9.46%(+51.7)#98 |
| 4. | Marshfield Hills | 47.27% | 18.90%(+28.4)#4 | 9.46%(+37.8)#266 |
| 5. | Forestdale | 45.35% | 18.90%(+26.5)#5 | 9.46%(+35.9)#314 |
| 6. | Seconsett Island | 44.53% | 18.90%(+25.6)#6 | 9.46%(+35.1)#328 |
| 7. | Blandford | 43.55% | 18.90%(+24.7)#7 | 9.46%(+34.1)#353 |
| 8. | Duxbury | 43.33% | 18.90%(+24.4)#8 | 9.46%(+33.9)#358 |
| 9. | Ocean Bluff Brant Rock | 43.17% | 18.90%(+24.3)#9 | 9.46%(+33.7)#361 |
| 10. | North Scituate | 42.64% | 18.90%(+23.7)#10 | 9.46%(+33.2)#373 |
| 11. | Madaket | 42.45% | 18.90%(+23.6)#11 | 9.46%(+33.0)#376 |
| 12. | Scituate | 41.49% | 18.90%(+22.6)#12 | 9.46%(+32.0)#404 |
| 13. | Monument Beach | 40.34% | 18.90%(+21.4)#13 | 9.46%(+30.9)#440 |
| 14. | Kingston | 39.47% | 18.90%(+20.6)#14 | 9.46%(+30.0)#476 |
| 15. | Orleans | 39.16% | 18.90%(+20.3)#15 | 9.46%(+29.7)#485 |
| 16. | Siasconset | 38.26% | 18.90%(+19.4)#16 | 9.46%(+28.8)#523 |
| 17. | Teaticket | 38.05% | 18.90%(+19.2)#17 | 9.46%(+28.6)#534 |
| 18. | Hanson | 38.00% | 18.90%(+19.1)#18 | 9.46%(+28.5)#538 |
| 19. | Littleton Common | 37.94% | 18.90%(+19.0)#19 | 9.46%(+28.5)#541 |
| 20. | Walpole | 37.75% | 18.90%(+18.9)#20 | 9.46%(+28.3)#551 |
| 21. | Brewster | 36.75% | 18.90%(+17.8)#21 | 9.46%(+27.3)#586 |
| 22. | Millis Clicquot | 36.31% | 18.90%(+17.4)#22 | 9.46%(+26.9)#612 |
| 23. | Rutland | 36.09% | 18.90%(+17.2)#23 | 9.46%(+26.6)#625 |
| 24. | Mattapoisett Center | 36.07% | 18.90%(+17.2)#24 | 9.46%(+26.6)#627 |
| 25. | Abington | 36.01% | 18.90%(+17.1)#25 | 9.46%(+26.5)#629 |
| 26. | Hingham | 35.64% | 18.90%(+16.7)#26 | 9.46%(+26.2)#643 |
| 27. | Marshfield | 35.00% | 18.90%(+16.1)#27 | 9.46%(+25.5)#674 |
| 28. | Mashpee Neck | 34.80% | 18.90%(+15.9)#28 | 9.46%(+25.3)#689 |
| 29. | Seabrook | 34.62% | 18.90%(+15.7)#29 | 9.46%(+25.2)#699 |
| 30. | Medfield | 34.49% | 18.90%(+15.6)#30 | 9.46%(+25.0)#706 |
| 31. | Onset | 34.46% | 18.90%(+15.6)#31 | 9.46%(+25.0)#707 |
| 32. | East Dennis | 33.93% | 18.90%(+15.0)#32 | 9.46%(+24.5)#741 |
| 33. | Hull | 33.84% | 18.90%(+14.9)#33 | 9.46%(+24.4)#749 |
| 34. | Chatham | 33.78% | 18.90%(+14.9)#34 | 9.46%(+24.3)#754 |
| 35. | Popponesset | 33.61% | 18.90%(+14.7)#35 | 9.46%(+24.1)#764 |
| 36. | Pepperell | 33.38% | 18.90%(+14.5)#36 | 9.46%(+23.9)#773 |
| 37. | South Duxbury | 33.32% | 18.90%(+14.4)#37 | 9.46%(+23.9)#788 |
| 38. | Holbrook | 33.29% | 18.90%(+14.4)#38 | 9.46%(+23.8)#790 |
| 39. | Cedar Crest | 33.25% | 18.90%(+14.4)#39 | 9.46%(+23.8)#793 |
| 40. | Weymouth Town | 32.95% | 18.90%(+14.1)#40 | 9.46%(+23.5)#810 |
| 41. | Mansfield Center | 32.43% | 18.90%(+13.5)#41 | 9.46%(+23.0)#856 |
| 42. | Milton | 32.21% | 18.90%(+13.3)#42 | 9.46%(+22.8)#876 |
| 43. | Harwich Port | 32.10% | 18.90%(+13.2)#43 | 9.46%(+22.6)#887 |
| 44. | The Pinehills | 31.91% | 18.90%(+13.0)#44 | 9.46%(+22.5)#908 |
| 45. | Sagamore | 31.85% | 18.90%(+12.9)#45 | 9.46%(+22.4)#916 |
| 46. | Reading | 31.74% | 18.90%(+12.8)#46 | 9.46%(+22.3)#928 |
| 47. | Wilmington | 31.70% | 18.90%(+12.8)#47 | 9.46%(+22.2)#933 |
| 48. | Bourne | 31.65% | 18.90%(+12.8)#48 | 9.46%(+22.2)#937 |
| 49. | Pocasset | 31.14% | 18.90%(+12.2)#49 | 9.46%(+21.7)#987 |
| 50. | South Dennis | 30.83% | 18.90%(+11.9)#50 | 9.46%(+21.4)#1,024 |
| 51. | Sandwich | 30.70% | 18.90%(+11.8)#51 | 9.46%(+21.2)#1,040 |
| 52. | Dedham | 30.56% | 18.90%(+11.7)#52 | 9.46%(+21.1)#1,057 |
| 53. | North Attleborough | 30.49% | 18.90%(+11.6)#53 | 9.46%(+21.0)#1,066 |
| 54. | Wakefield | 30.14% | 18.90%(+11.2)#54 | 9.46%(+20.7)#1,113 |
| 55. | Newburyport | 29.64% | 18.90%(+10.7)#55 | 9.46%(+20.2)#1,172 |
| 56. | Braintree Town | 29.53% | 18.90%(+10.6)#56 | 9.46%(+20.1)#1,187 |
| 57. | Weweantic | 29.50% | 18.90%(+10.6)#57 | 9.46%(+20.0)#1,191 |
| 58. | Petersham | 29.45% | 18.90%(+10.6)#58 | 9.46%(+20.0)#1,202 |
| 59. | Shirley | 29.43% | 18.90%(+10.5)#59 | 9.46%(+20.0)#1,206 |
| 60. | Foxborough | 29.29% | 18.90%(+10.4)#60 | 9.46%(+19.8)#1,224 |
| 61. | Woburn | 29.03% | 18.90%(+10.1)#61 | 9.46%(+19.6)#1,261 |
| 62. | Harwich Center | 28.82% | 18.90%(+9.93)#62 | 9.46%(+19.4)#1,292 |
| 63. | Marblehead | 28.82% | 18.90%(+9.92)#63 | 9.46%(+19.4)#1,293 |
| 64. | Lenox | 28.71% | 18.90%(+9.82)#64 | 9.46%(+19.3)#1,301 |
| 65. | Andover | 28.20% | 18.90%(+9.30)#65 | 9.46%(+18.7)#1,380 |
| 66. | Dover | 28.18% | 18.90%(+9.29)#66 | 9.46%(+18.7)#1,383 |
| 67. | Rockport | 28.18% | 18.90%(+9.28)#67 | 9.46%(+18.7)#1,384 |
| 68. | Danvers | 28.04% | 18.90%(+9.14)#68 | 9.46%(+18.6)#1,417 |
| 69. | Bellingham | 28.02% | 18.90%(+9.12)#69 | 9.46%(+18.6)#1,422 |
| 70. | Amesbury Town | 27.74% | 18.90%(+8.84)#70 | 9.46%(+18.3)#1,470 |
| 71. | North Pembroke | 27.64% | 18.90%(+8.75)#71 | 9.46%(+18.2)#1,487 |
| 72. | Upton | 27.58% | 18.90%(+8.68)#72 | 9.46%(+18.1)#1,492 |
| 73. | White Island Shores | 27.53% | 18.90%(+8.63)#73 | 9.46%(+18.1)#1,499 |
| 74. | Maynard | 27.47% | 18.90%(+8.57)#74 | 9.46%(+18.0)#1,512 |
| 75. | East Falmouth | 27.45% | 18.90%(+8.55)#75 | 9.46%(+18.0)#1,514 |
| 76. | Plymouth | 27.40% | 18.90%(+8.50)#76 | 9.46%(+17.9)#1,521 |
| 77. | Buzzards Bay | 27.36% | 18.90%(+8.47)#77 | 9.46%(+17.9)#1,524 |
| 78. | West Yarmouth | 27.29% | 18.90%(+8.39)#78 | 9.46%(+17.8)#1,535 |
| 79. | South Ashburnham | 26.88% | 18.90%(+7.99)#79 | 9.46%(+17.4)#1,604 |
| 80. | Stoneham | 26.86% | 18.90%(+7.96)#80 | 9.46%(+17.4)#1,607 |
| 81. | Barre | 26.77% | 18.90%(+7.87)#81 | 9.46%(+17.3)#1,633 |
| 82. | Sturbridge | 26.69% | 18.90%(+7.79)#82 | 9.46%(+17.2)#1,643 |
| 83. | Melrose | 26.49% | 18.90%(+7.59)#83 | 9.46%(+17.0)#1,691 |
| 84. | Norwood | 26.39% | 18.90%(+7.49)#84 | 9.46%(+16.9)#1,706 |
| 85. | North Lakeville | 26.33% | 18.90%(+7.43)#85 | 9.46%(+16.9)#1,728 |
| 86. | West Warren | 26.27% | 18.90%(+7.37)#86 | 9.46%(+16.8)#1,739 |
| 87. | East Harwich | 26.24% | 18.90%(+7.35)#87 | 9.46%(+16.8)#1,744 |
| 88. | West Dennis | 26.21% | 18.90%(+7.31)#88 | 9.46%(+16.8)#1,755 |
| 89. | Hopedale | 26.03% | 18.90%(+7.14)#89 | 9.46%(+16.6)#1,798 |
| 90. | Yarmouth Port | 25.98% | 18.90%(+7.08)#90 | 9.46%(+16.5)#1,814 |
| 91. | Bridgewater Town | 25.92% | 18.90%(+7.02)#91 | 9.46%(+16.5)#1,828 |
| 92. | Dennis Port | 25.88% | 18.90%(+6.98)#92 | 9.46%(+16.4)#1,841 |
| 93. | Lynnfield | 25.86% | 18.90%(+6.96)#93 | 9.46%(+16.4)#1,848 |
| 94. | Hopkinton | 25.77% | 18.90%(+6.88)#94 | 9.46%(+16.3)#1,860 |
| 95. | Franklin Town | 25.76% | 18.90%(+6.86)#95 | 9.46%(+16.3)#1,861 |
| 96. | Northwest Harwich | 25.69% | 18.90%(+6.79)#96 | 9.46%(+16.2)#1,876 |
| 97. | South Deerfield | 25.65% | 18.90%(+6.76)#97 | 9.46%(+16.2)#1,883 |
| 98. | Wareham Center | 25.43% | 18.90%(+6.54)#98 | 9.46%(+16.0)#1,917 |
| 99. | Pinehurst | 25.33% | 18.90%(+6.44)#99 | 9.46%(+15.9)#1,934 |
| 100. | Edgartown | 25.25% | 18.90%(+6.35)#100 | 9.46%(+15.8)#1,956 |
Common Questions
What are the Top 10 Cities with the Highest Percentage of Irish Population in Massachusetts?
Top 10 Cities with the Highest Percentage of Irish Population in Massachusetts are:
#1
61.20%
#2
47.27%
#3
45.35%
#4
44.53%
#5
43.55%
#6
43.33%
#7
43.17%
#8
42.64%
#9
42.45%
#10
41.49%
What city has the Highest Percentage of Irish Population in Massachusetts?
Warren has the Highest Percentage of Irish Population in Massachusetts with 61.20%.
What is the Percentage of Irish Population in the State of Massachusetts?
Percentage of Irish Population in Massachusetts is 18.90%.
What is the Percentage of Irish Population in the United States?
Percentage of Irish Population in the United States is 9.46%.