Cities with the Highest Percentage of Population Enrolled in Kindergarten in Missouri
RELATED REPORTS & OPTIONS
Kindergarten
Missouri
Compare Cities
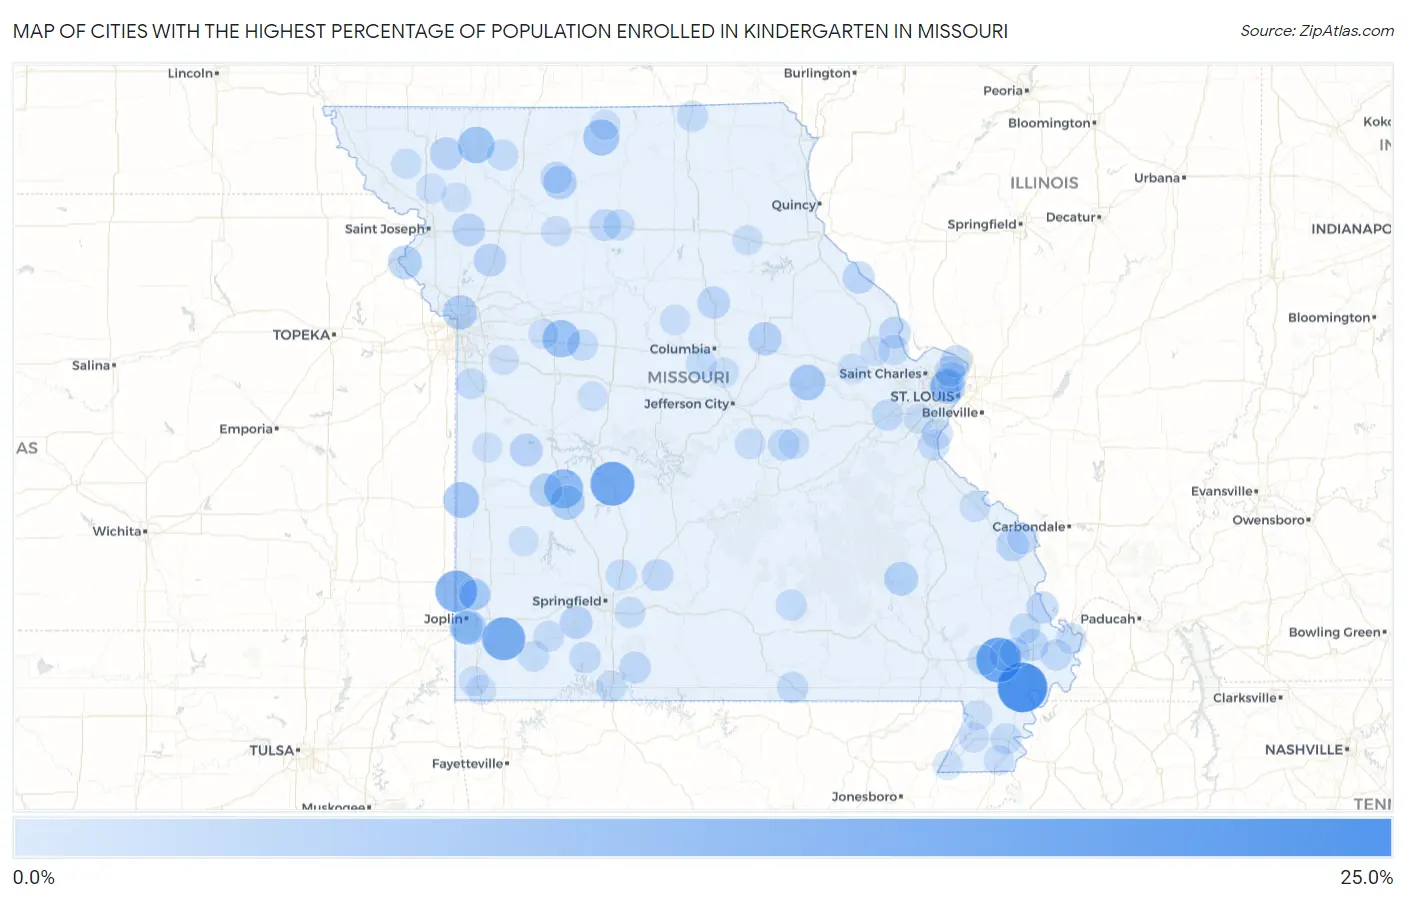
Map of Cities with the Highest Percentage of Population Enrolled in Kindergarten in Missouri
0.0%
25.0%
Cities with the Highest Percentage of Population Enrolled in Kindergarten in Missouri
| City | % in Kindergarten | vs State | vs National | |
| 1. | North Lilbourn | 20.9% | 1.2%(+19.7)#1 | 1.3%(+19.6)#20 |
| 2. | Penermon | 16.4% | 1.2%(+15.2)#2 | 1.3%(+15.2)#42 |
| 3. | Cross Timbers | 15.6% | 1.2%(+14.4)#3 | 1.3%(+14.4)#52 |
| 4. | Ritchey | 14.6% | 1.2%(+13.4)#4 | 1.3%(+13.4)#62 |
| 5. | Asbury | 13.4% | 1.2%(+12.2)#5 | 1.3%(+12.2)#84 |
| 6. | Vista | 11.1% | 1.2%(+9.90)#6 | 1.3%(+9.86)#130 |
| 7. | Briarwood Estates | 10.2% | 1.2%(+8.98)#7 | 1.3%(+8.94)#163 |
| 8. | Aullville | 9.4% | 1.2%(+8.22)#8 | 1.3%(+8.18)#201 |
| 9. | Gentry | 8.7% | 1.2%(+7.48)#9 | 1.3%(+7.44)#251 |
| 10. | Newtown | 8.3% | 1.2%(+7.04)#10 | 1.3%(+7.00)#280 |
| 11. | Richards | 8.1% | 1.2%(+6.85)#11 | 1.3%(+6.81)#295 |
| 12. | Rhineland | 7.9% | 1.2%(+6.68)#12 | 1.3%(+6.64)#311 |
| 13. | Beverly Hills | 7.7% | 1.2%(+6.46)#13 | 1.3%(+6.42)#329 |
| 14. | Shoal Creek Estates | 7.1% | 1.2%(+5.89)#14 | 1.3%(+5.85)#388 |
| 15. | Collins | 6.9% | 1.2%(+5.65)#15 | 1.3%(+5.61)#419 |
| 16. | Oaks | 6.5% | 1.2%(+5.33)#16 | 1.3%(+5.30)#469 |
| 17. | Lewis And Clark Village | 6.3% | 1.2%(+5.10)#17 | 1.3%(+5.06)#512 |
| 18. | Summer Set | 6.3% | 1.2%(+5.08)#18 | 1.3%(+5.04)#515 |
| 19. | Annapolis | 6.2% | 1.2%(+4.99)#19 | 1.3%(+4.95)#533 |
| 20. | Faucett | 6.1% | 1.2%(+4.90)#20 | 1.3%(+4.86)#549 |
| 21. | Edinburg | 6.1% | 1.2%(+4.88)#21 | 1.3%(+4.85)#553 |
| 22. | Auxvasse | 5.9% | 1.2%(+4.73)#22 | 1.3%(+4.70)#587 |
| 23. | Redings Mill | 5.9% | 1.2%(+4.67)#23 | 1.3%(+4.63)#598 |
| 24. | Roscoe | 5.6% | 1.2%(+4.34)#24 | 1.3%(+4.30)#676 |
| 25. | Billings | 5.4% | 1.2%(+4.22)#25 | 1.3%(+4.18)#725 |
| 26. | Montrose | 5.4% | 1.2%(+4.18)#26 | 1.3%(+4.15)#738 |
| 27. | Conception Junction | 5.3% | 1.2%(+4.13)#27 | 1.3%(+4.10)#753 |
| 28. | Lathrop | 5.3% | 1.2%(+4.13)#28 | 1.3%(+4.09)#757 |
| 29. | Shakertowne | 5.3% | 1.2%(+4.09)#29 | 1.3%(+4.06)#768 |
| 30. | Stewartsville | 5.3% | 1.2%(+4.08)#30 | 1.3%(+4.04)#775 |
| 31. | Old Appleton | 5.2% | 1.2%(+3.98)#31 | 1.3%(+3.94)#798 |
| 32. | Clark | 5.1% | 1.2%(+3.86)#32 | 1.3%(+3.83)#834 |
| 33. | Louisiana | 4.9% | 1.2%(+3.70)#33 | 1.3%(+3.67)#895 |
| 34. | Grayridge | 4.8% | 1.2%(+3.62)#34 | 1.3%(+3.59)#924 |
| 35. | Commerce | 4.8% | 1.2%(+3.61)#35 | 1.3%(+3.58)#929 |
| 36. | West Alton | 4.8% | 1.2%(+3.58)#36 | 1.3%(+3.54)#940 |
| 37. | Foley | 4.7% | 1.2%(+3.45)#37 | 1.3%(+3.42)#988 |
| 38. | Miner | 4.6% | 1.2%(+3.41)#38 | 1.3%(+3.38)#1,009 |
| 39. | Neck City | 4.6% | 1.2%(+3.35)#39 | 1.3%(+3.32)#1,036 |
| 40. | Velda City | 4.6% | 1.2%(+3.34)#40 | 1.3%(+3.30)#1,046 |
| 41. | Leisure Lake | 4.5% | 1.2%(+3.31)#41 | 1.3%(+3.27)#1,059 |
| 42. | Taneyville | 4.5% | 1.2%(+3.25)#42 | 1.3%(+3.22)#1,082 |
| 43. | Meadville | 4.4% | 1.2%(+3.23)#43 | 1.3%(+3.19)#1,097 |
| 44. | Niangua | 4.4% | 1.2%(+3.20)#44 | 1.3%(+3.16)#1,121 |
| 45. | Koshkonong | 4.2% | 1.2%(+3.03)#45 | 1.3%(+2.99)#1,221 |
| 46. | Galena | 4.2% | 1.2%(+2.95)#46 | 1.3%(+2.92)#1,261 |
| 47. | Anniston | 4.2% | 1.2%(+2.95)#47 | 1.3%(+2.92)#1,265 |
| 48. | Gray Summit | 4.1% | 1.2%(+2.89)#48 | 1.3%(+2.86)#1,307 |
| 49. | Belle | 4.1% | 1.2%(+2.87)#49 | 1.3%(+2.83)#1,329 |
| 50. | Pevely | 4.1% | 1.2%(+2.86)#50 | 1.3%(+2.82)#1,333 |
| 51. | Hayti Heights | 4.0% | 1.2%(+2.83)#51 | 1.3%(+2.80)#1,351 |
| 52. | Emma | 4.0% | 1.2%(+2.80)#52 | 1.3%(+2.76)#1,373 |
| 53. | Lancaster | 4.0% | 1.2%(+2.78)#53 | 1.3%(+2.74)#1,393 |
| 54. | New Hampton | 3.9% | 1.2%(+2.73)#54 | 1.3%(+2.70)#1,421 |
| 55. | Laclede | 3.9% | 1.2%(+2.72)#55 | 1.3%(+2.69)#1,428 |
| 56. | Fair Grove | 3.9% | 1.2%(+2.68)#56 | 1.3%(+2.65)#1,464 |
| 57. | Summersville | 3.9% | 1.2%(+2.67)#57 | 1.3%(+2.63)#1,482 |
| 58. | Lupus | 3.8% | 1.2%(+2.63)#58 | 1.3%(+2.60)#1,515 |
| 59. | Castle Point | 3.8% | 1.2%(+2.62)#59 | 1.3%(+2.59)#1,521 |
| 60. | Peculiar | 3.8% | 1.2%(+2.62)#60 | 1.3%(+2.59)#1,522 |
| 61. | Black Jack | 3.8% | 1.2%(+2.62)#61 | 1.3%(+2.59)#1,523 |
| 62. | Haywood City | 3.8% | 1.2%(+2.56)#62 | 1.3%(+2.52)#1,584 |
| 63. | Purdy | 3.8% | 1.2%(+2.56)#63 | 1.3%(+2.52)#1,589 |
| 64. | Frohna | 3.7% | 1.2%(+2.53)#64 | 1.3%(+2.50)#1,600 |
| 65. | Rogersville | 3.7% | 1.2%(+2.53)#65 | 1.3%(+2.49)#1,612 |
| 66. | Imperial | 3.7% | 1.2%(+2.46)#66 | 1.3%(+2.43)#1,678 |
| 67. | Wyatt | 3.7% | 1.2%(+2.46)#67 | 1.3%(+2.42)#1,683 |
| 68. | Hollister | 3.7% | 1.2%(+2.45)#68 | 1.3%(+2.41)#1,699 |
| 69. | Verona | 3.7% | 1.2%(+2.44)#69 | 1.3%(+2.40)#1,709 |
| 70. | Philadelphia | 3.6% | 1.2%(+2.43)#70 | 1.3%(+2.39)#1,719 |
| 71. | Ozora | 3.6% | 1.2%(+2.42)#71 | 1.3%(+2.39)#1,722 |
| 72. | Argyle | 3.6% | 1.2%(+2.41)#72 | 1.3%(+2.37)#1,738 |
| 73. | Bland | 3.5% | 1.2%(+2.32)#73 | 1.3%(+2.28)#1,828 |
| 74. | Old Monroe | 3.5% | 1.2%(+2.29)#74 | 1.3%(+2.26)#1,848 |
| 75. | Fayette | 3.4% | 1.2%(+2.21)#75 | 1.3%(+2.17)#1,944 |
| 76. | Purcell | 3.4% | 1.2%(+2.17)#76 | 1.3%(+2.14)#1,984 |
| 77. | Mayview | 3.3% | 1.2%(+2.13)#77 | 1.3%(+2.09)#2,048 |
| 78. | Dexter | 3.3% | 1.2%(+2.10)#78 | 1.3%(+2.06)#2,091 |
| 79. | Mooresville | 3.3% | 1.2%(+2.08)#79 | 1.3%(+2.05)#2,110 |
| 80. | Truesdale | 3.2% | 1.2%(+2.02)#80 | 1.3%(+1.99)#2,195 |
| 81. | Lucerne | 3.2% | 1.2%(+2.01)#81 | 1.3%(+1.97)#2,217 |
| 82. | Graham | 3.2% | 1.2%(+1.98)#82 | 1.3%(+1.95)#2,245 |
| 83. | Steele | 3.2% | 1.2%(+1.98)#83 | 1.3%(+1.95)#2,253 |
| 84. | Shelbina | 3.2% | 1.2%(+1.97)#84 | 1.3%(+1.93)#2,268 |
| 85. | Latham | 3.2% | 1.2%(+1.96)#85 | 1.3%(+1.92)#2,290 |
| 86. | Kennett | 3.2% | 1.2%(+1.95)#86 | 1.3%(+1.92)#2,293 |
| 87. | Rosendale | 3.2% | 1.2%(+1.95)#87 | 1.3%(+1.91)#2,303 |
| 88. | Peaceful Village | 3.1% | 1.2%(+1.93)#88 | 1.3%(+1.90)#2,322 |
| 89. | Lone Jack | 3.1% | 1.2%(+1.91)#89 | 1.3%(+1.88)#2,354 |
| 90. | Jerico Springs | 3.1% | 1.2%(+1.90)#90 | 1.3%(+1.86)#2,373 |
| 91. | Holcomb | 3.1% | 1.2%(+1.89)#91 | 1.3%(+1.85)#2,383 |
| 92. | Morehouse | 3.1% | 1.2%(+1.87)#92 | 1.3%(+1.84)#2,400 |
| 93. | Union Star | 3.1% | 1.2%(+1.85)#93 | 1.3%(+1.81)#2,434 |
| 94. | Moscow Mills | 3.0% | 1.2%(+1.83)#94 | 1.3%(+1.79)#2,469 |
| 95. | Pineville | 3.0% | 1.2%(+1.82)#95 | 1.3%(+1.78)#2,482 |
| 96. | Butler | 3.0% | 1.2%(+1.82)#96 | 1.3%(+1.78)#2,483 |
| 97. | Ashland | 3.0% | 1.2%(+1.81)#97 | 1.3%(+1.78)#2,486 |
| 98. | Cardwell | 3.0% | 1.2%(+1.81)#98 | 1.3%(+1.77)#2,513 |
| 99. | Green Ridge | 3.0% | 1.2%(+1.80)#99 | 1.3%(+1.77)#2,516 |
| 100. | Anderson | 3.0% | 1.2%(+1.80)#100 | 1.3%(+1.77)#2,518 |
Common Questions
What are the Top 10 Cities with the Highest Percentage of Population Enrolled in Kindergarten in Missouri?
Top 10 Cities with the Highest Percentage of Population Enrolled in Kindergarten in Missouri are:
#1
20.9%
#2
16.4%
#3
15.6%
#4
14.6%
#5
13.4%
#6
11.1%
#7
9.4%
#8
8.7%
#9
8.3%
#10
8.1%
What city has the Highest Percentage of Population Enrolled in Kindergarten in Missouri?
North Lilbourn has the Highest Percentage of Population Enrolled in Kindergarten in Missouri with 20.9%.
What is the Percentage of Population Enrolled in Kindergarten in the State of Missouri?
Percentage of Population Enrolled in Kindergarten in Missouri is 1.2%.
What is the Percentage of Population Enrolled in Kindergarten in the United States?
Percentage of Population Enrolled in Kindergarten in the United States is 1.3%.