Cities with the Highest Percentage of Population Enrolled in Kindergarten in Massachusetts
RELATED REPORTS & OPTIONS
Kindergarten
Massachusetts
Compare Cities
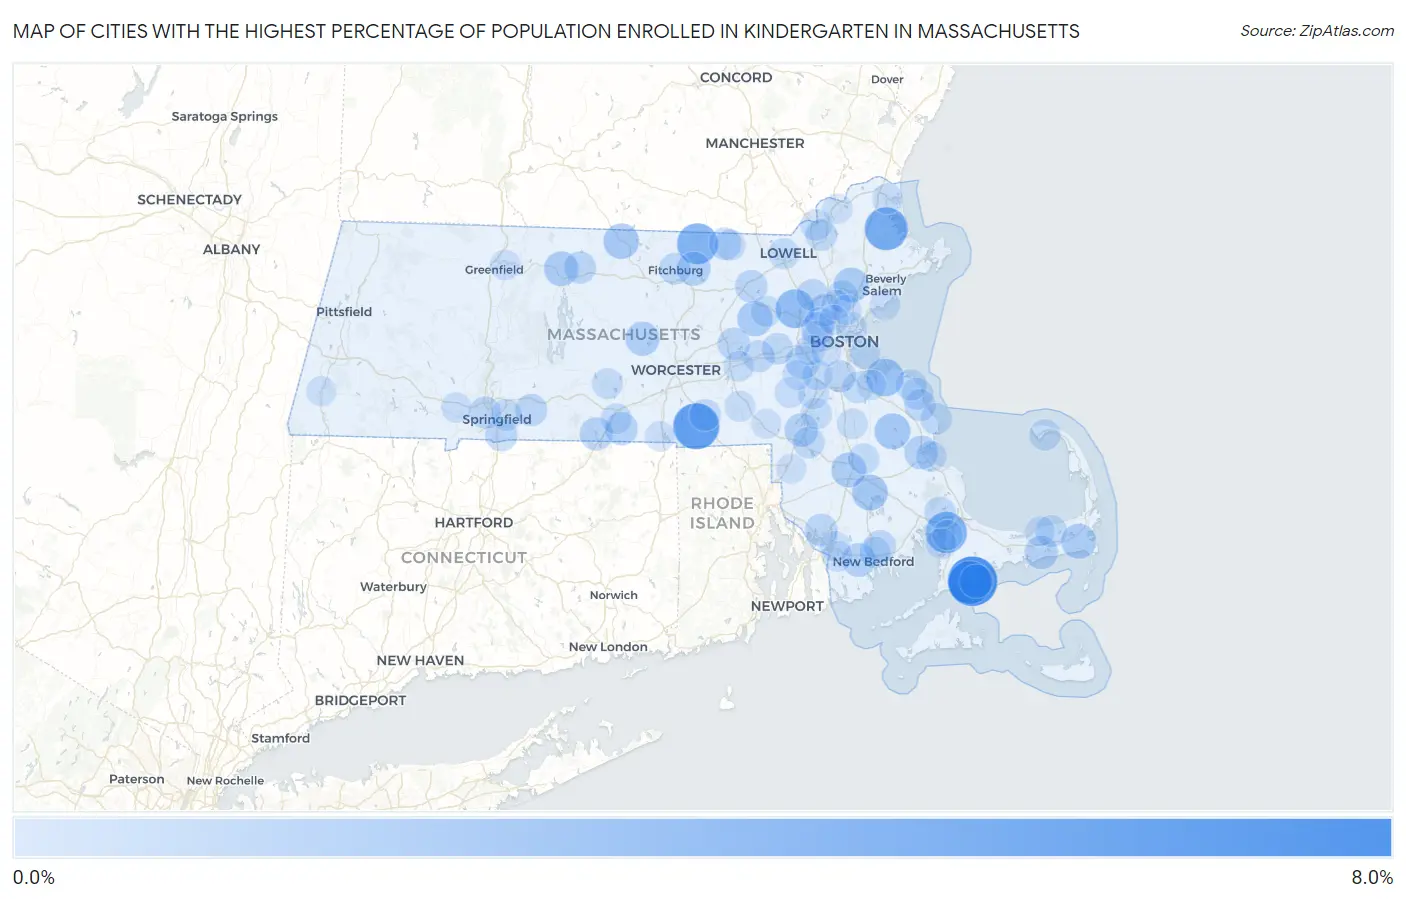
Map of Cities with the Highest Percentage of Population Enrolled in Kindergarten in Massachusetts
0.0%
8.0%
Cities with the Highest Percentage of Population Enrolled in Kindergarten in Massachusetts
| City | % in Kindergarten | vs State | vs National | |
| 1. | Monomoscoy Island | 6.5% | 1.1%(+5.43)#1 | 1.3%(+5.25)#473 |
| 2. | East Douglas | 5.5% | 1.1%(+4.40)#2 | 1.3%(+4.22)#710 |
| 3. | Seconsett Island | 4.6% | 1.1%(+3.54)#3 | 1.3%(+3.36)#1,014 |
| 4. | Rowley | 4.6% | 1.1%(+3.49)#4 | 1.3%(+3.31)#1,037 |
| 5. | Bourne | 4.1% | 1.1%(+3.02)#5 | 1.3%(+2.84)#1,324 |
| 6. | Townsend | 4.0% | 1.1%(+2.92)#6 | 1.3%(+2.74)#1,394 |
| 7. | West Warren | 3.6% | 1.1%(+2.52)#7 | 1.3%(+2.35)#1,766 |
| 8. | Hanscom Afb | 3.3% | 1.1%(+2.27)#8 | 1.3%(+2.09)#2,047 |
| 9. | Hingham | 3.0% | 1.1%(+1.94)#9 | 1.3%(+1.76)#2,533 |
| 10. | Hanson | 2.5% | 1.1%(+1.46)#10 | 1.3%(+1.29)#3,578 |
| 11. | North Lakeville | 2.5% | 1.1%(+1.46)#11 | 1.3%(+1.28)#3,587 |
| 12. | Winchendon | 2.4% | 1.1%(+1.36)#12 | 1.3%(+1.18)#3,873 |
| 13. | Maynard | 2.4% | 1.1%(+1.28)#13 | 1.3%(+1.10)#4,153 |
| 14. | Lynnfield | 2.3% | 1.1%(+1.23)#14 | 1.3%(+1.05)#4,333 |
| 15. | East Harwich | 2.3% | 1.1%(+1.22)#15 | 1.3%(+1.05)#4,345 |
| 16. | Raynham Center | 2.3% | 1.1%(+1.19)#16 | 1.3%(+1.01)#4,454 |
| 17. | Orange | 2.2% | 1.1%(+1.14)#17 | 1.3%(+0.967)#4,620 |
| 18. | Rutland | 2.1% | 1.1%(+0.980)#18 | 1.3%(+0.802)#5,311 |
| 19. | Needham | 2.0% | 1.1%(+0.944)#19 | 1.3%(+0.766)#5,469 |
| 20. | Lunenburg | 2.0% | 1.1%(+0.928)#20 | 1.3%(+0.751)#5,537 |
| 21. | Smith Mills | 2.0% | 1.1%(+0.896)#21 | 1.3%(+0.718)#5,714 |
| 22. | Kingston | 2.0% | 1.1%(+0.886)#22 | 1.3%(+0.708)#5,763 |
| 23. | Cedar Crest | 1.9% | 1.1%(+0.876)#23 | 1.3%(+0.698)#5,813 |
| 24. | New Seabury | 1.9% | 1.1%(+0.824)#24 | 1.3%(+0.646)#6,085 |
| 25. | South Yarmouth | 1.9% | 1.1%(+0.809)#25 | 1.3%(+0.631)#6,170 |
| 26. | Foxborough | 1.9% | 1.1%(+0.807)#26 | 1.3%(+0.629)#6,176 |
| 27. | Holland | 1.8% | 1.1%(+0.722)#27 | 1.3%(+0.544)#6,669 |
| 28. | Southbridge Town | 1.8% | 1.1%(+0.698)#28 | 1.3%(+0.521)#6,822 |
| 29. | Belmont | 1.7% | 1.1%(+0.638)#29 | 1.3%(+0.460)#7,245 |
| 30. | Somerset | 1.7% | 1.1%(+0.579)#30 | 1.3%(+0.402)#7,646 |
| 31. | Marlborough | 1.6% | 1.1%(+0.561)#31 | 1.3%(+0.384)#7,783 |
| 32. | Littleton Common | 1.6% | 1.1%(+0.561)#32 | 1.3%(+0.383)#7,789 |
| 33. | Longmeadow | 1.6% | 1.1%(+0.539)#33 | 1.3%(+0.361)#7,941 |
| 34. | Winchester | 1.6% | 1.1%(+0.519)#34 | 1.3%(+0.341)#8,100 |
| 35. | Pepperell | 1.6% | 1.1%(+0.498)#35 | 1.3%(+0.320)#8,289 |
| 36. | Athol | 1.6% | 1.1%(+0.478)#36 | 1.3%(+0.300)#8,461 |
| 37. | Wilbraham | 1.5% | 1.1%(+0.466)#37 | 1.3%(+0.289)#8,548 |
| 38. | West Springfield Town | 1.5% | 1.1%(+0.460)#38 | 1.3%(+0.282)#8,606 |
| 39. | Milton | 1.5% | 1.1%(+0.435)#39 | 1.3%(+0.257)#8,791 |
| 40. | Acushnet Center | 1.5% | 1.1%(+0.430)#40 | 1.3%(+0.252)#8,833 |
| 41. | Burlington | 1.5% | 1.1%(+0.413)#41 | 1.3%(+0.235)#8,965 |
| 42. | East Dennis | 1.5% | 1.1%(+0.401)#42 | 1.3%(+0.223)#9,059 |
| 43. | Framingham | 1.4% | 1.1%(+0.374)#43 | 1.3%(+0.196)#9,317 |
| 44. | Wakefield | 1.4% | 1.1%(+0.373)#44 | 1.3%(+0.195)#9,324 |
| 45. | Mansfield Center | 1.4% | 1.1%(+0.356)#45 | 1.3%(+0.179)#9,470 |
| 46. | Scituate | 1.4% | 1.1%(+0.345)#46 | 1.3%(+0.168)#9,574 |
| 47. | Whitinsville | 1.4% | 1.1%(+0.336)#47 | 1.3%(+0.158)#9,660 |
| 48. | Fitchburg | 1.4% | 1.1%(+0.336)#48 | 1.3%(+0.158)#9,664 |
| 49. | Cochituate | 1.4% | 1.1%(+0.331)#49 | 1.3%(+0.153)#9,704 |
| 50. | Marshfield Hills | 1.4% | 1.1%(+0.328)#50 | 1.3%(+0.150)#9,731 |
| 51. | White Island Shores | 1.4% | 1.1%(+0.321)#51 | 1.3%(+0.143)#9,782 |
| 52. | Lawrence | 1.4% | 1.1%(+0.317)#52 | 1.3%(+0.140)#9,807 |
| 53. | Ocean Bluff Brant Rock | 1.4% | 1.1%(+0.312)#53 | 1.3%(+0.135)#9,859 |
| 54. | Springfield | 1.4% | 1.1%(+0.308)#54 | 1.3%(+0.130)#9,918 |
| 55. | Methuen Town | 1.4% | 1.1%(+0.305)#55 | 1.3%(+0.127)#9,940 |
| 56. | Provincetown | 1.4% | 1.1%(+0.279)#56 | 1.3%(+0.102)#10,199 |
| 57. | North Scituate | 1.3% | 1.1%(+0.271)#57 | 1.3%(+0.094)#10,267 |
| 58. | New Bedford | 1.3% | 1.1%(+0.240)#58 | 1.3%(+0.063)#10,562 |
| 59. | Braintree Town | 1.3% | 1.1%(+0.218)#59 | 1.3%(+0.040)#10,790 |
| 60. | Sharon | 1.3% | 1.1%(+0.182)#60 | 1.3%(+0.004)#11,134 |
| 61. | Lowell | 1.2% | 1.1%(+0.171)#61 | 1.3%(-0.006)#11,238 |
| 62. | East Pepperell | 1.2% | 1.1%(+0.167)#62 | 1.3%(-0.010)#11,279 |
| 63. | Chelsea | 1.2% | 1.1%(+0.145)#63 | 1.3%(-0.033)#11,519 |
| 64. | Sturbridge | 1.2% | 1.1%(+0.137)#64 | 1.3%(-0.041)#11,611 |
| 65. | Boston | 1.2% | 1.1%(+0.135)#65 | 1.3%(-0.043)#11,638 |
| 66. | West Concord | 1.2% | 1.1%(+0.135)#66 | 1.3%(-0.043)#11,639 |
| 67. | Brookfield | 1.2% | 1.1%(+0.133)#67 | 1.3%(-0.045)#11,664 |
| 68. | Bridgewater Town | 1.2% | 1.1%(+0.129)#68 | 1.3%(-0.049)#11,714 |
| 69. | Milford | 1.2% | 1.1%(+0.121)#69 | 1.3%(-0.057)#11,782 |
| 70. | Norwood | 1.2% | 1.1%(+0.115)#70 | 1.3%(-0.063)#11,852 |
| 71. | Pocasset | 1.2% | 1.1%(+0.112)#71 | 1.3%(-0.066)#11,886 |
| 72. | Watertown Town | 1.2% | 1.1%(+0.104)#72 | 1.3%(-0.073)#11,971 |
| 73. | Brockton | 1.2% | 1.1%(+0.096)#73 | 1.3%(-0.082)#12,069 |
| 74. | Medfield | 1.2% | 1.1%(+0.087)#74 | 1.3%(-0.091)#12,166 |
| 75. | North Plymouth | 1.1% | 1.1%(+0.076)#75 | 1.3%(-0.102)#12,279 |
| 76. | Cordaville | 1.1% | 1.1%(+0.072)#76 | 1.3%(-0.106)#12,316 |
| 77. | Greenfield | 1.1% | 1.1%(+0.072)#77 | 1.3%(-0.106)#12,325 |
| 78. | North Attleborough | 1.1% | 1.1%(+0.061)#78 | 1.3%(-0.117)#12,414 |
| 79. | Dedham | 1.1% | 1.1%(+0.058)#79 | 1.3%(-0.119)#12,438 |
| 80. | Newburyport | 1.1% | 1.1%(+0.039)#80 | 1.3%(-0.139)#12,622 |
| 81. | Swampscott | 1.1% | 1.1%(+0.030)#81 | 1.3%(-0.148)#12,722 |
| 82. | Turners Falls | 1.1% | 1.1%(+0.027)#82 | 1.3%(-0.151)#12,757 |
| 83. | North Westport | 1.1% | 1.1%(+0.016)#83 | 1.3%(-0.162)#12,878 |
| 84. | Arlington | 1.1% | 1.1%(-0.001)#84 | 1.3%(-0.178)#13,065 |
| 85. | Westfield | 1.1% | 1.1%(-0.021)#85 | 1.3%(-0.199)#13,280 |
| 86. | Melrose | 1.0% | 1.1%(-0.024)#86 | 1.3%(-0.201)#13,303 |
| 87. | Fall River | 1.0% | 1.1%(-0.026)#87 | 1.3%(-0.203)#13,318 |
| 88. | Webster | 1.0% | 1.1%(-0.032)#88 | 1.3%(-0.209)#13,384 |
| 89. | Newton | 1.0% | 1.1%(-0.042)#89 | 1.3%(-0.220)#13,494 |
| 90. | Monument Beach | 1.0% | 1.1%(-0.049)#90 | 1.3%(-0.227)#13,566 |
| 91. | Weymouth Town | 1.0% | 1.1%(-0.064)#91 | 1.3%(-0.242)#13,716 |
| 92. | Dover | 1.0% | 1.1%(-0.069)#92 | 1.3%(-0.247)#13,774 |
| 93. | Dennis | 1.0% | 1.1%(-0.072)#93 | 1.3%(-0.250)#13,803 |
| 94. | Stoneham | 1.00% | 1.1%(-0.078)#94 | 1.3%(-0.256)#13,858 |
| 95. | Haverhill | 0.99% | 1.1%(-0.085)#95 | 1.3%(-0.263)#13,937 |
| 96. | Great Barrington | 0.98% | 1.1%(-0.092)#96 | 1.3%(-0.269)#14,004 |
| 97. | Attleboro | 0.97% | 1.1%(-0.101)#97 | 1.3%(-0.278)#14,106 |
| 98. | Brookline | 0.97% | 1.1%(-0.101)#98 | 1.3%(-0.279)#14,115 |
| 99. | Medford | 0.97% | 1.1%(-0.102)#99 | 1.3%(-0.280)#14,122 |
| 100. | Franklin Town | 0.97% | 1.1%(-0.104)#100 | 1.3%(-0.282)#14,146 |
Common Questions
What are the Top 10 Cities with the Highest Percentage of Population Enrolled in Kindergarten in Massachusetts?
Top 10 Cities with the Highest Percentage of Population Enrolled in Kindergarten in Massachusetts are:
#1
6.5%
#2
5.5%
#3
4.6%
#4
4.6%
#5
4.1%
#6
4.0%
#7
3.3%
#8
3.0%
#9
2.5%
#10
2.5%
What city has the Highest Percentage of Population Enrolled in Kindergarten in Massachusetts?
Monomoscoy Island has the Highest Percentage of Population Enrolled in Kindergarten in Massachusetts with 6.5%.
What is the Percentage of Population Enrolled in Kindergarten in the State of Massachusetts?
Percentage of Population Enrolled in Kindergarten in Massachusetts is 1.1%.
What is the Percentage of Population Enrolled in Kindergarten in the United States?
Percentage of Population Enrolled in Kindergarten in the United States is 1.3%.