Cities with the Largest Swedish Community in Connecticut
RELATED REPORTS & OPTIONS
Swedish
Connecticut
Compare Cities
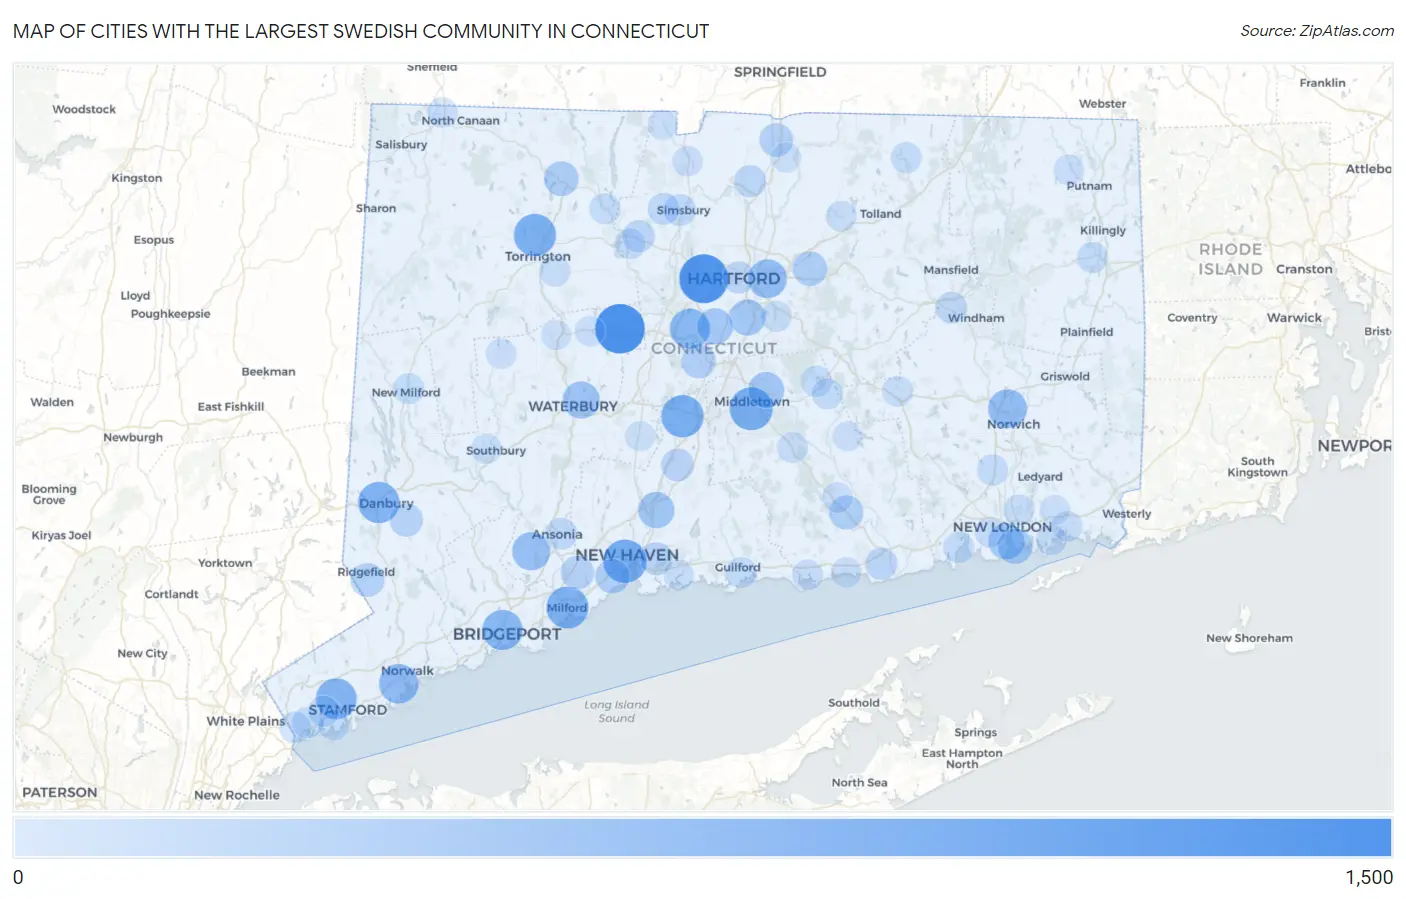
Map of Cities with the Largest Swedish Community in Connecticut
0
1,500
Cities with the Largest Swedish Community in Connecticut
| City | Swedish | vs State | vs National | |
| 1. | Bristol | 1,111 | 47,869(2.32%)#1 | 3,471,233(0.03%)#417 |
| 2. | West Hartford | 1,077 | 47,869(2.25%)#2 | 3,471,233(0.03%)#437 |
| 3. | New Haven | 761 | 47,869(1.59%)#3 | 3,471,233(0.02%)#653 |
| 4. | Middletown | 746 | 47,869(1.56%)#4 | 3,471,233(0.02%)#670 |
| 5. | Meriden | 714 | 47,869(1.49%)#5 | 3,471,233(0.02%)#705 |
| 6. | Torrington | 701 | 47,869(1.46%)#6 | 3,471,233(0.02%)#723 |
| 7. | Milford City Balance | 687 | 47,869(1.44%)#7 | 3,471,233(0.02%)#743 |
| 8. | Danbury | 651 | 47,869(1.36%)#8 | 3,471,233(0.02%)#788 |
| 9. | Stamford | 628 | 47,869(1.31%)#9 | 3,471,233(0.02%)#812 |
| 10. | Bridgeport | 592 | 47,869(1.24%)#10 | 3,471,233(0.02%)#880 |
| 11. | New Britain | 591 | 47,869(1.23%)#11 | 3,471,233(0.02%)#883 |
| 12. | Norwalk | 548 | 47,869(1.14%)#12 | 3,471,233(0.02%)#957 |
| 13. | Norwich | 517 | 47,869(1.08%)#13 | 3,471,233(0.01%)#1,013 |
| 14. | East Hartford | 506 | 47,869(1.06%)#14 | 3,471,233(0.01%)#1,029 |
| 15. | Shelton | 479 | 47,869(1.00%)#15 | 3,471,233(0.01%)#1,088 |
| 16. | Waterbury | 420 | 47,869(0.88%)#16 | 3,471,233(0.01%)#1,246 |
| 17. | North Haven | 379 | 47,869(0.79%)#17 | 3,471,233(0.01%)#1,368 |
| 18. | New London | 369 | 47,869(0.77%)#18 | 3,471,233(0.01%)#1,406 |
| 19. | Wethersfield | 365 | 47,869(0.76%)#19 | 3,471,233(0.01%)#1,422 |
| 20. | Newington | 362 | 47,869(0.76%)#20 | 3,471,233(0.01%)#1,435 |
| 21. | Portland | 361 | 47,869(0.75%)#21 | 3,471,233(0.01%)#1,440 |
| 22. | Groton | 320 | 47,869(0.67%)#22 | 3,471,233(0.01%)#1,610 |
| 23. | Winsted | 291 | 47,869(0.61%)#23 | 3,471,233(0.01%)#1,749 |
| 24. | Manchester | 284 | 47,869(0.59%)#24 | 3,471,233(0.01%)#1,790 |
| 25. | West Haven | 276 | 47,869(0.58%)#25 | 3,471,233(0.01%)#1,836 |
| 26. | Kensington | 261 | 47,869(0.55%)#26 | 3,471,233(0.01%)#1,936 |
| 27. | Deep River Center | 256 | 47,869(0.53%)#27 | 3,471,233(0.01%)#1,971 |
| 28. | Ridgefield | 242 | 47,869(0.51%)#28 | 3,471,233(0.01%)#2,078 |
| 29. | Thompsonville | 234 | 47,869(0.49%)#29 | 3,471,233(0.01%)#2,137 |
| 30. | Orange | 220 | 47,869(0.46%)#30 | 3,471,233(0.01%)#2,259 |
| 31. | Bethel | 216 | 47,869(0.45%)#31 | 3,471,233(0.01%)#2,292 |
| 32. | Naugatuck Borough | 208 | 47,869(0.43%)#32 | 3,471,233(0.01%)#2,364 |
| 33. | East Haven | 195 | 47,869(0.41%)#33 | 3,471,233(0.01%)#2,472 |
| 34. | Wallingford Center | 188 | 47,869(0.39%)#34 | 3,471,233(0.01%)#2,546 |
| 35. | Trumbull Center | 172 | 47,869(0.36%)#35 | 3,471,233(0.00%)#2,706 |
| 36. | Canton Valley | 163 | 47,869(0.34%)#36 | 3,471,233(0.00%)#2,834 |
| 37. | Hartford | 156 | 47,869(0.33%)#37 | 3,471,233(0.00%)#2,931 |
| 38. | Old Saybrook Center | 155 | 47,869(0.32%)#38 | 3,471,233(0.00%)#2,951 |
| 39. | Windsor Locks | 153 | 47,869(0.32%)#39 | 3,471,233(0.00%)#2,972 |
| 40. | Sandy Hook | 153 | 47,869(0.32%)#40 | 3,471,233(0.00%)#2,974 |
| 41. | Ansonia | 144 | 47,869(0.30%)#41 | 3,471,233(0.00%)#3,088 |
| 42. | Simsbury Center | 137 | 47,869(0.29%)#42 | 3,471,233(0.00%)#3,228 |
| 43. | West Simsbury | 137 | 47,869(0.29%)#43 | 3,471,233(0.00%)#3,234 |
| 44. | Noroton | 131 | 47,869(0.27%)#44 | 3,471,233(0.00%)#3,362 |
| 45. | Willimantic | 129 | 47,869(0.27%)#45 | 3,471,233(0.00%)#3,396 |
| 46. | Lordship | 127 | 47,869(0.27%)#46 | 3,471,233(0.00%)#3,446 |
| 47. | Pemberwick | 127 | 47,869(0.27%)#47 | 3,471,233(0.00%)#3,447 |
| 48. | Northford | 122 | 47,869(0.25%)#48 | 3,471,233(0.00%)#3,544 |
| 49. | Stepney | 119 | 47,869(0.25%)#49 | 3,471,233(0.00%)#3,620 |
| 50. | Greenwich | 110 | 47,869(0.23%)#50 | 3,471,233(0.00%)#3,828 |
| 51. | Oxoboxo River | 110 | 47,869(0.23%)#51 | 3,471,233(0.00%)#3,843 |
| 52. | Lake Pocotopaug | 107 | 47,869(0.22%)#52 | 3,471,233(0.00%)#3,922 |
| 53. | Jewett City Borough | 103 | 47,869(0.22%)#53 | 3,471,233(0.00%)#4,028 |
| 54. | Riverton | 103 | 47,869(0.22%)#54 | 3,471,233(0.00%)#4,033 |
| 55. | Saugatuck | 101 | 47,869(0.21%)#55 | 3,471,233(0.00%)#4,087 |
| 56. | New Hartford Center | 101 | 47,869(0.21%)#56 | 3,471,233(0.00%)#4,091 |
| 57. | Niantic | 100 | 47,869(0.21%)#57 | 3,471,233(0.00%)#4,110 |
| 58. | East Hampton | 100 | 47,869(0.21%)#58 | 3,471,233(0.00%)#4,112 |
| 59. | Old Greenwich | 98 | 47,869(0.20%)#59 | 3,471,233(0.00%)#4,154 |
| 60. | Cos Cob | 97 | 47,869(0.20%)#60 | 3,471,233(0.00%)#4,180 |
| 61. | New Milford | 97 | 47,869(0.20%)#61 | 3,471,233(0.00%)#4,182 |
| 62. | East Brooklyn | 95 | 47,869(0.20%)#62 | 3,471,233(0.00%)#4,243 |
| 63. | Guilford Center | 94 | 47,869(0.20%)#63 | 3,471,233(0.00%)#4,262 |
| 64. | Stafford Springs | 93 | 47,869(0.19%)#64 | 3,471,233(0.00%)#4,285 |
| 65. | Glastonbury Center | 91 | 47,869(0.19%)#65 | 3,471,233(0.00%)#4,334 |
| 66. | Tokeneke | 90 | 47,869(0.19%)#66 | 3,471,233(0.00%)#4,384 |
| 67. | Conning Towers Nautilus Park | 89 | 47,869(0.19%)#67 | 3,471,233(0.00%)#4,416 |
| 68. | Colchester | 89 | 47,869(0.19%)#68 | 3,471,233(0.00%)#4,421 |
| 69. | Northwest Harwinton | 88 | 47,869(0.18%)#69 | 3,471,233(0.00%)#4,450 |
| 70. | Higganum | 86 | 47,869(0.18%)#70 | 3,471,233(0.00%)#4,535 |
| 71. | South Wilton | 86 | 47,869(0.18%)#71 | 3,471,233(0.00%)#4,537 |
| 72. | Clinton | 85 | 47,869(0.18%)#72 | 3,471,233(0.00%)#4,566 |
| 73. | Collinsville | 84 | 47,869(0.18%)#73 | 3,471,233(0.00%)#4,597 |
| 74. | Staples | 82 | 47,869(0.17%)#74 | 3,471,233(0.00%)#4,661 |
| 75. | Oronoque | 80 | 47,869(0.17%)#75 | 3,471,233(0.00%)#4,735 |
| 76. | Rockville | 77 | 47,869(0.16%)#76 | 3,471,233(0.00%)#4,850 |
| 77. | Noank | 76 | 47,869(0.16%)#77 | 3,471,233(0.00%)#4,906 |
| 78. | Bethlehem Village | 74 | 47,869(0.15%)#78 | 3,471,233(0.00%)#4,984 |
| 79. | New Canaan | 69 | 47,869(0.14%)#79 | 3,471,233(0.00%)#5,186 |
| 80. | South Woodstock | 68 | 47,869(0.14%)#80 | 3,471,233(0.00%)#5,249 |
| 81. | Mystic | 67 | 47,869(0.14%)#81 | 3,471,233(0.00%)#5,277 |
| 82. | Westbrook Center | 67 | 47,869(0.14%)#82 | 3,471,233(0.00%)#5,282 |
| 83. | Chester Center | 67 | 47,869(0.14%)#83 | 3,471,233(0.00%)#5,285 |
| 84. | Salmon Brook | 65 | 47,869(0.14%)#84 | 3,471,233(0.00%)#5,378 |
| 85. | Waterford | 64 | 47,869(0.13%)#85 | 3,471,233(0.00%)#5,418 |
| 86. | Branford Center | 63 | 47,869(0.13%)#86 | 3,471,233(0.00%)#5,456 |
| 87. | Ridgebury | 62 | 47,869(0.13%)#87 | 3,471,233(0.00%)#5,507 |
| 88. | Canaan | 61 | 47,869(0.13%)#88 | 3,471,233(0.00%)#5,570 |
| 89. | Terryville | 58 | 47,869(0.12%)#89 | 3,471,233(0.00%)#5,720 |
| 90. | Heritage Village | 57 | 47,869(0.12%)#90 | 3,471,233(0.00%)#5,783 |
| 91. | Daniels Farm | 53 | 47,869(0.11%)#91 | 3,471,233(0.00%)#6,028 |
| 92. | Noroton Heights | 53 | 47,869(0.11%)#92 | 3,471,233(0.00%)#6,041 |
| 93. | North Granby | 53 | 47,869(0.11%)#93 | 3,471,233(0.00%)#6,052 |
| 94. | Southwood Acres | 52 | 47,869(0.11%)#94 | 3,471,233(0.00%)#6,093 |
| 95. | Old Mystic | 51 | 47,869(0.11%)#95 | 3,471,233(0.00%)#6,166 |
| 96. | Thomaston | 51 | 47,869(0.11%)#96 | 3,471,233(0.00%)#6,178 |
| 97. | Cheshire Village | 50 | 47,869(0.10%)#97 | 3,471,233(0.00%)#6,229 |
| 98. | Ball Pond | 49 | 47,869(0.10%)#98 | 3,471,233(0.00%)#6,314 |
| 99. | Moodus | 49 | 47,869(0.10%)#99 | 3,471,233(0.00%)#6,321 |
| 100. | Danielson Borough | 48 | 47,869(0.10%)#100 | 3,471,233(0.00%)#6,362 |
Common Questions
What are the Top 10 Cities with the Largest Swedish Community in Connecticut?
Top 10 Cities with the Largest Swedish Community in Connecticut are:
#1
1,111
#2
1,077
#3
761
#4
746
#5
714
#6
701
#7
687
#8
651
#9
628
#10
592
What city has the Largest Swedish Community in Connecticut?
Bristol has the Largest Swedish Community in Connecticut with 1,111.
What is the Total Swedish Population in the State of Connecticut?
Total Swedish Population in Connecticut is 47,869.
What is the Total Swedish Population in the United States?
Total Swedish Population in the United States is 3,471,233.