Cities with the Largest Swedish Community in Illinois
RELATED REPORTS & OPTIONS
Swedish
Illinois
Compare Cities
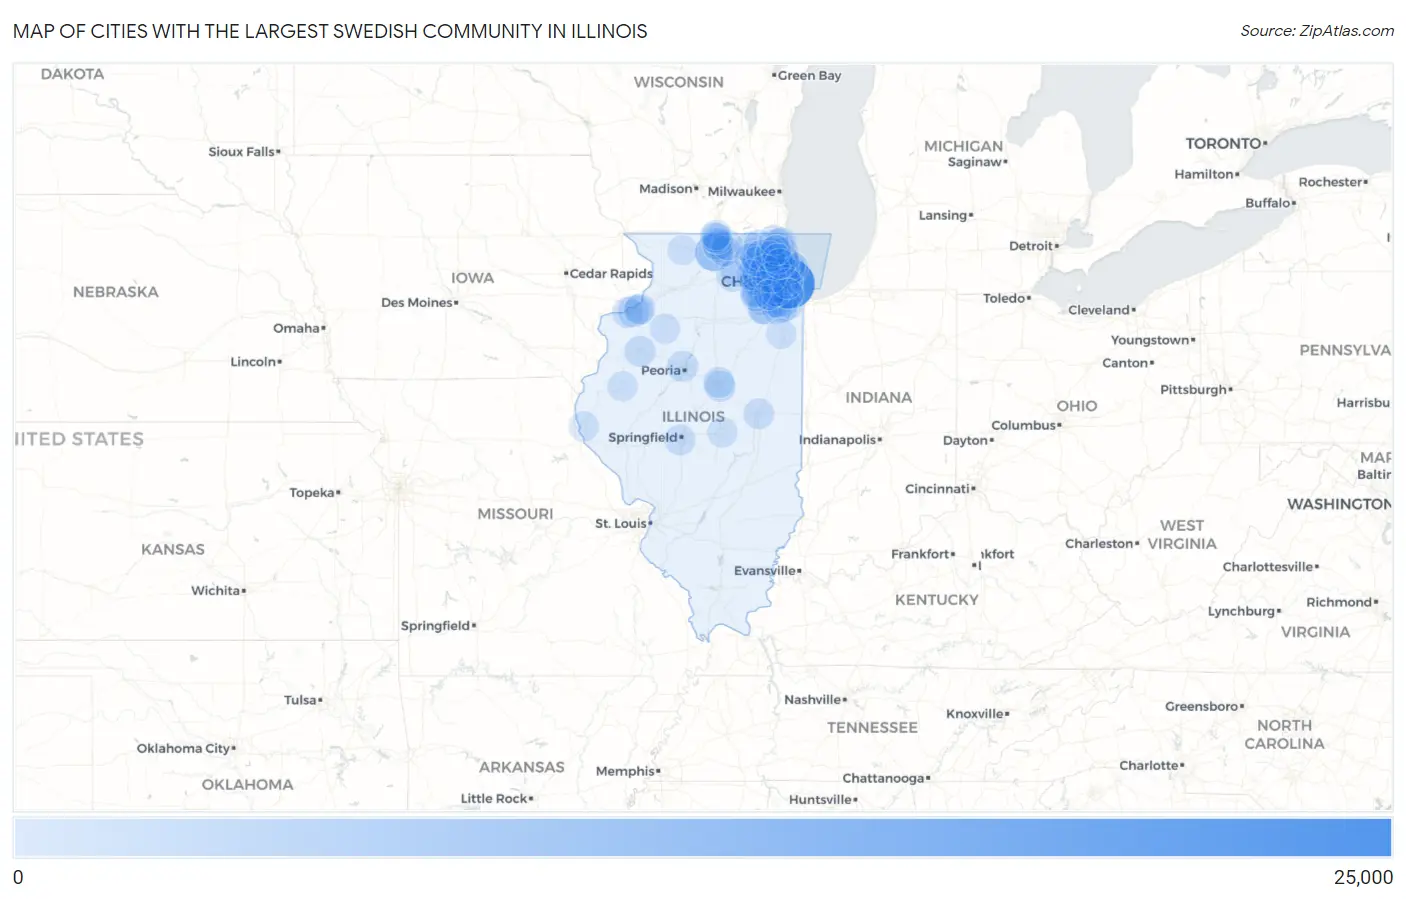
Map of Cities with the Largest Swedish Community in Illinois
0
25,000
Cities with the Largest Swedish Community in Illinois
| City | Swedish | vs State | vs National | |
| 1. | Chicago | 24,166 | 226,157(10.69%)#1 | 3,471,233(0.70%)#2 |
| 2. | Rockford | 8,793 | 226,157(3.89%)#2 | 3,471,233(0.25%)#15 |
| 3. | Naperville | 3,663 | 226,157(1.62%)#3 | 3,471,233(0.11%)#76 |
| 4. | Wheaton | 2,446 | 226,157(1.08%)#4 | 3,471,233(0.07%)#135 |
| 5. | Aurora | 2,373 | 226,157(1.05%)#5 | 3,471,233(0.07%)#138 |
| 6. | Moline | 2,121 | 226,157(0.94%)#6 | 3,471,233(0.06%)#156 |
| 7. | Arlington Heights | 2,090 | 226,157(0.92%)#7 | 3,471,233(0.06%)#160 |
| 8. | Joliet | 2,060 | 226,157(0.91%)#8 | 3,471,233(0.06%)#165 |
| 9. | Palatine | 2,017 | 226,157(0.89%)#9 | 3,471,233(0.06%)#171 |
| 10. | Tinley Park | 1,976 | 226,157(0.87%)#10 | 3,471,233(0.06%)#177 |
| 11. | Loves Park | 1,917 | 226,157(0.85%)#11 | 3,471,233(0.06%)#184 |
| 12. | Elgin | 1,914 | 226,157(0.85%)#12 | 3,471,233(0.06%)#185 |
| 13. | Machesney Park | 1,862 | 226,157(0.82%)#13 | 3,471,233(0.05%)#195 |
| 14. | Evanston | 1,693 | 226,157(0.75%)#14 | 3,471,233(0.05%)#229 |
| 15. | St Charles | 1,588 | 226,157(0.70%)#15 | 3,471,233(0.05%)#250 |
| 16. | Galesburg | 1,560 | 226,157(0.69%)#16 | 3,471,233(0.04%)#256 |
| 17. | Downers Grove | 1,470 | 226,157(0.65%)#17 | 3,471,233(0.04%)#280 |
| 18. | Peoria | 1,468 | 226,157(0.65%)#18 | 3,471,233(0.04%)#281 |
| 19. | Bloomington | 1,463 | 226,157(0.65%)#19 | 3,471,233(0.04%)#283 |
| 20. | Mount Prospect | 1,436 | 226,157(0.63%)#20 | 3,471,233(0.04%)#290 |
| 21. | Crystal Lake | 1,413 | 226,157(0.62%)#21 | 3,471,233(0.04%)#298 |
| 22. | Des Plaines | 1,394 | 226,157(0.62%)#22 | 3,471,233(0.04%)#306 |
| 23. | Dekalb | 1,375 | 226,157(0.61%)#23 | 3,471,233(0.04%)#315 |
| 24. | Woodstock | 1,370 | 226,157(0.61%)#24 | 3,471,233(0.04%)#316 |
| 25. | Sycamore | 1,295 | 226,157(0.57%)#25 | 3,471,233(0.04%)#335 |
| 26. | Elmhurst | 1,269 | 226,157(0.56%)#26 | 3,471,233(0.04%)#344 |
| 27. | Rock Island | 1,267 | 226,157(0.56%)#27 | 3,471,233(0.04%)#346 |
| 28. | Normal | 1,233 | 226,157(0.55%)#28 | 3,471,233(0.04%)#363 |
| 29. | Glenview | 1,198 | 226,157(0.53%)#29 | 3,471,233(0.03%)#376 |
| 30. | Algonquin | 1,166 | 226,157(0.52%)#30 | 3,471,233(0.03%)#389 |
| 31. | Oak Park | 1,163 | 226,157(0.51%)#31 | 3,471,233(0.03%)#390 |
| 32. | Schaumburg | 1,141 | 226,157(0.50%)#32 | 3,471,233(0.03%)#403 |
| 33. | Champaign | 1,129 | 226,157(0.50%)#33 | 3,471,233(0.03%)#407 |
| 34. | Batavia | 1,129 | 226,157(0.50%)#34 | 3,471,233(0.03%)#410 |
| 35. | Belvidere | 1,126 | 226,157(0.50%)#35 | 3,471,233(0.03%)#413 |
| 36. | Springfield | 1,114 | 226,157(0.49%)#36 | 3,471,233(0.03%)#415 |
| 37. | Skokie | 1,044 | 226,157(0.46%)#37 | 3,471,233(0.03%)#456 |
| 38. | Lombard | 1,039 | 226,157(0.46%)#38 | 3,471,233(0.03%)#462 |
| 39. | Northbrook | 969 | 226,157(0.43%)#39 | 3,471,233(0.03%)#499 |
| 40. | Orland Park | 901 | 226,157(0.40%)#40 | 3,471,233(0.03%)#537 |
| 41. | Geneva | 886 | 226,157(0.39%)#41 | 3,471,233(0.03%)#544 |
| 42. | Bartlett | 881 | 226,157(0.39%)#42 | 3,471,233(0.03%)#549 |
| 43. | Glen Ellyn | 870 | 226,157(0.38%)#43 | 3,471,233(0.03%)#558 |
| 44. | Huntley | 865 | 226,157(0.38%)#44 | 3,471,233(0.02%)#562 |
| 45. | Hoffman Estates | 855 | 226,157(0.38%)#45 | 3,471,233(0.02%)#570 |
| 46. | Poplar Grove | 848 | 226,157(0.37%)#46 | 3,471,233(0.02%)#574 |
| 47. | Plainfield | 845 | 226,157(0.37%)#47 | 3,471,233(0.02%)#576 |
| 48. | Grayslake | 818 | 226,157(0.36%)#48 | 3,471,233(0.02%)#597 |
| 49. | New Lenox | 802 | 226,157(0.35%)#49 | 3,471,233(0.02%)#608 |
| 50. | Mchenry | 791 | 226,157(0.35%)#50 | 3,471,233(0.02%)#622 |
| 51. | Roscoe | 768 | 226,157(0.34%)#51 | 3,471,233(0.02%)#643 |
| 52. | Lockport | 762 | 226,157(0.34%)#52 | 3,471,233(0.02%)#651 |
| 53. | East Moline | 761 | 226,157(0.34%)#53 | 3,471,233(0.02%)#654 |
| 54. | Shorewood | 736 | 226,157(0.33%)#54 | 3,471,233(0.02%)#687 |
| 55. | Mundelein | 711 | 226,157(0.31%)#55 | 3,471,233(0.02%)#712 |
| 56. | Villa Park | 709 | 226,157(0.31%)#56 | 3,471,233(0.02%)#718 |
| 57. | Park Ridge | 688 | 226,157(0.30%)#57 | 3,471,233(0.02%)#741 |
| 58. | Wilmette | 682 | 226,157(0.30%)#58 | 3,471,233(0.02%)#753 |
| 59. | Lake Forest | 680 | 226,157(0.30%)#59 | 3,471,233(0.02%)#759 |
| 60. | Oswego | 678 | 226,157(0.30%)#60 | 3,471,233(0.02%)#761 |
| 61. | South Elgin | 669 | 226,157(0.30%)#61 | 3,471,233(0.02%)#768 |
| 62. | Carol Stream | 660 | 226,157(0.29%)#62 | 3,471,233(0.02%)#776 |
| 63. | Westmont | 657 | 226,157(0.29%)#63 | 3,471,233(0.02%)#780 |
| 64. | Campton Hills | 634 | 226,157(0.28%)#64 | 3,471,233(0.02%)#804 |
| 65. | Lake In The Hills | 633 | 226,157(0.28%)#65 | 3,471,233(0.02%)#805 |
| 66. | Hinsdale | 630 | 226,157(0.28%)#66 | 3,471,233(0.02%)#808 |
| 67. | Deerfield | 622 | 226,157(0.28%)#67 | 3,471,233(0.02%)#821 |
| 68. | Macomb | 615 | 226,157(0.27%)#68 | 3,471,233(0.02%)#836 |
| 69. | Gurnee | 614 | 226,157(0.27%)#69 | 3,471,233(0.02%)#839 |
| 70. | South Beloit | 614 | 226,157(0.27%)#70 | 3,471,233(0.02%)#840 |
| 71. | Oak Lawn | 613 | 226,157(0.27%)#71 | 3,471,233(0.02%)#842 |
| 72. | Silvis | 609 | 226,157(0.27%)#72 | 3,471,233(0.02%)#848 |
| 73. | Carpentersville | 603 | 226,157(0.27%)#73 | 3,471,233(0.02%)#859 |
| 74. | Rolling Meadows | 603 | 226,157(0.27%)#74 | 3,471,233(0.02%)#860 |
| 75. | Woodridge | 591 | 226,157(0.26%)#75 | 3,471,233(0.02%)#884 |
| 76. | River Forest | 580 | 226,157(0.26%)#76 | 3,471,233(0.02%)#902 |
| 77. | Cary | 579 | 226,157(0.26%)#77 | 3,471,233(0.02%)#906 |
| 78. | Elk Grove Village | 573 | 226,157(0.25%)#78 | 3,471,233(0.02%)#918 |
| 79. | Waukegan | 571 | 226,157(0.25%)#79 | 3,471,233(0.02%)#922 |
| 80. | Hawthorn Woods | 558 | 226,157(0.25%)#80 | 3,471,233(0.02%)#943 |
| 81. | Kewanee | 552 | 226,157(0.24%)#81 | 3,471,233(0.02%)#949 |
| 82. | Homer Glen | 551 | 226,157(0.24%)#82 | 3,471,233(0.02%)#952 |
| 83. | Chicago Ridge | 549 | 226,157(0.24%)#83 | 3,471,233(0.02%)#955 |
| 84. | Mokena | 542 | 226,157(0.24%)#84 | 3,471,233(0.02%)#964 |
| 85. | Quincy | 539 | 226,157(0.24%)#85 | 3,471,233(0.02%)#969 |
| 86. | Rockton | 536 | 226,157(0.24%)#86 | 3,471,233(0.02%)#977 |
| 87. | Bourbonnais | 533 | 226,157(0.24%)#87 | 3,471,233(0.02%)#981 |
| 88. | Freeport | 526 | 226,157(0.23%)#88 | 3,471,233(0.02%)#997 |
| 89. | Montgomery | 511 | 226,157(0.23%)#89 | 3,471,233(0.01%)#1,022 |
| 90. | Darien | 496 | 226,157(0.22%)#90 | 3,471,233(0.01%)#1,047 |
| 91. | Streamwood | 493 | 226,157(0.22%)#91 | 3,471,233(0.01%)#1,053 |
| 92. | Lake Zurich | 484 | 226,157(0.21%)#92 | 3,471,233(0.01%)#1,076 |
| 93. | Glendale Heights | 482 | 226,157(0.21%)#93 | 3,471,233(0.01%)#1,079 |
| 94. | Lindenhurst | 481 | 226,157(0.21%)#94 | 3,471,233(0.01%)#1,083 |
| 95. | Bolingbrook | 477 | 226,157(0.21%)#95 | 3,471,233(0.01%)#1,093 |
| 96. | Decatur | 461 | 226,157(0.20%)#96 | 3,471,233(0.01%)#1,127 |
| 97. | Libertyville | 453 | 226,157(0.20%)#97 | 3,471,233(0.01%)#1,150 |
| 98. | Berwyn | 449 | 226,157(0.20%)#98 | 3,471,233(0.01%)#1,159 |
| 99. | Buffalo Grove | 449 | 226,157(0.20%)#99 | 3,471,233(0.01%)#1,160 |
| 100. | Prospect Heights | 447 | 226,157(0.20%)#100 | 3,471,233(0.01%)#1,165 |
Common Questions
What are the Top 10 Cities with the Largest Swedish Community in Illinois?
Top 10 Cities with the Largest Swedish Community in Illinois are:
#1
24,166
#2
8,793
#3
3,663
#4
2,446
#5
2,373
#6
2,121
#7
2,090
#8
2,060
#9
2,017
#10
1,976
What city has the Largest Swedish Community in Illinois?
Chicago has the Largest Swedish Community in Illinois with 24,166.
What is the Total Swedish Population in the State of Illinois?
Total Swedish Population in Illinois is 226,157.
What is the Total Swedish Population in the United States?
Total Swedish Population in the United States is 3,471,233.