Cities with the Most Immigrants from Kenya in Texas
RELATED REPORTS & OPTIONS
Kenya
Texas
Compare Cities
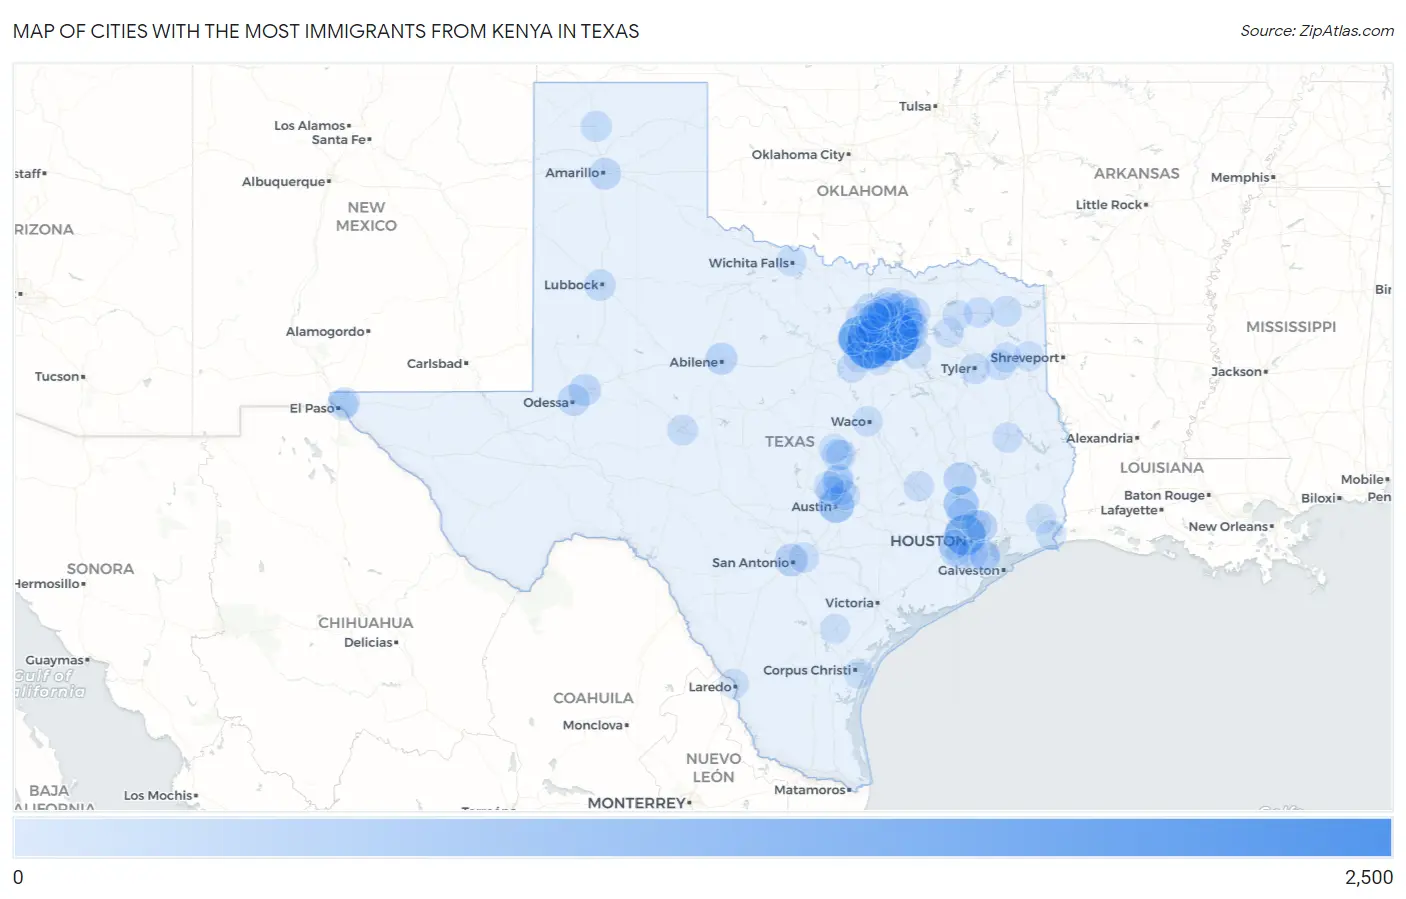
Map of Cities with the Most Immigrants from Kenya in Texas
0
2,500
Cities with the Most Immigrants from Kenya in Texas
| City | Kenya | vs State | vs National | |
| 1. | Dallas | 2,231 | 20,458(10.91%)#1 | 158,590(1.41%)#3 |
| 2. | Arlington | 1,906 | 20,458(9.32%)#2 | 158,590(1.20%)#5 |
| 3. | Fort Worth | 1,429 | 20,458(6.99%)#3 | 158,590(0.90%)#8 |
| 4. | Houston | 1,195 | 20,458(5.84%)#4 | 158,590(0.75%)#15 |
| 5. | Irving | 694 | 20,458(3.39%)#5 | 158,590(0.44%)#35 |
| 6. | Austin | 619 | 20,458(3.03%)#6 | 158,590(0.39%)#37 |
| 7. | Conroe | 574 | 20,458(2.81%)#7 | 158,590(0.36%)#40 |
| 8. | Plano | 432 | 20,458(2.11%)#8 | 158,590(0.27%)#56 |
| 9. | Wylie | 420 | 20,458(2.05%)#9 | 158,590(0.26%)#58 |
| 10. | Mckinney | 333 | 20,458(1.63%)#10 | 158,590(0.21%)#76 |
| 11. | Grand Prairie | 320 | 20,458(1.56%)#11 | 158,590(0.20%)#79 |
| 12. | Euless | 304 | 20,458(1.49%)#12 | 158,590(0.19%)#83 |
| 13. | Huntsville | 289 | 20,458(1.41%)#13 | 158,590(0.18%)#92 |
| 14. | Garland | 284 | 20,458(1.39%)#14 | 158,590(0.18%)#95 |
| 15. | San Antonio | 279 | 20,458(1.36%)#15 | 158,590(0.18%)#100 |
| 16. | Mansfield | 265 | 20,458(1.30%)#16 | 158,590(0.17%)#106 |
| 17. | Lewisville | 239 | 20,458(1.17%)#17 | 158,590(0.15%)#118 |
| 18. | Abilene | 223 | 20,458(1.09%)#18 | 158,590(0.14%)#126 |
| 19. | Atascocita | 210 | 20,458(1.03%)#19 | 158,590(0.13%)#138 |
| 20. | Frisco | 201 | 20,458(0.98%)#20 | 158,590(0.13%)#147 |
| 21. | Midland | 200 | 20,458(0.98%)#21 | 158,590(0.13%)#148 |
| 22. | Odessa | 200 | 20,458(0.98%)#22 | 158,590(0.13%)#149 |
| 23. | Amarillo | 196 | 20,458(0.96%)#23 | 158,590(0.12%)#160 |
| 24. | Desoto | 178 | 20,458(0.87%)#24 | 158,590(0.11%)#178 |
| 25. | Richardson | 177 | 20,458(0.87%)#25 | 158,590(0.11%)#180 |
| 26. | Addison | 160 | 20,458(0.78%)#26 | 158,590(0.10%)#201 |
| 27. | Lubbock | 142 | 20,458(0.69%)#27 | 158,590(0.09%)#231 |
| 28. | Killeen | 140 | 20,458(0.68%)#28 | 158,590(0.09%)#237 |
| 29. | Sienna | 135 | 20,458(0.66%)#29 | 158,590(0.09%)#240 |
| 30. | Princeton | 125 | 20,458(0.61%)#30 | 158,590(0.08%)#256 |
| 31. | Carrollton | 123 | 20,458(0.60%)#31 | 158,590(0.08%)#259 |
| 32. | Farmers Branch | 121 | 20,458(0.59%)#32 | 158,590(0.08%)#266 |
| 33. | Dumas | 93 | 20,458(0.45%)#33 | 158,590(0.06%)#330 |
| 34. | Denton | 91 | 20,458(0.44%)#34 | 158,590(0.06%)#334 |
| 35. | The Colony | 91 | 20,458(0.44%)#35 | 158,590(0.06%)#336 |
| 36. | Omaha | 88 | 20,458(0.43%)#36 | 158,590(0.06%)#347 |
| 37. | Justin | 87 | 20,458(0.43%)#37 | 158,590(0.05%)#351 |
| 38. | Flower Mound | 83 | 20,458(0.41%)#38 | 158,590(0.05%)#361 |
| 39. | Melissa | 81 | 20,458(0.40%)#39 | 158,590(0.05%)#368 |
| 40. | Keller | 78 | 20,458(0.38%)#40 | 158,590(0.05%)#373 |
| 41. | Hurst | 76 | 20,458(0.37%)#41 | 158,590(0.05%)#381 |
| 42. | Round Rock | 74 | 20,458(0.36%)#42 | 158,590(0.05%)#388 |
| 43. | The Woodlands | 72 | 20,458(0.35%)#43 | 158,590(0.05%)#396 |
| 44. | Tyler | 70 | 20,458(0.34%)#44 | 158,590(0.04%)#402 |
| 45. | San Angelo | 67 | 20,458(0.33%)#45 | 158,590(0.04%)#420 |
| 46. | Haltom City | 67 | 20,458(0.33%)#46 | 158,590(0.04%)#423 |
| 47. | Travis Ranch | 67 | 20,458(0.33%)#47 | 158,590(0.04%)#425 |
| 48. | Little Elm | 64 | 20,458(0.31%)#48 | 158,590(0.04%)#435 |
| 49. | Missouri City | 62 | 20,458(0.30%)#49 | 158,590(0.04%)#450 |
| 50. | Sugar Land | 59 | 20,458(0.29%)#50 | 158,590(0.04%)#471 |
| 51. | Georgetown | 59 | 20,458(0.29%)#51 | 158,590(0.04%)#473 |
| 52. | El Paso | 55 | 20,458(0.27%)#52 | 158,590(0.03%)#494 |
| 53. | Grapevine | 55 | 20,458(0.27%)#53 | 158,590(0.03%)#498 |
| 54. | Pearland | 48 | 20,458(0.23%)#54 | 158,590(0.03%)#547 |
| 55. | Bedford | 48 | 20,458(0.23%)#55 | 158,590(0.03%)#551 |
| 56. | League City | 47 | 20,458(0.23%)#56 | 158,590(0.03%)#559 |
| 57. | Allen | 46 | 20,458(0.22%)#57 | 158,590(0.03%)#564 |
| 58. | College Station | 44 | 20,458(0.22%)#58 | 158,590(0.03%)#583 |
| 59. | Kilgore | 43 | 20,458(0.21%)#59 | 158,590(0.03%)#598 |
| 60. | Celina | 40 | 20,458(0.20%)#60 | 158,590(0.03%)#639 |
| 61. | Rowlett | 38 | 20,458(0.19%)#61 | 158,590(0.02%)#659 |
| 62. | Cleburne | 35 | 20,458(0.17%)#62 | 158,590(0.02%)#700 |
| 63. | Webster | 34 | 20,458(0.17%)#63 | 158,590(0.02%)#713 |
| 64. | Fort Bliss | 33 | 20,458(0.16%)#64 | 158,590(0.02%)#720 |
| 65. | Converse | 32 | 20,458(0.16%)#65 | 158,590(0.02%)#731 |
| 66. | Cedar Park | 31 | 20,458(0.15%)#66 | 158,590(0.02%)#741 |
| 67. | Burleson | 30 | 20,458(0.15%)#67 | 158,590(0.02%)#754 |
| 68. | Waco | 29 | 20,458(0.14%)#68 | 158,590(0.02%)#762 |
| 69. | Beaumont | 29 | 20,458(0.14%)#69 | 158,590(0.02%)#763 |
| 70. | Longview | 26 | 20,458(0.13%)#70 | 158,590(0.02%)#824 |
| 71. | Lufkin | 26 | 20,458(0.13%)#71 | 158,590(0.02%)#832 |
| 72. | Lavon | 26 | 20,458(0.13%)#72 | 158,590(0.02%)#841 |
| 73. | Mount Vernon | 26 | 20,458(0.13%)#73 | 158,590(0.02%)#842 |
| 74. | Southlake | 25 | 20,458(0.12%)#74 | 158,590(0.02%)#850 |
| 75. | Mission Bend | 24 | 20,458(0.12%)#75 | 158,590(0.02%)#865 |
| 76. | Farmersville | 24 | 20,458(0.12%)#76 | 158,590(0.02%)#876 |
| 77. | Pflugerville | 23 | 20,458(0.11%)#77 | 158,590(0.01%)#881 |
| 78. | Wichita Falls | 22 | 20,458(0.11%)#78 | 158,590(0.01%)#893 |
| 79. | Humble | 22 | 20,458(0.11%)#79 | 158,590(0.01%)#900 |
| 80. | Harker Heights | 21 | 20,458(0.10%)#80 | 158,590(0.01%)#913 |
| 81. | Fate | 21 | 20,458(0.10%)#81 | 158,590(0.01%)#919 |
| 82. | Oak Point | 20 | 20,458(0.10%)#82 | 158,590(0.01%)#942 |
| 83. | Port Arthur | 19 | 20,458(0.09%)#83 | 158,590(0.01%)#955 |
| 84. | Prosper | 19 | 20,458(0.09%)#84 | 158,590(0.01%)#962 |
| 85. | Serenada | 18 | 20,458(0.09%)#85 | 158,590(0.01%)#997 |
| 86. | White Settlement | 17 | 20,458(0.08%)#86 | 158,590(0.01%)#1,014 |
| 87. | Fort Hood | 16 | 20,458(0.08%)#87 | 158,590(0.01%)#1,046 |
| 88. | Emory | 16 | 20,458(0.08%)#88 | 158,590(0.01%)#1,062 |
| 89. | Hackberry | 15 | 20,458(0.07%)#89 | 158,590(0.01%)#1,094 |
| 90. | Corinth | 12 | 20,458(0.06%)#90 | 158,590(0.01%)#1,166 |
| 91. | Marshall | 11 | 20,458(0.05%)#91 | 158,590(0.01%)#1,195 |
| 92. | Beeville | 10 | 20,458(0.05%)#92 | 158,590(0.01%)#1,228 |
| 93. | Leander | 8 | 20,458(0.04%)#93 | 158,590(0.01%)#1,271 |
| 94. | Midlothian | 8 | 20,458(0.04%)#94 | 158,590(0.01%)#1,279 |
| 95. | Sulphur Springs | 8 | 20,458(0.04%)#95 | 158,590(0.01%)#1,288 |
| 96. | Kaufman | 8 | 20,458(0.04%)#96 | 158,590(0.01%)#1,295 |
| 97. | Corpus Christi | 6 | 20,458(0.03%)#97 | 158,590(0.00%)#1,357 |
| 98. | Mclendon Chisholm | 6 | 20,458(0.03%)#98 | 158,590(0.00%)#1,390 |
| 99. | Highland Village | 5 | 20,458(0.02%)#99 | 158,590(0.00%)#1,407 |
| 100. | Laredo | 3 | 20,458(0.01%)#100 | 158,590(0.00%)#1,452 |
Common Questions
What are the Top 10 Cities with the Most Immigrants from Kenya in Texas?
Top 10 Cities with the Most Immigrants from Kenya in Texas are:
What city has the Most Immigrants from Kenya in Texas?
Dallas has the Most Immigrants from Kenya in Texas with 2,231.
What is the Total Immigrants from Kenya in the State of Texas?
Total Immigrants from Kenya in Texas is 20,458.
What is the Total Immigrants from Kenya in the United States?
Total Immigrants from Kenya in the United States is 158,590.