Cities with the Most Immigrants from Kenya in Pennsylvania
RELATED REPORTS & OPTIONS
Kenya
Pennsylvania
Compare Cities
Map of Cities with the Most Immigrants from Kenya in Pennsylvania
0
500
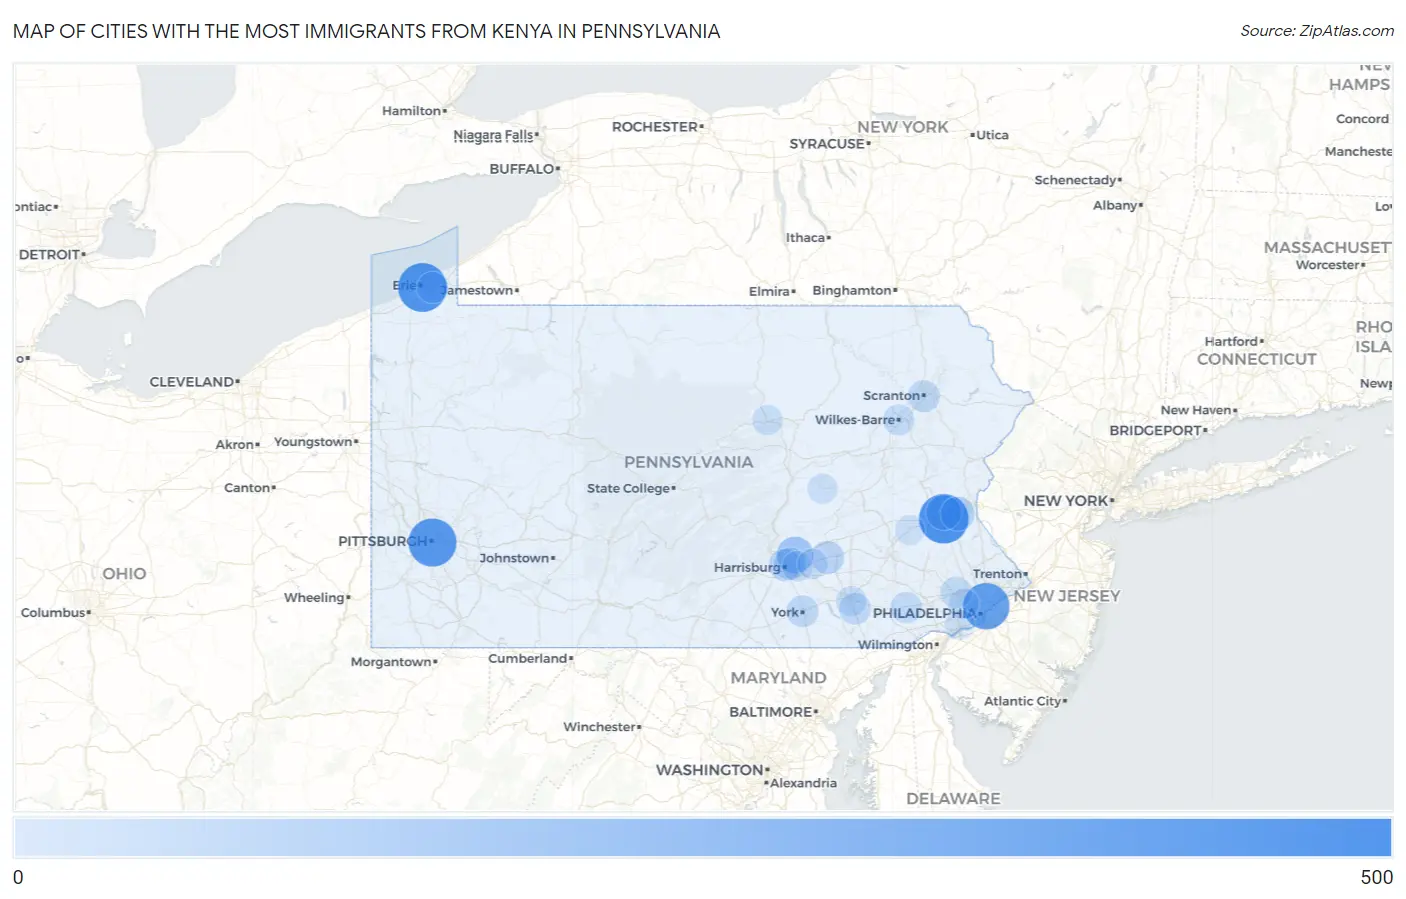
Cities with the Most Immigrants from Kenya in Pennsylvania
| City | Kenya | vs State | vs National | |
| 1. | Allentown | 456 | 4,946(9.22%)#1 | 158,590(0.29%)#51 |
| 2. | Erie | 440 | 4,946(8.90%)#2 | 158,590(0.28%)#54 |
| 3. | Pittsburgh | 419 | 4,946(8.47%)#3 | 158,590(0.26%)#59 |
| 4. | Philadelphia | 383 | 4,946(7.74%)#4 | 158,590(0.24%)#67 |
| 5. | Linglestown | 147 | 4,946(2.97%)#5 | 158,590(0.09%)#221 |
| 6. | Fullerton | 110 | 4,946(2.22%)#6 | 158,590(0.07%)#288 |
| 7. | Crafton Borough | 110 | 4,946(2.22%)#7 | 158,590(0.07%)#289 |
| 8. | Bethlehem | 86 | 4,946(1.74%)#8 | 158,590(0.05%)#353 |
| 9. | Lansdowne Borough | 68 | 4,946(1.37%)#9 | 158,590(0.04%)#417 |
| 10. | Annville | 63 | 4,946(1.27%)#10 | 158,590(0.04%)#448 |
| 11. | New Britain Borough | 62 | 4,946(1.25%)#11 | 158,590(0.04%)#455 |
| 12. | Elizabethtown Borough | 56 | 4,946(1.13%)#12 | 158,590(0.04%)#490 |
| 13. | Hayti | 56 | 4,946(1.13%)#13 | 158,590(0.04%)#493 |
| 14. | Harrisburg | 49 | 4,946(0.99%)#14 | 158,590(0.03%)#541 |
| 15. | Progress | 49 | 4,946(0.99%)#15 | 158,590(0.03%)#544 |
| 16. | Scranton | 40 | 4,946(0.81%)#16 | 158,590(0.03%)#634 |
| 17. | Red Lion Borough | 40 | 4,946(0.81%)#17 | 158,590(0.03%)#641 |
| 18. | York | 39 | 4,946(0.79%)#18 | 158,590(0.02%)#647 |
| 19. | Pottstown Borough | 37 | 4,946(0.75%)#19 | 158,590(0.02%)#679 |
| 20. | Darby Borough | 36 | 4,946(0.73%)#20 | 158,590(0.02%)#690 |
| 21. | Willow Street | 36 | 4,946(0.73%)#21 | 158,590(0.02%)#691 |
| 22. | King Of Prussia | 33 | 4,946(0.67%)#22 | 158,590(0.02%)#718 |
| 23. | Sayre Borough | 33 | 4,946(0.67%)#23 | 158,590(0.02%)#722 |
| 24. | Dover Borough | 31 | 4,946(0.63%)#24 | 158,590(0.02%)#750 |
| 25. | Downingtown Borough | 29 | 4,946(0.59%)#25 | 158,590(0.02%)#778 |
| 26. | Coatesville | 27 | 4,946(0.55%)#26 | 158,590(0.02%)#817 |
| 27. | Chestnut Hill | 26 | 4,946(0.53%)#27 | 158,590(0.02%)#840 |
| 28. | Penn State Erie Behrend | 24 | 4,946(0.49%)#28 | 158,590(0.02%)#877 |
| 29. | Carlisle Borough | 21 | 4,946(0.42%)#29 | 158,590(0.01%)#916 |
| 30. | Athens Borough | 21 | 4,946(0.42%)#30 | 158,590(0.01%)#926 |
| 31. | Wilkes Barre | 20 | 4,946(0.40%)#31 | 158,590(0.01%)#933 |
| 32. | Jenkintown Borough | 20 | 4,946(0.40%)#32 | 158,590(0.01%)#943 |
| 33. | Baldwin Borough | 19 | 4,946(0.38%)#33 | 158,590(0.01%)#965 |
| 34. | Gettysburg Borough | 18 | 4,946(0.36%)#34 | 158,590(0.01%)#993 |
| 35. | Mont Clare | 17 | 4,946(0.34%)#35 | 158,590(0.01%)#1,027 |
| 36. | West Chester Borough | 12 | 4,946(0.24%)#36 | 158,590(0.01%)#1,168 |
| 37. | Baden Borough | 12 | 4,946(0.24%)#37 | 158,590(0.01%)#1,175 |
| 38. | Rosemont | 12 | 4,946(0.24%)#38 | 158,590(0.01%)#1,176 |
| 39. | Langhorne Manor Borough | 12 | 4,946(0.24%)#39 | 158,590(0.01%)#1,179 |
| 40. | Wyomissing Borough | 11 | 4,946(0.22%)#40 | 158,590(0.01%)#1,202 |
| 41. | Rutherford | 11 | 4,946(0.22%)#41 | 158,590(0.01%)#1,206 |
| 42. | Bryn Mawr | 10 | 4,946(0.20%)#42 | 158,590(0.01%)#1,233 |
| 43. | Bowmanstown Borough | 8 | 4,946(0.16%)#43 | 158,590(0.01%)#1,304 |
| 44. | Lancaster | 7 | 4,946(0.14%)#44 | 158,590(0.00%)#1,312 |
| 45. | Norwood Borough | 7 | 4,946(0.14%)#45 | 158,590(0.00%)#1,346 |
| 46. | Indiana Borough | 6 | 4,946(0.12%)#46 | 158,590(0.00%)#1,382 |
| 47. | Swissvale Borough | 6 | 4,946(0.12%)#47 | 158,590(0.00%)#1,386 |
| 48. | Shiremanstown Borough | 5 | 4,946(0.10%)#48 | 158,590(0.00%)#1,418 |
| 49. | Williamsport | 4 | 4,946(0.08%)#49 | 158,590(0.00%)#1,432 |
| 50. | Hershey | 4 | 4,946(0.08%)#50 | 158,590(0.00%)#1,435 |
| 51. | Woodlyn | 3 | 4,946(0.06%)#51 | 158,590(0.00%)#1,461 |
| 52. | East Washington Borough | 3 | 4,946(0.06%)#52 | 158,590(0.00%)#1,473 |
| 53. | Glendon Borough | 3 | 4,946(0.06%)#53 | 158,590(0.00%)#1,484 |
| 54. | Ambridge Borough | 2 | 4,946(0.04%)#54 | 158,590(0.00%)#1,498 |
| 55. | Shamokin | 1 | 4,946(0.02%)#55 | 158,590(0.00%)#1,534 |
| 56. | Kutztown University | 1 | 4,946(0.02%)#56 | 158,590(0.00%)#1,535 |
| 57. | Burgettstown Borough | 1 | 4,946(0.02%)#57 | 158,590(0.00%)#1,539 |
Common Questions
What are the Top 10 Cities with the Most Immigrants from Kenya in Pennsylvania?
Top 10 Cities with the Most Immigrants from Kenya in Pennsylvania are:
#1
456
#2
440
#3
419
#4
383
#5
147
#6
110
#7
86
#8
63
#9
49
#10
49
What city has the Most Immigrants from Kenya in Pennsylvania?
Allentown has the Most Immigrants from Kenya in Pennsylvania with 456.
What is the Total Immigrants from Kenya in the State of Pennsylvania?
Total Immigrants from Kenya in Pennsylvania is 4,946.
What is the Total Immigrants from Kenya in the United States?
Total Immigrants from Kenya in the United States is 158,590.