Cities with the Highest Unemployment Rate in Illinois
RELATED REPORTS & OPTIONS
Highest Unemployment
Illinois
Compare Cities
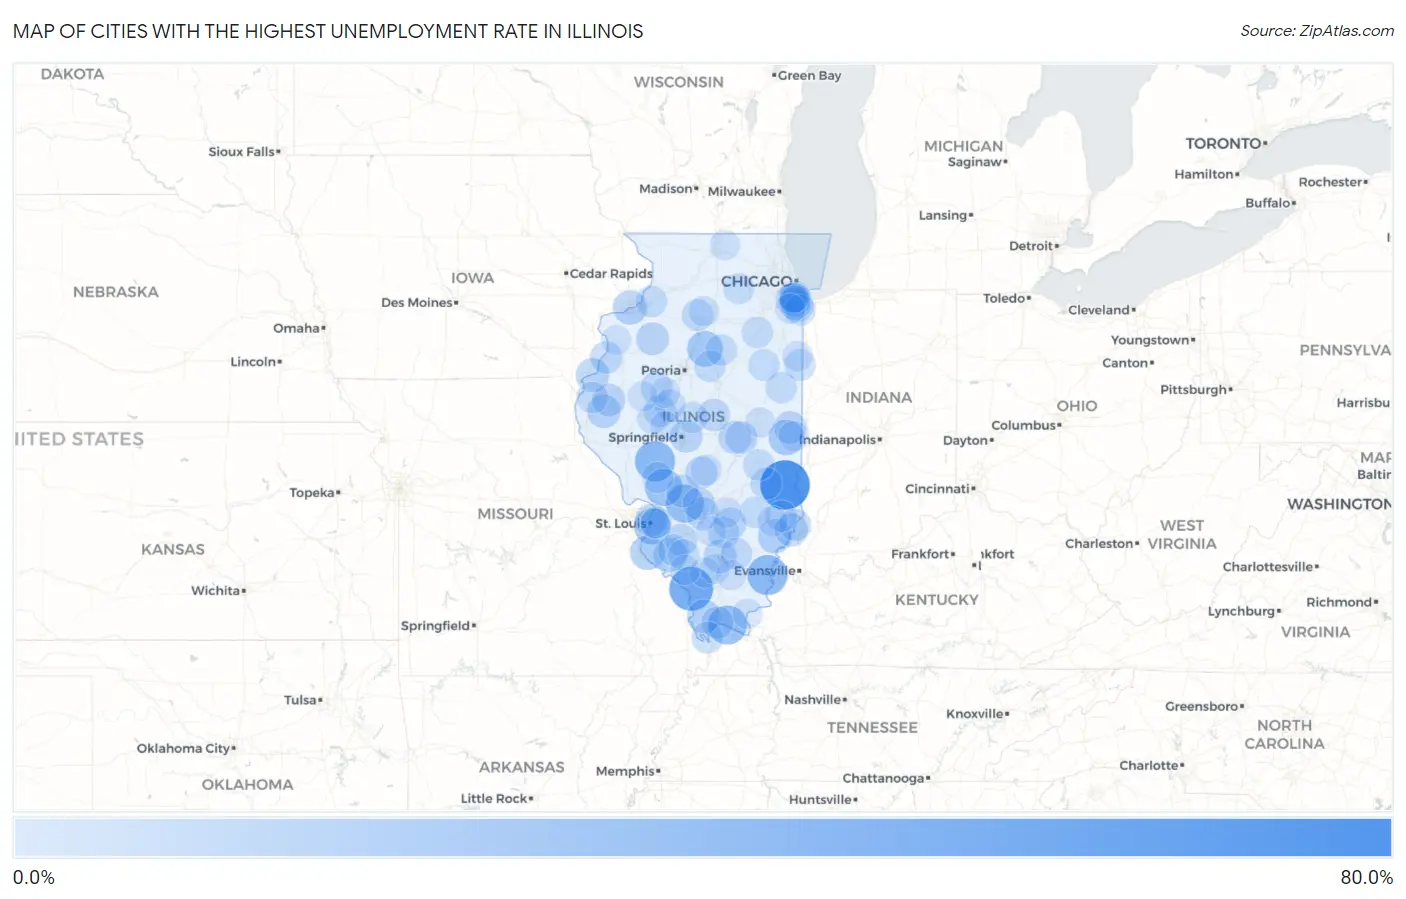
Map of Cities with the Highest Unemployment Rate in Illinois
0.0%
80.0%
Cities with the Highest Unemployment Rate in Illinois
| City | Unemployment Rate | vs State | vs National | |
| 1. | Annapolis | 66.7% | 5.6%(+61.1)#1 | 5.0%(+61.7)#71 |
| 2. | Gorham | 50.4% | 5.6%(+44.8)#2 | 5.0%(+45.4)#155 |
| 3. | Lowpoint | 40.7% | 5.6%(+35.1)#3 | 5.0%(+35.7)#249 |
| 4. | New Haven | 40.0% | 5.6%(+34.4)#4 | 5.0%(+35.0)#259 |
| 5. | Scottville | 40.0% | 5.6%(+34.4)#5 | 5.0%(+35.0)#260 |
| 6. | Joppa | 37.2% | 5.6%(+31.6)#6 | 5.0%(+32.2)#306 |
| 7. | Serena | 36.0% | 5.6%(+30.4)#7 | 5.0%(+31.0)#327 |
| 8. | Old Ripley | 35.0% | 5.6%(+29.4)#8 | 5.0%(+30.0)#356 |
| 9. | Royal Lakes | 32.4% | 5.6%(+26.8)#9 | 5.0%(+27.4)#421 |
| 10. | Sauget | 30.6% | 5.6%(+25.0)#10 | 5.0%(+25.6)#473 |
| 11. | Andres | 29.0% | 5.6%(+23.4)#11 | 5.0%(+24.0)#542 |
| 12. | La Rose | 27.9% | 5.6%(+22.3)#12 | 5.0%(+22.9)#589 |
| 13. | Metcalf | 27.1% | 5.6%(+21.5)#13 | 5.0%(+22.1)#637 |
| 14. | Maeystown | 25.7% | 5.6%(+20.1)#14 | 5.0%(+20.7)#702 |
| 15. | Rock Island Arsenal | 23.9% | 5.6%(+18.3)#15 | 5.0%(+18.9)#823 |
| 16. | Bone Gap | 23.7% | 5.6%(+18.1)#16 | 5.0%(+18.7)#840 |
| 17. | Burtons Bridge | 23.5% | 5.6%(+17.9)#17 | 5.0%(+18.5)#851 |
| 18. | Baldwin | 22.7% | 5.6%(+17.1)#18 | 5.0%(+17.7)#910 |
| 19. | La Prairie | 22.2% | 5.6%(+16.6)#19 | 5.0%(+17.2)#947 |
| 20. | Mill Creek | 22.2% | 5.6%(+16.6)#20 | 5.0%(+17.2)#949 |
| 21. | Pontoosuc | 22.0% | 5.6%(+16.4)#21 | 5.0%(+17.0)#967 |
| 22. | Phoenix | 21.5% | 5.6%(+15.9)#22 | 5.0%(+16.5)#1,013 |
| 23. | Nason | 21.2% | 5.6%(+15.6)#23 | 5.0%(+16.2)#1,052 |
| 24. | Allendale | 21.0% | 5.6%(+15.4)#24 | 5.0%(+16.0)#1,065 |
| 25. | Laplace | 20.6% | 5.6%(+15.0)#25 | 5.0%(+15.6)#1,108 |
| 26. | Barstow | 20.6% | 5.6%(+15.0)#26 | 5.0%(+15.6)#1,110 |
| 27. | Altona | 20.3% | 5.6%(+14.7)#27 | 5.0%(+15.3)#1,136 |
| 28. | Plymouth | 20.3% | 5.6%(+14.7)#28 | 5.0%(+15.3)#1,138 |
| 29. | Clear Lake | 20.1% | 5.6%(+14.5)#29 | 5.0%(+15.1)#1,163 |
| 30. | Indianola | 20.0% | 5.6%(+14.4)#30 | 5.0%(+15.0)#1,181 |
| 31. | Venice | 19.8% | 5.6%(+14.2)#31 | 5.0%(+14.8)#1,210 |
| 32. | Keyesport | 19.7% | 5.6%(+14.1)#32 | 5.0%(+14.7)#1,225 |
| 33. | Walshville | 19.4% | 5.6%(+13.8)#33 | 5.0%(+14.4)#1,278 |
| 34. | Iuka | 19.3% | 5.6%(+13.7)#34 | 5.0%(+14.3)#1,286 |
| 35. | Hammond | 19.1% | 5.6%(+13.5)#35 | 5.0%(+14.1)#1,316 |
| 36. | Gladstone | 19.0% | 5.6%(+13.4)#36 | 5.0%(+14.0)#1,338 |
| 37. | Kenney | 18.9% | 5.6%(+13.3)#37 | 5.0%(+13.9)#1,351 |
| 38. | Smithboro | 18.9% | 5.6%(+13.3)#38 | 5.0%(+13.9)#1,357 |
| 39. | Venedy | 18.8% | 5.6%(+13.2)#39 | 5.0%(+13.8)#1,367 |
| 40. | Unity | 18.8% | 5.6%(+13.2)#40 | 5.0%(+13.8)#1,369 |
| 41. | St Francisville | 18.5% | 5.6%(+12.9)#41 | 5.0%(+13.5)#1,399 |
| 42. | New Grand Chain | 18.5% | 5.6%(+12.9)#42 | 5.0%(+13.5)#1,404 |
| 43. | Carman | 18.4% | 5.6%(+12.8)#43 | 5.0%(+13.4)#1,413 |
| 44. | Wenonah | 18.2% | 5.6%(+12.6)#44 | 5.0%(+13.2)#1,455 |
| 45. | Kilbourne | 18.1% | 5.6%(+12.5)#45 | 5.0%(+13.1)#1,465 |
| 46. | Cairo | 17.9% | 5.6%(+12.3)#46 | 5.0%(+12.9)#1,487 |
| 47. | Bryant | 17.8% | 5.6%(+12.2)#47 | 5.0%(+12.8)#1,517 |
| 48. | Hidalgo | 17.8% | 5.6%(+12.2)#48 | 5.0%(+12.8)#1,518 |
| 49. | Kell | 17.7% | 5.6%(+12.1)#49 | 5.0%(+12.7)#1,529 |
| 50. | Glenwood | 17.4% | 5.6%(+11.8)#50 | 5.0%(+12.4)#1,557 |
| 51. | East Hazel Crest | 17.2% | 5.6%(+11.6)#51 | 5.0%(+12.2)#1,596 |
| 52. | Dahlgren | 17.2% | 5.6%(+11.6)#52 | 5.0%(+12.2)#1,597 |
| 53. | Malden | 17.2% | 5.6%(+11.6)#53 | 5.0%(+12.2)#1,600 |
| 54. | Ritchie | 17.2% | 5.6%(+11.6)#54 | 5.0%(+12.2)#1,604 |
| 55. | Marissa | 17.1% | 5.6%(+11.5)#55 | 5.0%(+12.1)#1,612 |
| 56. | Piper City | 17.1% | 5.6%(+11.5)#56 | 5.0%(+12.1)#1,615 |
| 57. | Coulterville | 16.9% | 5.6%(+11.3)#57 | 5.0%(+11.9)#1,644 |
| 58. | Hillsdale | 16.9% | 5.6%(+11.3)#58 | 5.0%(+11.9)#1,646 |
| 59. | Rankin | 16.9% | 5.6%(+11.3)#59 | 5.0%(+11.9)#1,648 |
| 60. | Calumet Park | 16.8% | 5.6%(+11.2)#60 | 5.0%(+11.8)#1,661 |
| 61. | Secor | 16.8% | 5.6%(+11.2)#61 | 5.0%(+11.8)#1,682 |
| 62. | Sumner | 16.7% | 5.6%(+11.1)#62 | 5.0%(+11.7)#1,692 |
| 63. | Sheldon | 16.7% | 5.6%(+11.1)#63 | 5.0%(+11.7)#1,693 |
| 64. | Dana | 16.7% | 5.6%(+11.1)#64 | 5.0%(+11.7)#1,709 |
| 65. | Sailor Springs | 16.7% | 5.6%(+11.1)#65 | 5.0%(+11.7)#1,713 |
| 66. | Basco | 16.7% | 5.6%(+11.1)#66 | 5.0%(+11.7)#1,714 |
| 67. | Washington Park | 16.5% | 5.6%(+10.9)#67 | 5.0%(+11.5)#1,731 |
| 68. | Riverdale | 16.4% | 5.6%(+10.8)#68 | 5.0%(+11.4)#1,746 |
| 69. | Gardner | 16.4% | 5.6%(+10.8)#69 | 5.0%(+11.4)#1,751 |
| 70. | Lerna | 16.3% | 5.6%(+10.7)#70 | 5.0%(+11.3)#1,778 |
| 71. | Robbins | 16.2% | 5.6%(+10.6)#71 | 5.0%(+11.2)#1,783 |
| 72. | Chesterfield | 16.1% | 5.6%(+10.5)#72 | 5.0%(+11.1)#1,825 |
| 73. | Broadwell | 16.1% | 5.6%(+10.5)#73 | 5.0%(+11.1)#1,829 |
| 74. | Sauk Village | 15.6% | 5.6%(+10.00)#74 | 5.0%(+10.6)#1,910 |
| 75. | Easton | 15.6% | 5.6%(+10.00)#75 | 5.0%(+10.6)#1,928 |
| 76. | Hinckley | 15.5% | 5.6%(+9.90)#76 | 5.0%(+10.5)#1,939 |
| 77. | Harvey | 15.1% | 5.6%(+9.50)#77 | 5.0%(+10.1)#2,036 |
| 78. | Ohlman | 15.0% | 5.6%(+9.40)#78 | 5.0%(+10.00)#2,088 |
| 79. | Chandlerville | 14.8% | 5.6%(+9.20)#79 | 5.0%(+9.80)#2,121 |
| 80. | Kinmundy | 14.4% | 5.6%(+8.80)#80 | 5.0%(+9.40)#2,204 |
| 81. | Donovan | 14.4% | 5.6%(+8.80)#81 | 5.0%(+9.40)#2,212 |
| 82. | Dewey | 14.3% | 5.6%(+8.70)#82 | 5.0%(+9.30)#2,237 |
| 83. | Chrisman | 14.1% | 5.6%(+8.50)#83 | 5.0%(+9.10)#2,279 |
| 84. | Goofy Ridge | 14.0% | 5.6%(+8.40)#84 | 5.0%(+9.00)#2,316 |
| 85. | Calhoun | 14.0% | 5.6%(+8.40)#85 | 5.0%(+9.00)#2,319 |
| 86. | Blue Island | 13.8% | 5.6%(+8.20)#86 | 5.0%(+8.80)#2,349 |
| 87. | Arlington | 13.8% | 5.6%(+8.20)#87 | 5.0%(+8.80)#2,374 |
| 88. | Golconda | 13.7% | 5.6%(+8.10)#88 | 5.0%(+8.70)#2,389 |
| 89. | Dowell | 13.7% | 5.6%(+8.10)#89 | 5.0%(+8.70)#2,393 |
| 90. | Matteson | 13.5% | 5.6%(+7.90)#90 | 5.0%(+8.50)#2,430 |
| 91. | Willisville | 13.5% | 5.6%(+7.90)#91 | 5.0%(+8.50)#2,451 |
| 92. | Timberlane | 13.4% | 5.6%(+7.80)#92 | 5.0%(+8.40)#2,471 |
| 93. | Thompsonville | 13.4% | 5.6%(+7.80)#93 | 5.0%(+8.40)#2,484 |
| 94. | Ipava | 13.3% | 5.6%(+7.70)#94 | 5.0%(+8.30)#2,509 |
| 95. | Seaton | 13.3% | 5.6%(+7.70)#95 | 5.0%(+8.30)#2,515 |
| 96. | Centralia | 13.2% | 5.6%(+7.60)#96 | 5.0%(+8.20)#2,531 |
| 97. | North City | 13.2% | 5.6%(+7.60)#97 | 5.0%(+8.20)#2,549 |
| 98. | Tallula | 13.2% | 5.6%(+7.60)#98 | 5.0%(+8.20)#2,551 |
| 99. | East St Louis | 13.1% | 5.6%(+7.50)#99 | 5.0%(+8.10)#2,565 |
| 100. | Tolono | 13.1% | 5.6%(+7.50)#100 | 5.0%(+8.10)#2,571 |
Common Questions
What are the Top 10 Cities with the Highest Unemployment Rate in Illinois?
Top 10 Cities with the Highest Unemployment Rate in Illinois are:
#1
66.7%
#2
50.4%
#3
40.0%
#4
40.0%
#5
37.2%
#6
35.0%
#7
32.4%
#8
30.6%
#9
27.9%
#10
27.1%
What city has the Highest Unemployment Rate in Illinois?
Annapolis has the Highest Unemployment Rate in Illinois with 66.7%.
What is the Unemployment Rate in the State of Illinois?
Unemployment Rate in Illinois is 5.6%.
What is the Unemployment Rate in the United States?
Unemployment Rate in the United States is 5.0%.