Cities with the Highest Unemployment Rate in Oklahoma
RELATED REPORTS & OPTIONS
Highest Unemployment
Oklahoma
Compare Cities
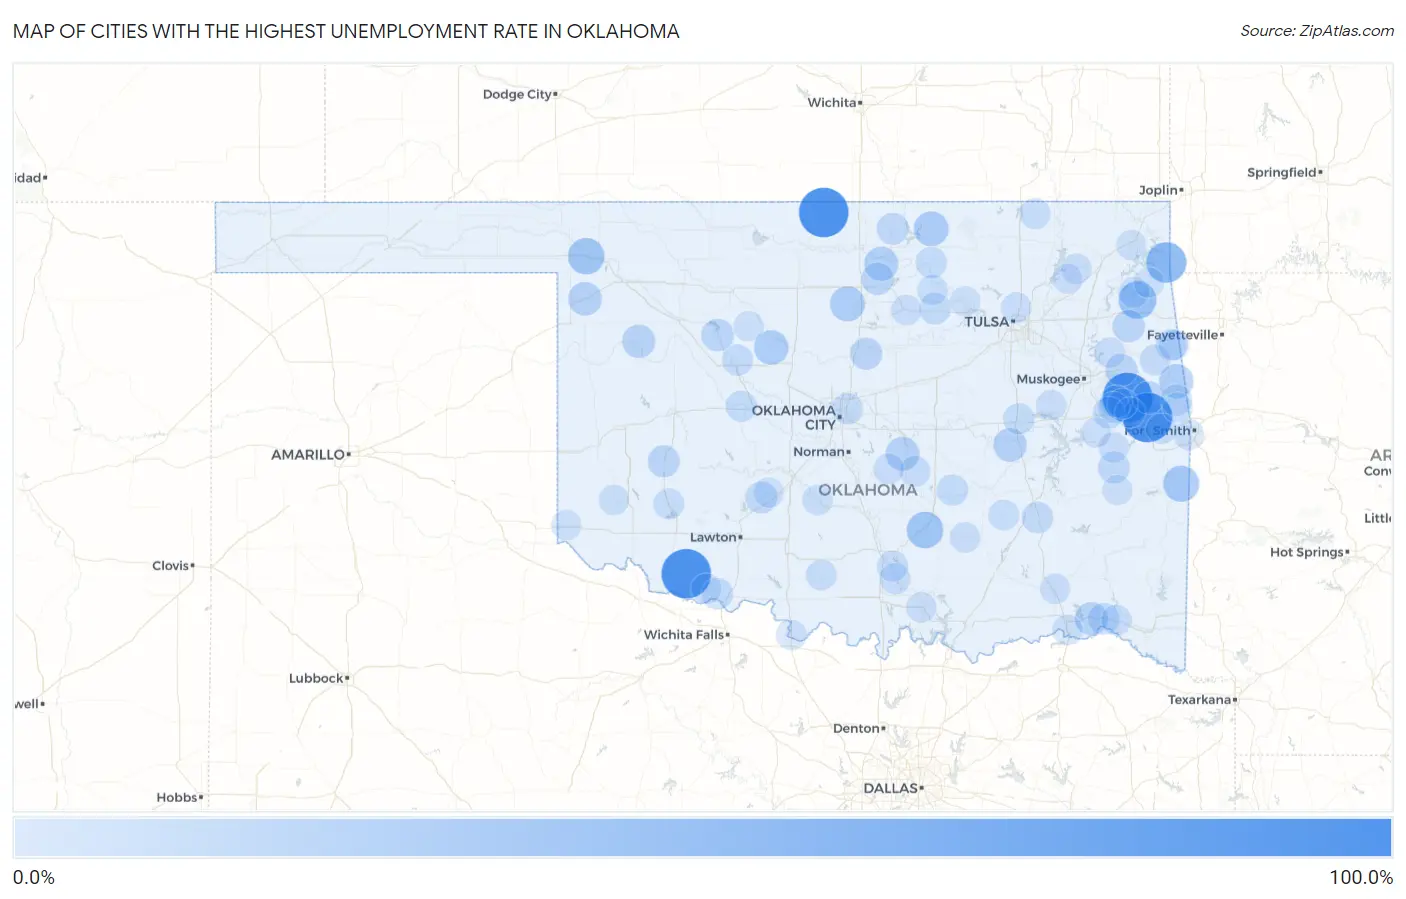
Map of Cities with the Highest Unemployment Rate in Oklahoma
0.0%
100.0%
Cities with the Highest Unemployment Rate in Oklahoma
| City | Unemployment Rate | vs State | vs National | |
| 1. | Blackgum | 100.0% | 4.6%(+95.4)#1 | 5.0%(+95.0)#24 |
| 2. | Renfrow | 100.0% | 4.6%(+95.4)#2 | 5.0%(+95.0)#25 |
| 3. | Badger Lee | 100.0% | 4.6%(+95.4)#3 | 5.0%(+95.0)#26 |
| 4. | Hollister | 100.0% | 4.6%(+95.4)#4 | 5.0%(+95.0)#28 |
| 5. | Dodge | 56.5% | 4.6%(+51.9)#5 | 5.0%(+51.5)#112 |
| 6. | Bull Hollow | 45.3% | 4.6%(+40.7)#6 | 5.0%(+40.3)#203 |
| 7. | Fitzhugh | 38.9% | 4.6%(+34.3)#7 | 5.0%(+33.9)#279 |
| 8. | May | 38.5% | 4.6%(+33.9)#8 | 5.0%(+33.5)#287 |
| 9. | Monroe | 37.1% | 4.6%(+32.5)#9 | 5.0%(+32.1)#308 |
| 10. | Leonard | 35.1% | 4.6%(+30.5)#10 | 5.0%(+30.1)#353 |
| 11. | Lucien | 31.8% | 4.6%(+27.2)#11 | 5.0%(+26.8)#436 |
| 12. | Webb City | 31.3% | 4.6%(+26.7)#12 | 5.0%(+26.3)#452 |
| 13. | Loyal | 29.5% | 4.6%(+24.9)#13 | 5.0%(+24.5)#515 |
| 14. | Little Rock | 29.2% | 4.6%(+24.6)#14 | 5.0%(+24.2)#532 |
| 15. | Bell | 29.0% | 4.6%(+24.4)#15 | 5.0%(+24.0)#540 |
| 16. | Marland | 27.8% | 4.6%(+23.2)#16 | 5.0%(+22.8)#593 |
| 17. | Brooksville | 26.1% | 4.6%(+21.5)#17 | 5.0%(+21.1)#685 |
| 18. | Golden | 25.9% | 4.6%(+21.3)#18 | 5.0%(+20.9)#695 |
| 19. | Gage | 25.5% | 4.6%(+20.9)#19 | 5.0%(+20.5)#710 |
| 20. | Dustin | 25.3% | 4.6%(+20.7)#20 | 5.0%(+20.3)#723 |
| 21. | Enterprise | 24.3% | 4.6%(+19.7)#21 | 5.0%(+19.3)#797 |
| 22. | Camargo | 23.8% | 4.6%(+19.2)#22 | 5.0%(+18.8)#833 |
| 23. | Fort Towson | 23.4% | 4.6%(+18.8)#23 | 5.0%(+18.4)#861 |
| 24. | Reagan | 22.2% | 4.6%(+17.6)#24 | 5.0%(+17.2)#951 |
| 25. | Sportmans Shores | 21.3% | 4.6%(+16.7)#25 | 5.0%(+16.3)#1,041 |
| 26. | Bug Tussle | 20.8% | 4.6%(+16.2)#26 | 5.0%(+15.8)#1,082 |
| 27. | Flute Springs | 20.5% | 4.6%(+15.9)#27 | 5.0%(+15.5)#1,117 |
| 28. | Canton | 20.4% | 4.6%(+15.8)#28 | 5.0%(+15.4)#1,124 |
| 29. | Oak Hill-Piney | 20.4% | 4.6%(+15.8)#29 | 5.0%(+15.4)#1,130 |
| 30. | Teresita | 20.3% | 4.6%(+15.7)#30 | 5.0%(+15.3)#1,141 |
| 31. | Red Rock | 20.0% | 4.6%(+15.4)#31 | 5.0%(+15.0)#1,179 |
| 32. | Rocky | 19.5% | 4.6%(+14.9)#32 | 5.0%(+14.5)#1,259 |
| 33. | Langston | 19.0% | 4.6%(+14.4)#33 | 5.0%(+14.0)#1,326 |
| 34. | Zeb | 19.0% | 4.6%(+14.4)#34 | 5.0%(+14.0)#1,330 |
| 35. | Cyril | 18.6% | 4.6%(+14.0)#35 | 5.0%(+13.6)#1,392 |
| 36. | Notchietown | 18.5% | 4.6%(+13.9)#36 | 5.0%(+13.5)#1,401 |
| 37. | Mallard Bay | 18.2% | 4.6%(+13.6)#37 | 5.0%(+13.2)#1,441 |
| 38. | Lequire | 17.9% | 4.6%(+13.3)#38 | 5.0%(+12.9)#1,501 |
| 39. | Kildare | 17.9% | 4.6%(+13.3)#39 | 5.0%(+12.9)#1,502 |
| 40. | Swink | 17.4% | 4.6%(+12.8)#40 | 5.0%(+12.4)#1,573 |
| 41. | Webbers Falls | 16.9% | 4.6%(+12.3)#41 | 5.0%(+11.9)#1,652 |
| 42. | Blanco | 16.7% | 4.6%(+12.1)#42 | 5.0%(+11.7)#1,715 |
| 43. | Maramec | 16.7% | 4.6%(+12.1)#43 | 5.0%(+11.7)#1,719 |
| 44. | Old Green | 16.0% | 4.6%(+11.4)#44 | 5.0%(+11.0)#1,840 |
| 45. | Devol | 15.9% | 4.6%(+11.3)#45 | 5.0%(+10.9)#1,866 |
| 46. | Sasakwa | 15.8% | 4.6%(+11.2)#46 | 5.0%(+10.8)#1,888 |
| 47. | Fairfax | 15.5% | 4.6%(+10.9)#47 | 5.0%(+10.5)#1,943 |
| 48. | Bridgeport | 15.4% | 4.6%(+10.8)#48 | 5.0%(+10.4)#1,979 |
| 49. | Lake Aluma | 15.4% | 4.6%(+10.8)#49 | 5.0%(+10.4)#1,987 |
| 50. | Whippoorwill | 15.4% | 4.6%(+10.8)#50 | 5.0%(+10.4)#1,989 |
| 51. | Gore | 15.2% | 4.6%(+10.6)#51 | 5.0%(+10.2)#2,021 |
| 52. | Nicut | 15.2% | 4.6%(+10.6)#52 | 5.0%(+10.2)#2,029 |
| 53. | Dewar | 15.0% | 4.6%(+10.4)#53 | 5.0%(+10.00)#2,078 |
| 54. | Watonga | 14.7% | 4.6%(+10.1)#54 | 5.0%(+9.70)#2,130 |
| 55. | Roosevelt | 14.4% | 4.6%(+9.80)#55 | 5.0%(+9.40)#2,213 |
| 56. | St Louis | 14.3% | 4.6%(+9.70)#56 | 5.0%(+9.30)#2,241 |
| 57. | Gene Autry | 14.0% | 4.6%(+9.40)#57 | 5.0%(+9.00)#2,317 |
| 58. | Dougherty | 13.9% | 4.6%(+9.30)#58 | 5.0%(+8.90)#2,346 |
| 59. | Ashland | 13.6% | 4.6%(+9.00)#59 | 5.0%(+8.60)#2,429 |
| 60. | Titanic | 13.5% | 4.6%(+8.90)#60 | 5.0%(+8.50)#2,452 |
| 61. | Wann | 13.5% | 4.6%(+8.90)#61 | 5.0%(+8.50)#2,459 |
| 62. | Cumberland | 13.3% | 4.6%(+8.70)#62 | 5.0%(+8.30)#2,503 |
| 63. | Edgewater Park | 13.3% | 4.6%(+8.70)#63 | 5.0%(+8.30)#2,522 |
| 64. | Loco | 13.0% | 4.6%(+8.40)#64 | 5.0%(+8.00)#2,627 |
| 65. | Sand Point | 12.8% | 4.6%(+8.20)#65 | 5.0%(+7.80)#2,697 |
| 66. | Chelsea | 12.6% | 4.6%(+8.00)#66 | 5.0%(+7.60)#2,758 |
| 67. | Tupelo | 12.6% | 4.6%(+8.00)#67 | 5.0%(+7.60)#2,772 |
| 68. | Oakland | 12.5% | 4.6%(+7.90)#68 | 5.0%(+7.50)#2,800 |
| 69. | Council Hill | 12.5% | 4.6%(+7.90)#69 | 5.0%(+7.50)#2,829 |
| 70. | Skedee | 12.5% | 4.6%(+7.90)#70 | 5.0%(+7.50)#2,833 |
| 71. | Old Eucha | 12.5% | 4.6%(+7.90)#71 | 5.0%(+7.50)#2,837 |
| 72. | Tribbey | 12.4% | 4.6%(+7.80)#72 | 5.0%(+7.40)#2,873 |
| 73. | Valliant | 12.3% | 4.6%(+7.70)#73 | 5.0%(+7.30)#2,910 |
| 74. | Westville | 12.1% | 4.6%(+7.50)#74 | 5.0%(+7.10)#2,983 |
| 75. | Grandfield | 12.1% | 4.6%(+7.50)#75 | 5.0%(+7.10)#2,991 |
| 76. | Terral | 12.0% | 4.6%(+7.40)#76 | 5.0%(+7.00)#3,045 |
| 77. | Grant | 12.0% | 4.6%(+7.40)#77 | 5.0%(+7.00)#3,048 |
| 78. | Peckham | 12.0% | 4.6%(+7.40)#78 | 5.0%(+7.00)#3,056 |
| 79. | Turley | 11.9% | 4.6%(+7.30)#79 | 5.0%(+6.90)#3,067 |
| 80. | Glencoe | 11.9% | 4.6%(+7.30)#80 | 5.0%(+6.90)#3,085 |
| 81. | Stigler | 11.8% | 4.6%(+7.20)#81 | 5.0%(+6.80)#3,109 |
| 82. | Hulbert | 11.8% | 4.6%(+7.20)#82 | 5.0%(+6.80)#3,130 |
| 83. | Bradley | 11.8% | 4.6%(+7.20)#83 | 5.0%(+6.80)#3,141 |
| 84. | Tonkawa Tribal Housing | 11.7% | 4.6%(+7.10)#84 | 5.0%(+6.70)#3,182 |
| 85. | Antlers | 11.6% | 4.6%(+7.00)#85 | 5.0%(+6.60)#3,201 |
| 86. | Mangum | 11.5% | 4.6%(+6.90)#86 | 5.0%(+6.50)#3,246 |
| 87. | Gans | 11.5% | 4.6%(+6.90)#87 | 5.0%(+6.50)#3,277 |
| 88. | Okeene | 11.2% | 4.6%(+6.60)#88 | 5.0%(+6.20)#3,403 |
| 89. | Hollis | 11.1% | 4.6%(+6.50)#89 | 5.0%(+6.10)#3,439 |
| 90. | Jay | 10.9% | 4.6%(+6.30)#90 | 5.0%(+5.90)#3,551 |
| 91. | Arkoma | 10.9% | 4.6%(+6.30)#91 | 5.0%(+5.90)#3,557 |
| 92. | Red Oak | 10.9% | 4.6%(+6.30)#92 | 5.0%(+5.90)#3,569 |
| 93. | Afton | 10.8% | 4.6%(+6.20)#93 | 5.0%(+5.80)#3,616 |
| 94. | Porum | 10.8% | 4.6%(+6.20)#94 | 5.0%(+5.80)#3,617 |
| 95. | Cement | 10.8% | 4.6%(+6.20)#95 | 5.0%(+5.80)#3,622 |
| 96. | Belfonte | 10.8% | 4.6%(+6.20)#96 | 5.0%(+5.80)#3,637 |
| 97. | Osage | 10.8% | 4.6%(+6.20)#97 | 5.0%(+5.80)#3,645 |
| 98. | Bushyhead | 10.7% | 4.6%(+6.10)#98 | 5.0%(+5.70)#3,680 |
| 99. | Vian | 10.7% | 4.6%(+6.10)#99 | 5.0%(+5.70)#3,681 |
| 100. | Redbird Smith | 10.7% | 4.6%(+6.10)#100 | 5.0%(+5.70)#3,691 |
Common Questions
What are the Top 10 Cities with the Highest Unemployment Rate in Oklahoma?
Top 10 Cities with the Highest Unemployment Rate in Oklahoma are:
#1
100.0%
#2
100.0%
#3
100.0%
#4
100.0%
#5
56.5%
#6
45.3%
#7
38.9%
#8
38.5%
#9
37.1%
#10
31.8%
What city has the Highest Unemployment Rate in Oklahoma?
Blackgum has the Highest Unemployment Rate in Oklahoma with 100.0%.
What is the Unemployment Rate in the State of Oklahoma?
Unemployment Rate in Oklahoma is 4.6%.
What is the Unemployment Rate in the United States?
Unemployment Rate in the United States is 5.0%.