Cities with the Highest Unemployment Rate in New York
RELATED REPORTS & OPTIONS
Highest Unemployment
New York
Compare Cities
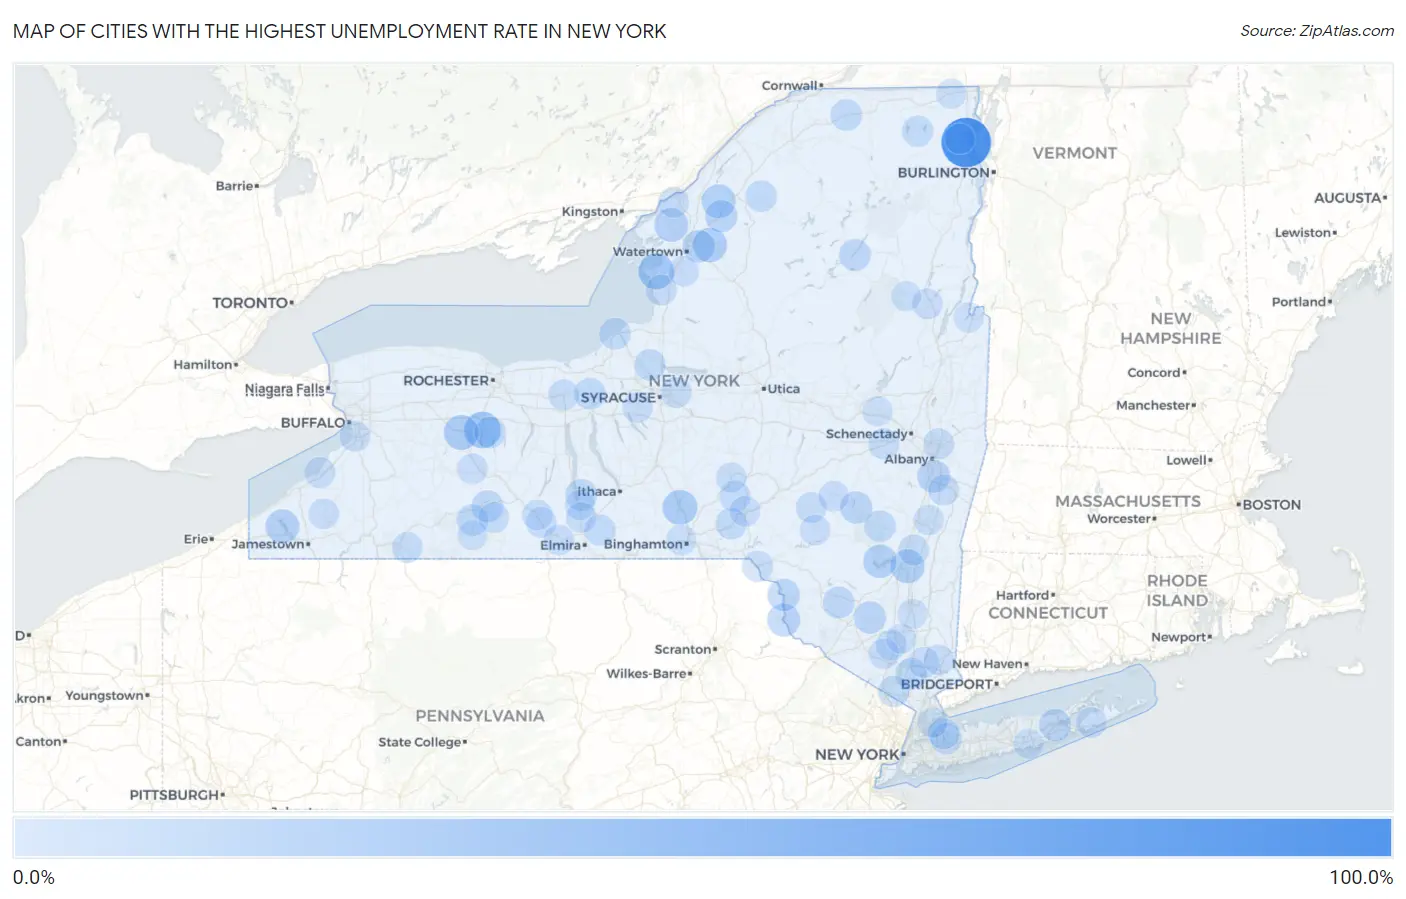
Map of Cities with the Highest Unemployment Rate in New York
0.0%
100.0%
Cities with the Highest Unemployment Rate in New York
| City | Unemployment Rate | vs State | vs National | |
| 1. | Parc | 100.0% | 5.9%(+94.1)#1 | 5.0%(+95.0)#5 |
| 2. | Lakeville | 39.6% | 5.9%(+33.7)#2 | 5.0%(+34.6)#267 |
| 3. | Henderson | 36.2% | 5.9%(+30.3)#3 | 5.0%(+31.2)#322 |
| 4. | Wadsworth | 31.3% | 5.9%(+25.4)#4 | 5.0%(+26.3)#451 |
| 5. | Whitney Point | 30.9% | 5.9%(+25.0)#5 | 5.0%(+25.9)#463 |
| 6. | Great Bend | 28.9% | 5.9%(+23.0)#6 | 5.0%(+23.9)#544 |
| 7. | East Kingston | 27.7% | 5.9%(+21.8)#7 | 5.0%(+22.7)#601 |
| 8. | Oxbow | 26.8% | 5.9%(+20.9)#8 | 5.0%(+21.8)#656 |
| 9. | Depauville | 26.0% | 5.9%(+20.1)#9 | 5.0%(+21.0)#689 |
| 10. | Chautauqua | 25.5% | 5.9%(+19.6)#10 | 5.0%(+20.5)#711 |
| 11. | Shokan | 25.1% | 5.9%(+19.2)#11 | 5.0%(+20.1)#729 |
| 12. | Narrowsburg | 23.2% | 5.9%(+17.3)#12 | 5.0%(+18.2)#872 |
| 13. | Castleton On Hudson | 22.7% | 5.9%(+16.8)#13 | 5.0%(+17.7)#906 |
| 14. | Eldred | 22.5% | 5.9%(+16.6)#14 | 5.0%(+17.5)#928 |
| 15. | Black River | 21.6% | 5.9%(+15.7)#15 | 5.0%(+16.6)#999 |
| 16. | North Blenheim | 21.4% | 5.9%(+15.5)#16 | 5.0%(+16.4)#1,030 |
| 17. | Callicoon | 20.4% | 5.9%(+14.5)#17 | 5.0%(+15.4)#1,127 |
| 18. | Unadilla Forks | 20.2% | 5.9%(+14.3)#18 | 5.0%(+15.2)#1,157 |
| 19. | Prattsville | 20.0% | 5.9%(+14.1)#19 | 5.0%(+15.0)#1,191 |
| 20. | Antwerp | 19.8% | 5.9%(+13.9)#20 | 5.0%(+14.8)#1,212 |
| 21. | Pine Bush | 19.7% | 5.9%(+13.8)#21 | 5.0%(+14.7)#1,220 |
| 22. | Riverside | 19.1% | 5.9%(+13.2)#22 | 5.0%(+14.1)#1,311 |
| 23. | North Hornell | 18.1% | 5.9%(+12.2)#23 | 5.0%(+13.1)#1,459 |
| 24. | Woodridge | 18.1% | 5.9%(+12.2)#24 | 5.0%(+13.1)#1,460 |
| 25. | Montrose | 18.0% | 5.9%(+12.1)#25 | 5.0%(+13.0)#1,470 |
| 26. | Long Lake | 18.0% | 5.9%(+12.1)#26 | 5.0%(+13.0)#1,475 |
| 27. | Burdett | 17.6% | 5.9%(+11.7)#27 | 5.0%(+12.6)#1,536 |
| 28. | Brushton | 17.1% | 5.9%(+11.2)#28 | 5.0%(+12.1)#1,616 |
| 29. | Suny Oswego | 17.0% | 5.9%(+11.1)#29 | 5.0%(+12.0)#1,622 |
| 30. | Livonia Center | 16.9% | 5.9%(+11.0)#30 | 5.0%(+11.9)#1,653 |
| 31. | Savannah | 16.8% | 5.9%(+10.9)#31 | 5.0%(+11.8)#1,679 |
| 32. | Edwards | 16.7% | 5.9%(+10.8)#32 | 5.0%(+11.7)#1,701 |
| 33. | Sand Ridge | 16.5% | 5.9%(+10.6)#33 | 5.0%(+11.5)#1,737 |
| 34. | Sparrow Bush | 16.4% | 5.9%(+10.5)#34 | 5.0%(+11.4)#1,752 |
| 35. | Westernville | 16.4% | 5.9%(+10.5)#35 | 5.0%(+11.4)#1,763 |
| 36. | Hunter | 16.3% | 5.9%(+10.4)#36 | 5.0%(+11.3)#1,777 |
| 37. | Westford | 16.3% | 5.9%(+10.4)#37 | 5.0%(+11.3)#1,781 |
| 38. | Alfred | 16.2% | 5.9%(+10.3)#38 | 5.0%(+11.2)#1,785 |
| 39. | Lake Huntington | 16.0% | 5.9%(+10.1)#39 | 5.0%(+11.0)#1,844 |
| 40. | Afton | 15.7% | 5.9%(+9.80)#40 | 5.0%(+10.7)#1,898 |
| 41. | Wassaic | 15.7% | 5.9%(+9.80)#41 | 5.0%(+10.7)#1,902 |
| 42. | Greenvale | 15.6% | 5.9%(+9.70)#42 | 5.0%(+10.6)#1,918 |
| 43. | Lyon Mountain | 15.6% | 5.9%(+9.70)#43 | 5.0%(+10.6)#1,929 |
| 44. | Guilford | 15.1% | 5.9%(+9.20)#44 | 5.0%(+10.1)#2,058 |
| 45. | Viola | 15.0% | 5.9%(+9.10)#45 | 5.0%(+10.00)#2,062 |
| 46. | Wingdale | 14.9% | 5.9%(+9.00)#46 | 5.0%(+9.90)#2,099 |
| 47. | Erin | 14.9% | 5.9%(+9.00)#47 | 5.0%(+9.90)#2,102 |
| 48. | Slaterville Springs | 14.5% | 5.9%(+8.60)#48 | 5.0%(+9.50)#2,181 |
| 49. | Minoa | 14.3% | 5.9%(+8.40)#49 | 5.0%(+9.30)#2,220 |
| 50. | Niverville | 14.3% | 5.9%(+8.40)#50 | 5.0%(+9.30)#2,225 |
| 51. | Hancock | 14.3% | 5.9%(+8.40)#51 | 5.0%(+9.30)#2,228 |
| 52. | Sunset Bay | 14.3% | 5.9%(+8.40)#52 | 5.0%(+9.30)#2,233 |
| 53. | Tivoli | 14.2% | 5.9%(+8.30)#53 | 5.0%(+9.20)#2,255 |
| 54. | East Worcester | 14.2% | 5.9%(+8.30)#54 | 5.0%(+9.20)#2,264 |
| 55. | Lyons | 13.9% | 5.9%(+8.00)#55 | 5.0%(+8.90)#2,323 |
| 56. | Delanson | 13.9% | 5.9%(+8.00)#56 | 5.0%(+8.90)#2,342 |
| 57. | Sea Cliff | 13.8% | 5.9%(+7.90)#57 | 5.0%(+8.80)#2,355 |
| 58. | Green Island | 13.8% | 5.9%(+7.90)#58 | 5.0%(+8.80)#2,357 |
| 59. | Ellisburg | 13.3% | 5.9%(+7.40)#59 | 5.0%(+8.30)#2,519 |
| 60. | Blasdell | 13.2% | 5.9%(+7.30)#60 | 5.0%(+8.20)#2,536 |
| 61. | Weston Mills | 13.2% | 5.9%(+7.30)#61 | 5.0%(+8.20)#2,543 |
| 62. | Thousand Island Park | 13.2% | 5.9%(+7.30)#62 | 5.0%(+8.20)#2,558 |
| 63. | Bloomville | 13.0% | 5.9%(+7.10)#63 | 5.0%(+8.00)#2,619 |
| 64. | Campbell | 12.9% | 5.9%(+7.00)#64 | 5.0%(+7.90)#2,650 |
| 65. | Chestertown | 12.9% | 5.9%(+7.00)#65 | 5.0%(+7.90)#2,651 |
| 66. | Salisbury Mills | 12.9% | 5.9%(+7.00)#66 | 5.0%(+7.90)#2,656 |
| 67. | Byersville | 12.9% | 5.9%(+7.00)#67 | 5.0%(+7.90)#2,665 |
| 68. | South Blooming Grove | 12.8% | 5.9%(+6.90)#68 | 5.0%(+7.80)#2,672 |
| 69. | Canisteo | 12.7% | 5.9%(+6.80)#69 | 5.0%(+7.70)#2,719 |
| 70. | Sidney | 12.5% | 5.9%(+6.60)#70 | 5.0%(+7.50)#2,785 |
| 71. | Shrub Oak | 12.5% | 5.9%(+6.60)#71 | 5.0%(+7.50)#2,790 |
| 72. | East Frankfort | 12.5% | 5.9%(+6.60)#72 | 5.0%(+7.50)#2,813 |
| 73. | Cherry Creek | 12.5% | 5.9%(+6.60)#73 | 5.0%(+7.50)#2,816 |
| 74. | Millport | 12.4% | 5.9%(+6.50)#74 | 5.0%(+7.40)#2,871 |
| 75. | Marcellus | 12.3% | 5.9%(+6.40)#75 | 5.0%(+7.30)#2,895 |
| 76. | Stamford | 12.3% | 5.9%(+6.40)#76 | 5.0%(+7.30)#2,900 |
| 77. | South Corning | 12.3% | 5.9%(+6.40)#77 | 5.0%(+7.30)#2,906 |
| 78. | Plattsburgh West | 12.2% | 5.9%(+6.30)#78 | 5.0%(+7.20)#2,946 |
| 79. | Savona | 12.2% | 5.9%(+6.30)#79 | 5.0%(+7.20)#2,950 |
| 80. | Heritage Hills | 12.1% | 5.9%(+6.20)#80 | 5.0%(+7.10)#2,973 |
| 81. | Rodman | 11.9% | 5.9%(+6.00)#81 | 5.0%(+6.90)#3,091 |
| 82. | Water Mill | 11.8% | 5.9%(+5.90)#82 | 5.0%(+6.80)#3,110 |
| 83. | Andes | 11.8% | 5.9%(+5.90)#83 | 5.0%(+6.80)#3,144 |
| 84. | Norwich | 11.7% | 5.9%(+5.80)#84 | 5.0%(+6.70)#3,154 |
| 85. | Hudson | 11.5% | 5.9%(+5.60)#85 | 5.0%(+6.50)#3,243 |
| 86. | Johnson City | 11.4% | 5.9%(+5.50)#86 | 5.0%(+6.40)#3,297 |
| 87. | Mooers | 11.4% | 5.9%(+5.50)#87 | 5.0%(+6.40)#3,323 |
| 88. | Akwesasne | 11.3% | 5.9%(+5.40)#88 | 5.0%(+6.30)#3,349 |
| 89. | Conesus | 11.3% | 5.9%(+5.40)#89 | 5.0%(+6.30)#3,384 |
| 90. | Fort Johnson | 11.2% | 5.9%(+5.30)#90 | 5.0%(+6.20)#3,408 |
| 91. | Larchmont | 11.1% | 5.9%(+5.20)#91 | 5.0%(+6.10)#3,426 |
| 92. | Whitehall | 11.1% | 5.9%(+5.20)#92 | 5.0%(+6.10)#3,433 |
| 93. | Montour Falls | 11.1% | 5.9%(+5.20)#93 | 5.0%(+6.10)#3,437 |
| 94. | Mountain Dale | 11.1% | 5.9%(+5.20)#94 | 5.0%(+6.10)#3,462 |
| 95. | Crown Heights | 11.0% | 5.9%(+5.10)#95 | 5.0%(+6.00)#3,495 |
| 96. | Brookhaven | 10.8% | 5.9%(+4.90)#96 | 5.0%(+5.80)#3,597 |
| 97. | Fairview Cdp Westchester County | 10.8% | 5.9%(+4.90)#97 | 5.0%(+5.80)#3,598 |
| 98. | Andover | 10.8% | 5.9%(+4.90)#98 | 5.0%(+5.80)#3,612 |
| 99. | North Creek | 10.8% | 5.9%(+4.90)#99 | 5.0%(+5.80)#3,621 |
| 100. | New Windsor | 10.7% | 5.9%(+4.80)#100 | 5.0%(+5.70)#3,656 |
Common Questions
What are the Top 10 Cities with the Highest Unemployment Rate in New York?
Top 10 Cities with the Highest Unemployment Rate in New York are:
#1
100.0%
#2
39.6%
#3
36.2%
#4
31.3%
#5
30.9%
#6
28.9%
#7
27.7%
#8
26.8%
#9
26.0%
#10
25.5%
What city has the Highest Unemployment Rate in New York?
Parc has the Highest Unemployment Rate in New York with 100.0%.
What is the Unemployment Rate in the State of New York?
Unemployment Rate in New York is 5.9%.
What is the Unemployment Rate in the United States?
Unemployment Rate in the United States is 5.0%.