Cities with the Highest Unemployment Rate in Vermont
RELATED REPORTS & OPTIONS
Highest Unemployment
Vermont
Compare Cities
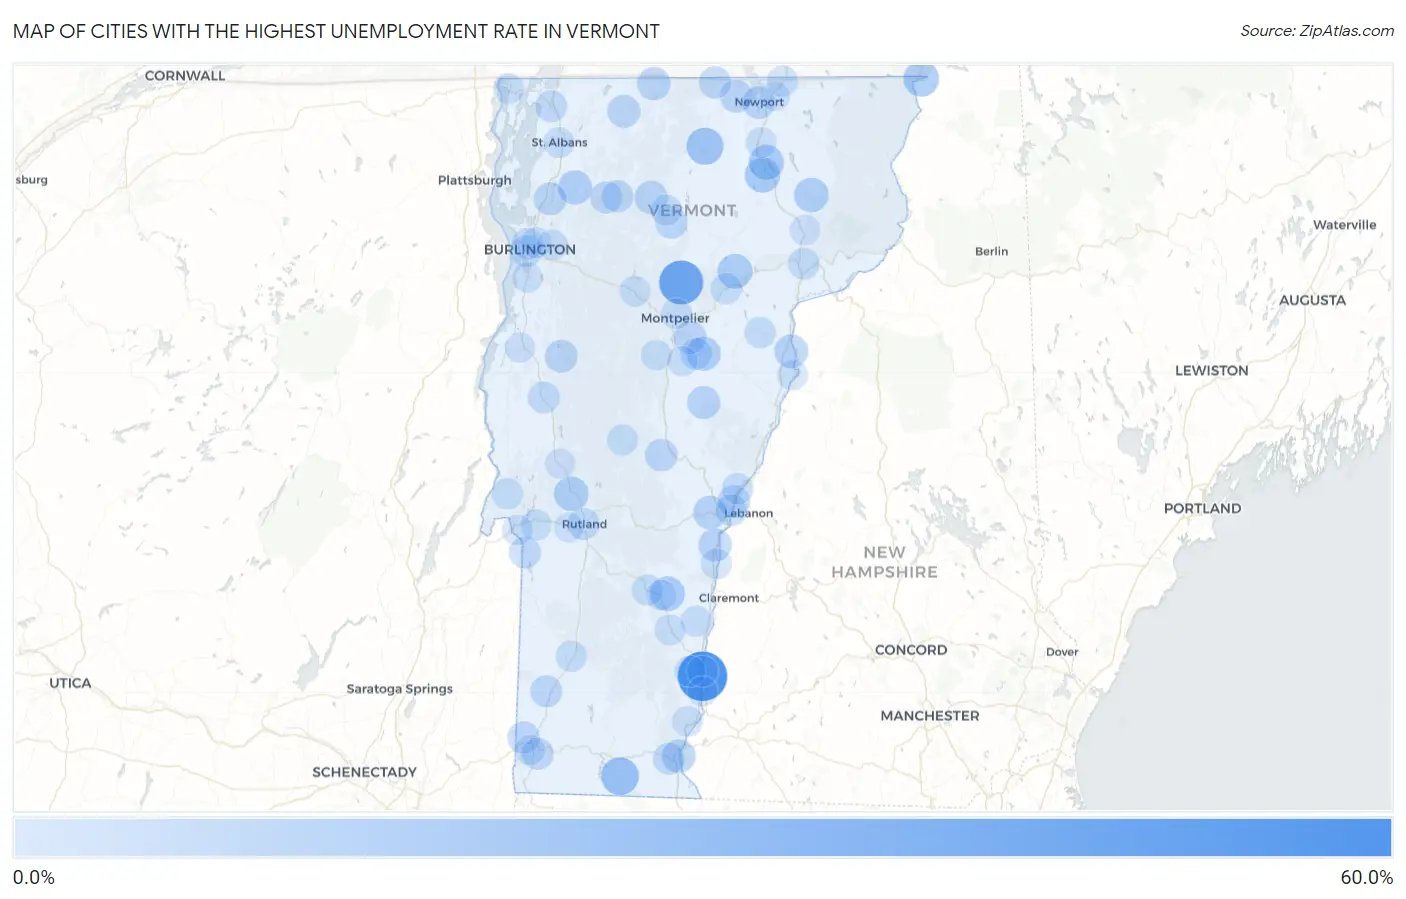
Map of Cities with the Highest Unemployment Rate in Vermont
0.0%
60.0%
Cities with the Highest Unemployment Rate in Vermont
| City | Unemployment Rate | vs State | vs National | |
| 1. | North Westminster | 54.8% | 3.6%(+51.2)#1 | 5.0%(+49.8)#124 |
| 2. | Worcester | 39.3% | 3.6%(+35.7)#2 | 5.0%(+34.3)#275 |
| 3. | Jamaica | 36.4% | 3.6%(+32.8)#3 | 5.0%(+31.4)#319 |
| 4. | Lyndon | 34.4% | 3.6%(+30.8)#4 | 5.0%(+29.4)#371 |
| 5. | Bolton | 31.0% | 3.6%(+27.4)#5 | 5.0%(+26.0)#462 |
| 6. | Jacksonville | 21.4% | 3.6%(+17.8)#6 | 5.0%(+16.4)#1,027 |
| 7. | Lunenburg | 20.0% | 3.6%(+16.4)#7 | 5.0%(+15.0)#1,174 |
| 8. | Lowell | 19.3% | 3.6%(+15.7)#8 | 5.0%(+14.3)#1,290 |
| 9. | Pownal | 16.8% | 3.6%(+13.2)#9 | 5.0%(+11.8)#1,676 |
| 10. | Beecher Falls | 15.6% | 3.6%(+12.0)#10 | 5.0%(+10.6)#1,932 |
| 11. | Glover | 14.3% | 3.6%(+10.7)#11 | 5.0%(+9.30)#2,236 |
| 12. | Barton | 14.0% | 3.6%(+10.4)#12 | 5.0%(+9.00)#2,308 |
| 13. | Cabot | 13.3% | 3.6%(+9.70)#13 | 5.0%(+8.30)#2,516 |
| 14. | Cavendish | 13.2% | 3.6%(+9.60)#14 | 5.0%(+8.20)#2,559 |
| 15. | Pittsford | 12.8% | 3.6%(+9.20)#15 | 5.0%(+7.80)#2,690 |
| 16. | Bakersfield | 12.6% | 3.6%(+9.00)#16 | 5.0%(+7.60)#2,769 |
| 17. | West Burke | 12.3% | 3.6%(+8.70)#17 | 5.0%(+7.30)#2,925 |
| 18. | East Barre | 11.4% | 3.6%(+7.80)#18 | 5.0%(+6.40)#3,313 |
| 19. | Fairfax | 11.3% | 3.6%(+7.70)#19 | 5.0%(+6.30)#3,364 |
| 20. | Lincoln | 11.0% | 3.6%(+7.40)#20 | 5.0%(+6.00)#3,529 |
| 21. | Peacham | 10.3% | 3.6%(+6.70)#21 | 5.0%(+5.30)#3,922 |
| 22. | Wells River | 10.1% | 3.6%(+6.50)#22 | 5.0%(+5.10)#4,070 |
| 23. | Brattleboro | 10.0% | 3.6%(+6.40)#23 | 5.0%(+5.00)#4,086 |
| 24. | Quechee | 9.8% | 3.6%(+6.20)#24 | 5.0%(+4.80)#4,272 |
| 25. | Johnson | 9.2% | 3.6%(+5.60)#25 | 5.0%(+4.20)#4,726 |
| 26. | Richford | 8.8% | 3.6%(+5.20)#26 | 5.0%(+3.80)#5,103 |
| 27. | Hartland | 8.5% | 3.6%(+4.90)#27 | 5.0%(+3.50)#5,439 |
| 28. | Chelsea | 8.5% | 3.6%(+4.90)#28 | 5.0%(+3.50)#5,442 |
| 29. | Barre | 8.2% | 3.6%(+4.60)#29 | 5.0%(+3.20)#5,687 |
| 30. | Enosburg Falls | 8.0% | 3.6%(+4.40)#30 | 5.0%(+3.00)#5,955 |
| 31. | Stamford | 8.0% | 3.6%(+4.40)#31 | 5.0%(+3.00)#5,982 |
| 32. | Newport Center | 8.0% | 3.6%(+4.40)#32 | 5.0%(+3.00)#6,007 |
| 33. | Newport | 7.8% | 3.6%(+4.20)#33 | 5.0%(+2.80)#6,170 |
| 34. | Milton | 7.8% | 3.6%(+4.20)#34 | 5.0%(+2.80)#6,174 |
| 35. | Bristol | 7.7% | 3.6%(+4.10)#35 | 5.0%(+2.70)#6,318 |
| 36. | Killington | 7.6% | 3.6%(+4.00)#36 | 5.0%(+2.60)#6,479 |
| 37. | New Haven | 7.4% | 3.6%(+3.80)#37 | 5.0%(+2.40)#6,745 |
| 38. | Bethel | 7.3% | 3.6%(+3.70)#38 | 5.0%(+2.30)#6,858 |
| 39. | Morrisville | 7.0% | 3.6%(+3.40)#39 | 5.0%(+2.00)#7,250 |
| 40. | North Bennington | 6.4% | 3.6%(+2.80)#40 | 5.0%(+1.40)#8,305 |
| 41. | North Troy | 6.3% | 3.6%(+2.70)#41 | 5.0%(+1.30)#8,504 |
| 42. | Cambridge | 6.3% | 3.6%(+2.70)#42 | 5.0%(+1.30)#8,543 |
| 43. | Wilder | 6.2% | 3.6%(+2.60)#43 | 5.0%(+1.20)#8,655 |
| 44. | Pawlet | 6.0% | 3.6%(+2.40)#44 | 5.0%(+1.000)#9,113 |
| 45. | Bennington | 5.9% | 3.6%(+2.30)#45 | 5.0%(+0.900)#9,207 |
| 46. | Jeffersonville | 5.8% | 3.6%(+2.20)#46 | 5.0%(+0.800)#9,502 |
| 47. | Arlington | 5.7% | 3.6%(+2.10)#47 | 5.0%(+0.700)#9,666 |
| 48. | Rutland | 5.6% | 3.6%(+2.00)#48 | 5.0%(+0.600)#9,801 |
| 49. | Westford | 5.6% | 3.6%(+2.00)#49 | 5.0%(+0.600)#9,963 |
| 50. | South Burlington | 5.5% | 3.6%(+1.90)#50 | 5.0%(+0.500)#10,025 |
| 51. | Swanton | 5.4% | 3.6%(+1.80)#51 | 5.0%(+0.400)#10,324 |
| 52. | Danby | 5.3% | 3.6%(+1.70)#52 | 5.0%(+0.300)#10,657 |
| 53. | Middlebury | 5.1% | 3.6%(+1.50)#53 | 5.0%(+0.100)#11,005 |
| 54. | Poultney | 5.1% | 3.6%(+1.50)#54 | 5.0%(+0.100)#11,078 |
| 55. | West Brattleboro | 5.0% | 3.6%(+1.40)#55 | 5.0%(=0.000)#11,304 |
| 56. | White River Junction | 5.0% | 3.6%(+1.40)#56 | 5.0%(=0.000)#11,306 |
| 57. | Graniteville | 5.0% | 3.6%(+1.40)#57 | 5.0%(=0.000)#11,395 |
| 58. | St Johnsbury | 4.7% | 3.6%(+1.10)#58 | 5.0%(-0.300)#12,048 |
| 59. | East Charlotte | 4.7% | 3.6%(+1.10)#59 | 5.0%(-0.300)#12,205 |
| 60. | Burlington | 4.6% | 3.6%(+1.000)#60 | 5.0%(-0.400)#12,236 |
| 61. | Groton | 4.5% | 3.6%(+0.900)#61 | 5.0%(-0.500)#12,692 |
| 62. | Norwich | 4.2% | 3.6%(+0.600)#62 | 5.0%(-0.800)#13,511 |
| 63. | Marshfield | 4.0% | 3.6%(+0.400)#63 | 5.0%(-1.00)#14,120 |
| 64. | Springfield | 3.7% | 3.6%(+0.100)#64 | 5.0%(-1.30)#14,871 |
| 65. | Manchester Center | 3.7% | 3.6%(+0.100)#65 | 5.0%(-1.30)#14,925 |
| 66. | Derby Line | 3.5% | 3.6%(-0.100)#66 | 5.0%(-1.50)#15,574 |
| 67. | Castleton | 3.4% | 3.6%(-0.200)#67 | 5.0%(-1.60)#15,851 |
| 68. | Ludlow | 3.4% | 3.6%(-0.200)#68 | 5.0%(-1.60)#15,869 |
| 69. | Saxtons River | 3.4% | 3.6%(-0.200)#69 | 5.0%(-1.60)#15,874 |
| 70. | Rochester | 3.4% | 3.6%(-0.200)#70 | 5.0%(-1.60)#15,913 |
| 71. | Benson | 3.4% | 3.6%(-0.200)#71 | 5.0%(-1.60)#15,925 |
| 72. | Bellows Falls | 3.3% | 3.6%(-0.300)#72 | 5.0%(-1.70)#16,112 |
| 73. | Hyde Park | 3.3% | 3.6%(-0.300)#73 | 5.0%(-1.70)#16,239 |
| 74. | South Lincoln | 3.1% | 3.6%(-0.500)#74 | 5.0%(-1.90)#16,881 |
| 75. | Waterbury | 2.9% | 3.6%(-0.700)#75 | 5.0%(-2.10)#17,373 |
| 76. | Alburgh | 2.9% | 3.6%(-0.700)#76 | 5.0%(-2.10)#17,460 |
| 77. | Windsor | 2.8% | 3.6%(-0.800)#77 | 5.0%(-2.20)#17,662 |
| 78. | Chester | 2.8% | 3.6%(-0.800)#78 | 5.0%(-2.20)#17,716 |
| 79. | Essex Junction | 2.6% | 3.6%(-1.00)#79 | 5.0%(-2.40)#18,152 |
| 80. | Montpelier | 2.6% | 3.6%(-1.00)#80 | 5.0%(-2.40)#18,172 |
| 81. | Proctor | 2.5% | 3.6%(-1.10)#81 | 5.0%(-2.50)#18,579 |
| 82. | Putney | 2.5% | 3.6%(-1.10)#82 | 5.0%(-2.50)#18,680 |
| 83. | Fair Haven | 2.3% | 3.6%(-1.30)#83 | 5.0%(-2.70)#19,113 |
| 84. | St Albans | 2.2% | 3.6%(-1.40)#84 | 5.0%(-2.80)#19,333 |
| 85. | Northfield | 2.2% | 3.6%(-1.40)#85 | 5.0%(-2.80)#19,359 |
| 86. | Orleans | 2.1% | 3.6%(-1.50)#86 | 5.0%(-2.90)#19,768 |
| 87. | Winooski | 2.0% | 3.6%(-1.60)#87 | 5.0%(-3.00)#19,932 |
| 88. | Lyndonville | 2.0% | 3.6%(-1.60)#88 | 5.0%(-3.00)#20,048 |
| 89. | Proctorsville | 2.0% | 3.6%(-1.60)#89 | 5.0%(-3.00)#20,118 |
| 90. | Newbury | 1.9% | 3.6%(-1.70)#90 | 5.0%(-3.10)#20,396 |
| 91. | Brandon | 1.6% | 3.6%(-2.00)#91 | 5.0%(-3.40)#21,080 |
| 92. | Huntington | 1.4% | 3.6%(-2.20)#92 | 5.0%(-3.60)#21,665 |
| 93. | Old Bennington | 1.4% | 3.6%(-2.20)#93 | 5.0%(-3.60)#21,719 |
| 94. | Shelburne | 1.3% | 3.6%(-2.30)#94 | 5.0%(-3.70)#21,772 |
| 95. | Vergennes | 1.3% | 3.6%(-2.30)#95 | 5.0%(-3.70)#21,823 |
| 96. | Williamstown | 1.3% | 3.6%(-2.30)#96 | 5.0%(-3.70)#21,863 |
| 97. | Derby Center | 0.90% | 3.6%(-2.70)#97 | 5.0%(-4.10)#22,761 |
| 98. | Westminster | 0.90% | 3.6%(-2.70)#98 | 5.0%(-4.10)#22,787 |
| 99. | West Rutland | 0.70% | 3.6%(-2.90)#99 | 5.0%(-4.30)#23,097 |
1
Common Questions
What are the Top 10 Cities with the Highest Unemployment Rate in Vermont?
Top 10 Cities with the Highest Unemployment Rate in Vermont are:
#1
54.8%
#2
39.3%
#3
21.4%
#4
19.3%
#5
15.6%
#6
14.3%
#7
14.0%
#8
13.3%
#9
13.2%
#10
12.8%
What city has the Highest Unemployment Rate in Vermont?
North Westminster has the Highest Unemployment Rate in Vermont with 54.8%.
What is the Unemployment Rate in the State of Vermont?
Unemployment Rate in Vermont is 3.6%.
What is the Unemployment Rate in the United States?
Unemployment Rate in the United States is 5.0%.