Cities with the Oldest Population in Massachusetts
RELATED REPORTS & OPTIONS
Oldest Population
Massachusetts
Compare Cities
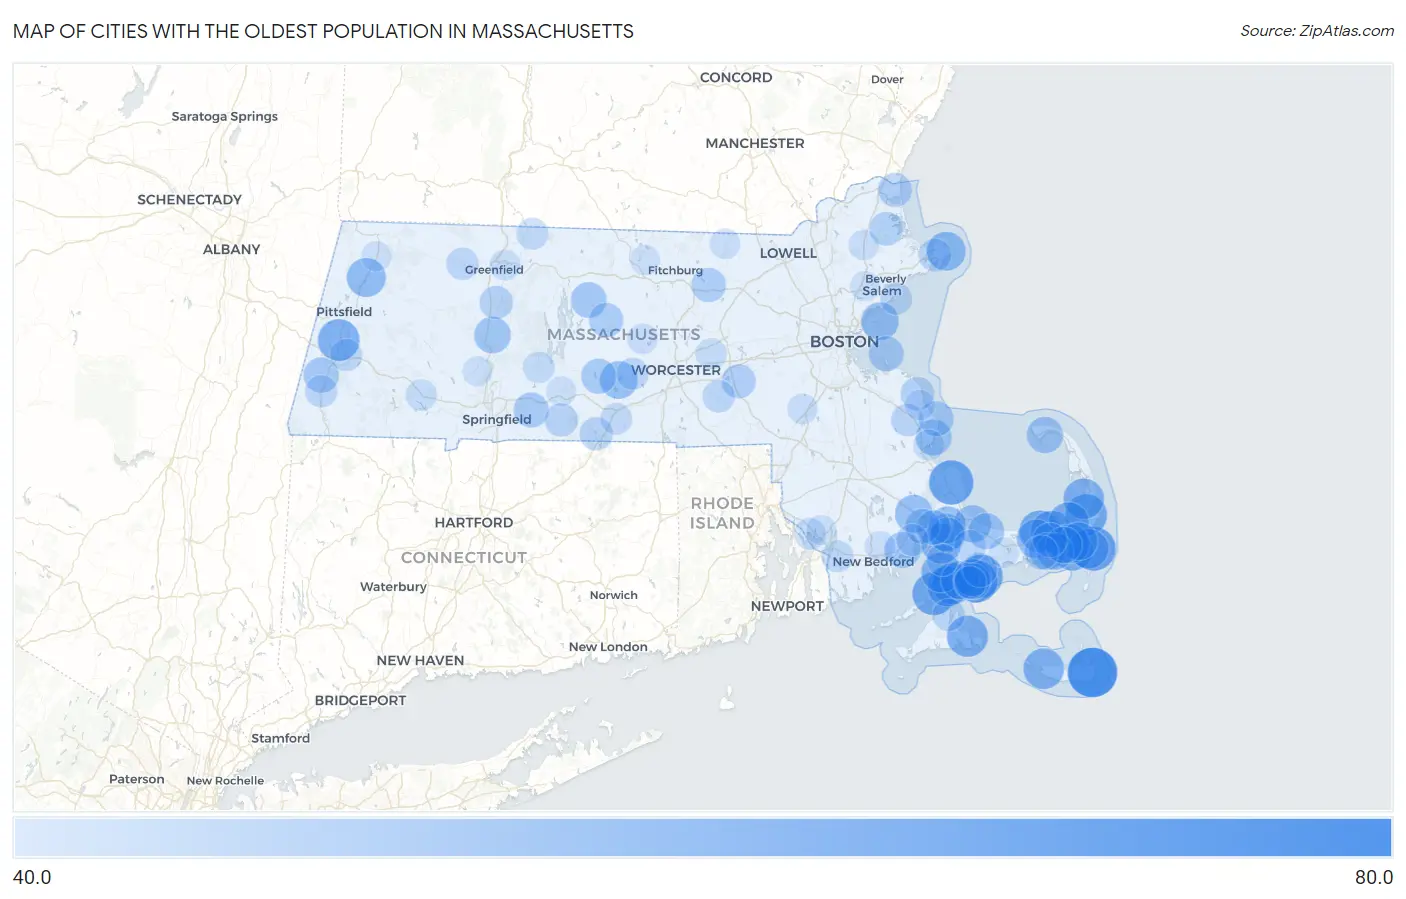
Map of Cities with the Oldest Population in Massachusetts
0.0
80.0
Cities with the Oldest Population in Massachusetts
| City | Median Age | vs State | vs National | |
| 1. | Siasconset | 76.3 | 39.8(+36.5)#1 | 38.5(+37.8)#99 |
| 2. | The Pinehills | 68.3 | 39.8(+28.5)#2 | 38.5(+29.8)#568 |
| 3. | Chatham | 67.8 | 39.8(+28.0)#3 | 38.5(+29.3)#622 |
| 4. | Popponesset Island | 66.3 | 39.8(+26.5)#4 | 38.5(+27.8)#845 |
| 5. | New Seabury | 66.1 | 39.8(+26.3)#5 | 38.5(+27.6)#865 |
| 6. | Woods Hole | 65.8 | 39.8(+26.0)#6 | 38.5(+27.3)#904 |
| 7. | Orleans | 64.3 | 39.8(+24.5)#7 | 38.5(+25.8)#1,153 |
| 8. | Lenox | 64.2 | 39.8(+24.4)#8 | 38.5(+25.7)#1,175 |
| 9. | Dennis | 64.1 | 39.8(+24.3)#9 | 38.5(+25.6)#1,195 |
| 10. | Harwich Port | 63.5 | 39.8(+23.7)#10 | 38.5(+25.0)#1,308 |
| 11. | Edgartown | 63.4 | 39.8(+23.6)#11 | 38.5(+24.9)#1,342 |
| 12. | Teaticket | 63.2 | 39.8(+23.4)#12 | 38.5(+24.7)#1,384 |
| 13. | East Dennis | 63.0 | 39.8(+23.2)#13 | 38.5(+24.5)#1,438 |
| 14. | Madaket | 62.7 | 39.8(+22.9)#14 | 38.5(+24.2)#1,510 |
| 15. | North Eastham | 62.5 | 39.8(+22.7)#15 | 38.5(+24.0)#1,544 |
| 16. | Falmouth | 62.4 | 39.8(+22.6)#16 | 38.5(+23.9)#1,571 |
| 17. | Brewster | 62.4 | 39.8(+22.6)#17 | 38.5(+23.9)#1,572 |
| 18. | West Falmouth | 61.4 | 39.8(+21.6)#18 | 38.5(+22.9)#1,814 |
| 19. | Pocasset | 61.3 | 39.8(+21.5)#19 | 38.5(+22.8)#1,840 |
| 20. | West Chatham | 61.2 | 39.8(+21.4)#20 | 38.5(+22.7)#1,862 |
| 21. | Green Harbor | 60.6 | 39.8(+20.8)#21 | 38.5(+22.1)#2,027 |
| 22. | Harwich Center | 60.3 | 39.8(+20.5)#22 | 38.5(+21.8)#2,121 |
| 23. | Cheshire | 60.1 | 39.8(+20.3)#23 | 38.5(+21.6)#2,207 |
| 24. | Rockport | 59.9 | 39.8(+20.1)#24 | 38.5(+21.4)#2,253 |
| 25. | Yarmouth Port | 59.7 | 39.8(+19.9)#25 | 38.5(+21.2)#2,309 |
| 26. | East Falmouth | 58.7 | 39.8(+18.9)#26 | 38.5(+20.2)#2,615 |
| 27. | East Harwich | 58.4 | 39.8(+18.6)#27 | 38.5(+19.9)#2,712 |
| 28. | West Wareham | 58.4 | 39.8(+18.6)#28 | 38.5(+19.9)#2,713 |
| 29. | Nahant | 58.1 | 39.8(+18.3)#29 | 38.5(+19.6)#2,821 |
| 30. | East Brookfield | 58.1 | 39.8(+18.3)#30 | 38.5(+19.6)#2,827 |
| 31. | Bourne | 57.6 | 39.8(+17.8)#31 | 38.5(+19.1)#3,002 |
| 32. | Seabrook | 57.5 | 39.8(+17.7)#32 | 38.5(+19.0)#3,039 |
| 33. | Sandwich | 57.4 | 39.8(+17.6)#33 | 38.5(+18.9)#3,076 |
| 34. | West Dennis | 57.3 | 39.8(+17.5)#34 | 38.5(+18.8)#3,113 |
| 35. | Buzzards Bay | 57.2 | 39.8(+17.4)#35 | 38.5(+18.7)#3,155 |
| 36. | Dennis Port | 57.1 | 39.8(+17.3)#36 | 38.5(+18.6)#3,185 |
| 37. | Northwest Harwich | 56.4 | 39.8(+16.6)#37 | 38.5(+17.9)#3,444 |
| 38. | Hatfield | 56.4 | 39.8(+16.6)#38 | 38.5(+17.9)#3,446 |
| 39. | Provincetown | 56.1 | 39.8(+16.3)#39 | 38.5(+17.6)#3,560 |
| 40. | Mattapoisett Center | 55.8 | 39.8(+16.0)#40 | 38.5(+17.3)#3,676 |
| 41. | East Sandwich | 55.6 | 39.8(+15.8)#41 | 38.5(+17.1)#3,743 |
| 42. | Duxbury | 55.5 | 39.8(+15.7)#42 | 38.5(+17.0)#3,781 |
| 43. | Monomoscoy Island | 55.4 | 39.8(+15.6)#43 | 38.5(+16.9)#3,882 |
| 44. | Petersham | 55.2 | 39.8(+15.4)#44 | 38.5(+16.7)#3,955 |
| 45. | Housatonic | 54.7 | 39.8(+14.9)#45 | 38.5(+16.2)#4,146 |
| 46. | Wilbraham | 54.3 | 39.8(+14.5)#46 | 38.5(+15.8)#4,325 |
| 47. | West Brookfield | 54.3 | 39.8(+14.5)#47 | 38.5(+15.8)#4,330 |
| 48. | Hull | 54.2 | 39.8(+14.4)#48 | 38.5(+15.7)#4,377 |
| 49. | Ocean Bluff Brant Rock | 54.1 | 39.8(+14.3)#49 | 38.5(+15.6)#4,425 |
| 50. | Monument Beach | 54.1 | 39.8(+14.3)#50 | 38.5(+15.6)#4,426 |
| 51. | Wareham Center | 53.8 | 39.8(+14.0)#51 | 38.5(+15.3)#4,537 |
| 52. | Onset | 53.7 | 39.8(+13.9)#52 | 38.5(+15.2)#4,601 |
| 53. | South Dennis | 53.3 | 39.8(+13.5)#53 | 38.5(+14.8)#4,778 |
| 54. | Shirley | 53.1 | 39.8(+13.3)#54 | 38.5(+14.6)#4,885 |
| 55. | Barre | 53.1 | 39.8(+13.3)#55 | 38.5(+14.6)#4,893 |
| 56. | Mashpee Neck | 53.0 | 39.8(+13.2)#56 | 38.5(+14.5)#4,921 |
| 57. | South Yarmouth | 52.9 | 39.8(+13.1)#57 | 38.5(+14.4)#4,959 |
| 58. | Hopkinton | 52.7 | 39.8(+12.9)#58 | 38.5(+14.2)#5,049 |
| 59. | Salisbury | 52.6 | 39.8(+12.8)#59 | 38.5(+14.1)#5,091 |
| 60. | Rowley | 52.3 | 39.8(+12.5)#60 | 38.5(+13.8)#5,269 |
| 61. | Scituate | 52.0 | 39.8(+12.2)#61 | 38.5(+13.5)#5,431 |
| 62. | Oak Bluffs | 51.8 | 39.8(+12.0)#62 | 38.5(+13.3)#5,559 |
| 63. | South Deerfield | 51.6 | 39.8(+11.8)#63 | 38.5(+13.1)#5,669 |
| 64. | Monson Center | 51.4 | 39.8(+11.6)#64 | 38.5(+12.9)#5,785 |
| 65. | Holland | 51.4 | 39.8(+11.6)#65 | 38.5(+12.9)#5,787 |
| 66. | Gloucester | 51.0 | 39.8(+11.2)#66 | 38.5(+12.5)#6,013 |
| 67. | North Pembroke | 50.8 | 39.8(+11.0)#67 | 38.5(+12.3)#6,137 |
| 68. | Seconsett Island | 50.4 | 39.8(+10.6)#68 | 38.5(+11.9)#6,437 |
| 69. | Upton | 50.3 | 39.8(+10.5)#69 | 38.5(+11.8)#6,455 |
| 70. | Vineyard Haven | 50.3 | 39.8(+10.5)#70 | 38.5(+11.8)#6,456 |
| 71. | Forestdale | 50.2 | 39.8(+10.4)#71 | 38.5(+11.7)#6,529 |
| 72. | Shelburne Falls | 50.0 | 39.8(+10.2)#72 | 38.5(+11.5)#6,650 |
| 73. | Lee | 50.0 | 39.8(+10.2)#73 | 38.5(+11.5)#6,654 |
| 74. | Great Barrington | 49.8 | 39.8(+10.00)#74 | 38.5(+11.3)#6,793 |
| 75. | Spencer | 49.7 | 39.8(+9.90)#75 | 38.5(+11.2)#6,855 |
| 76. | Marion Center | 49.7 | 39.8(+9.90)#76 | 38.5(+11.2)#6,876 |
| 77. | Marblehead | 49.6 | 39.8(+9.80)#77 | 38.5(+11.1)#6,905 |
| 78. | North Falmouth | 49.6 | 39.8(+9.80)#78 | 38.5(+11.1)#6,926 |
| 79. | Northfield | 49.5 | 39.8(+9.70)#79 | 38.5(+11.0)#7,013 |
| 80. | North Westport | 49.3 | 39.8(+9.50)#80 | 38.5(+10.8)#7,163 |
| 81. | Sturbridge | 49.2 | 39.8(+9.40)#81 | 38.5(+10.7)#7,251 |
| 82. | Ocean Grove | 49.1 | 39.8(+9.30)#82 | 38.5(+10.6)#7,317 |
| 83. | Belchertown | 48.7 | 39.8(+8.90)#83 | 38.5(+10.2)#7,584 |
| 84. | Blandford | 48.6 | 39.8(+8.80)#84 | 38.5(+10.1)#7,678 |
| 85. | Northborough | 48.3 | 39.8(+8.50)#85 | 38.5(+9.80)#7,859 |
| 86. | South Duxbury | 48.0 | 39.8(+8.20)#86 | 38.5(+9.50)#8,105 |
| 87. | Turners Falls | 47.7 | 39.8(+7.90)#87 | 38.5(+9.20)#8,328 |
| 88. | Pepperell | 47.6 | 39.8(+7.80)#88 | 38.5(+9.10)#8,398 |
| 89. | Acushnet Center | 47.4 | 39.8(+7.60)#89 | 38.5(+8.90)#8,587 |
| 90. | Boxford | 47.4 | 39.8(+7.60)#90 | 38.5(+8.90)#8,595 |
| 91. | Walpole | 47.3 | 39.8(+7.50)#91 | 38.5(+8.80)#8,672 |
| 92. | Rutland | 47.3 | 39.8(+7.50)#92 | 38.5(+8.80)#8,694 |
| 93. | Marshfield Hills | 47.2 | 39.8(+7.40)#93 | 38.5(+8.70)#8,790 |
| 94. | Barnstable Town | 47.1 | 39.8(+7.30)#94 | 38.5(+8.60)#8,859 |
| 95. | Easthampton Town | 47.0 | 39.8(+7.20)#95 | 38.5(+8.50)#8,930 |
| 96. | Palmer Town | 47.0 | 39.8(+7.20)#96 | 38.5(+8.50)#8,932 |
| 97. | Adams | 47.0 | 39.8(+7.20)#97 | 38.5(+8.50)#8,941 |
| 98. | South Ashburnham | 47.0 | 39.8(+7.20)#98 | 38.5(+8.50)#8,965 |
| 99. | Peabody | 46.9 | 39.8(+7.10)#99 | 38.5(+8.40)#9,007 |
| 100. | Somerset | 46.9 | 39.8(+7.10)#100 | 38.5(+8.40)#9,009 |
Common Questions
What are the Top 10 Cities with the Oldest Population in Massachusetts?
Top 10 Cities with the Oldest Population in Massachusetts are:
#1
76.3
#2
68.3
#3
67.8
#4
66.3
#5
66.1
#6
65.8
#7
64.3
#8
64.2
#9
64.1
#10
63.5
What city has the Oldest Population in Massachusetts?
Siasconset has the Oldest Population in Massachusetts with 76.3.
What is the Median Age in the State of Massachusetts?
Median Age in Massachusetts is 39.8.
What is the Median Age in the United States?
Median Age in the United States is 38.5.