Cities with the Most Immigrants from Moldova in Illinois
RELATED REPORTS & OPTIONS
Moldova
Illinois
Compare Cities
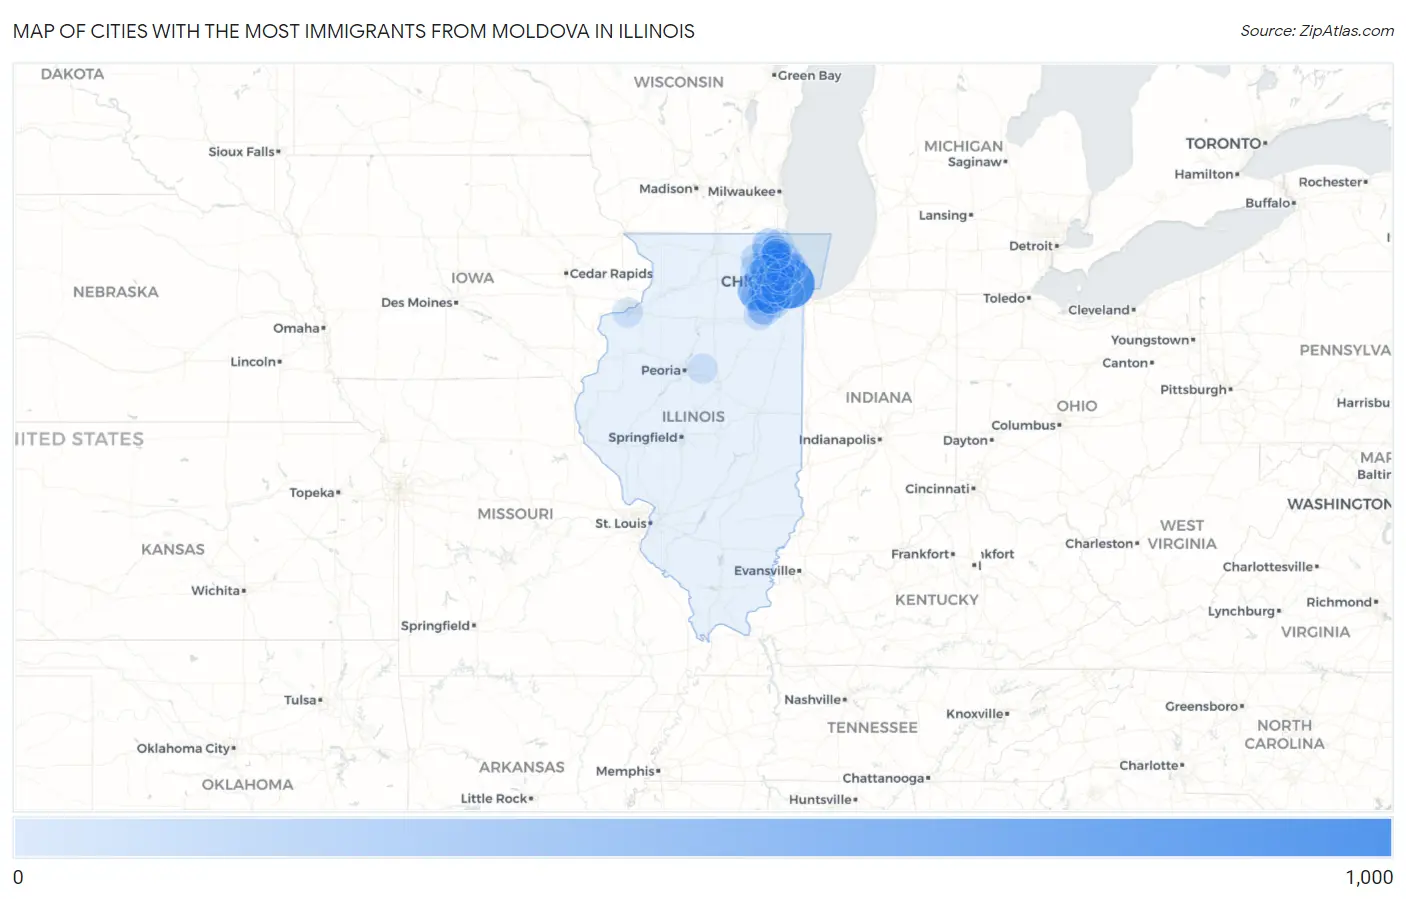
Map of Cities with the Most Immigrants from Moldova in Illinois
0
1,000
Cities with the Most Immigrants from Moldova in Illinois
| City | Moldova | vs State | vs National | |
| 1. | Chicago | 829 | 4,938(16.79%)#1 | 53,673(1.54%)#4 |
| 2. | Woodridge | 516 | 4,938(10.45%)#2 | 53,673(0.96%)#8 |
| 3. | Aurora | 396 | 4,938(8.02%)#3 | 53,673(0.74%)#13 |
| 4. | Arlington Heights | 230 | 4,938(4.66%)#4 | 53,673(0.43%)#33 |
| 5. | Naperville | 216 | 4,938(4.37%)#5 | 53,673(0.40%)#36 |
| 6. | Bolingbrook | 211 | 4,938(4.27%)#6 | 53,673(0.39%)#40 |
| 7. | Schaumburg | 204 | 4,938(4.13%)#7 | 53,673(0.38%)#42 |
| 8. | Mount Prospect | 186 | 4,938(3.77%)#8 | 53,673(0.35%)#51 |
| 9. | Wheeling | 172 | 4,938(3.48%)#9 | 53,673(0.32%)#58 |
| 10. | Hoffman Estates | 140 | 4,938(2.84%)#10 | 53,673(0.26%)#66 |
| 11. | Joliet | 125 | 4,938(2.53%)#11 | 53,673(0.23%)#77 |
| 12. | Round Lake | 125 | 4,938(2.53%)#12 | 53,673(0.23%)#78 |
| 13. | Palatine | 98 | 4,938(1.98%)#13 | 53,673(0.18%)#97 |
| 14. | Lake Zurich | 94 | 4,938(1.90%)#14 | 53,673(0.18%)#101 |
| 15. | Lockport | 79 | 4,938(1.60%)#15 | 53,673(0.15%)#128 |
| 16. | Plainfield | 68 | 4,938(1.38%)#16 | 53,673(0.13%)#145 |
| 17. | Deerfield | 65 | 4,938(1.32%)#17 | 53,673(0.12%)#153 |
| 18. | Niles | 63 | 4,938(1.28%)#18 | 53,673(0.12%)#162 |
| 19. | Elgin | 60 | 4,938(1.22%)#19 | 53,673(0.11%)#170 |
| 20. | Downers Grove | 58 | 4,938(1.17%)#20 | 53,673(0.11%)#178 |
| 21. | Elk Grove Village | 57 | 4,938(1.15%)#21 | 53,673(0.11%)#181 |
| 22. | Buffalo Grove | 50 | 4,938(1.01%)#22 | 53,673(0.09%)#197 |
| 23. | Wauconda | 49 | 4,938(0.99%)#23 | 53,673(0.09%)#200 |
| 24. | Skokie | 48 | 4,938(0.97%)#24 | 53,673(0.09%)#204 |
| 25. | Lombard | 48 | 4,938(0.97%)#25 | 53,673(0.09%)#206 |
| 26. | Mundelein | 46 | 4,938(0.93%)#26 | 53,673(0.09%)#217 |
| 27. | Oswego | 39 | 4,938(0.79%)#27 | 53,673(0.07%)#248 |
| 28. | Itasca | 34 | 4,938(0.69%)#28 | 53,673(0.06%)#273 |
| 29. | Algonquin | 30 | 4,938(0.61%)#29 | 53,673(0.06%)#303 |
| 30. | Prospect Heights | 30 | 4,938(0.61%)#30 | 53,673(0.06%)#304 |
| 31. | Wheaton | 29 | 4,938(0.59%)#31 | 53,673(0.05%)#310 |
| 32. | Wayne | 29 | 4,938(0.59%)#32 | 53,673(0.05%)#318 |
| 33. | Harwood Heights | 25 | 4,938(0.51%)#33 | 53,673(0.05%)#349 |
| 34. | Libertyville | 24 | 4,938(0.49%)#34 | 53,673(0.04%)#356 |
| 35. | Lemont | 24 | 4,938(0.49%)#35 | 53,673(0.04%)#357 |
| 36. | Schiller Park | 21 | 4,938(0.43%)#36 | 53,673(0.04%)#394 |
| 37. | Wilmette | 19 | 4,938(0.38%)#37 | 53,673(0.04%)#408 |
| 38. | Elmwood Park | 19 | 4,938(0.38%)#38 | 53,673(0.04%)#410 |
| 39. | Shorewood | 19 | 4,938(0.38%)#39 | 53,673(0.04%)#412 |
| 40. | Oak Park | 18 | 4,938(0.36%)#40 | 53,673(0.03%)#417 |
| 41. | Rolling Meadows | 18 | 4,938(0.36%)#41 | 53,673(0.03%)#421 |
| 42. | Channahon | 18 | 4,938(0.36%)#42 | 53,673(0.03%)#425 |
| 43. | Highland Park | 17 | 4,938(0.34%)#43 | 53,673(0.03%)#432 |
| 44. | Vernon Hills | 16 | 4,938(0.32%)#44 | 53,673(0.03%)#449 |
| 45. | Evanston | 14 | 4,938(0.28%)#45 | 53,673(0.03%)#486 |
| 46. | Glendale Heights | 14 | 4,938(0.28%)#46 | 53,673(0.03%)#492 |
| 47. | Lisle | 14 | 4,938(0.28%)#47 | 53,673(0.03%)#498 |
| 48. | Darien | 14 | 4,938(0.28%)#48 | 53,673(0.03%)#500 |
| 49. | Long Grove | 14 | 4,938(0.28%)#49 | 53,673(0.03%)#509 |
| 50. | Des Plaines | 13 | 4,938(0.26%)#50 | 53,673(0.02%)#517 |
| 51. | Romeoville | 12 | 4,938(0.24%)#51 | 53,673(0.02%)#542 |
| 52. | Oak Lawn | 10 | 4,938(0.20%)#52 | 53,673(0.02%)#596 |
| 53. | Elmhurst | 10 | 4,938(0.20%)#53 | 53,673(0.02%)#598 |
| 54. | Westmont | 10 | 4,938(0.20%)#54 | 53,673(0.02%)#604 |
| 55. | Gurnee | 7 | 4,938(0.14%)#55 | 53,673(0.01%)#688 |
| 56. | Franklin Park | 6 | 4,938(0.12%)#56 | 53,673(0.01%)#709 |
| 57. | Eureka | 6 | 4,938(0.12%)#57 | 53,673(0.01%)#715 |
| 58. | Rock Island | 5 | 4,938(0.10%)#58 | 53,673(0.01%)#725 |
| 59. | Indian Creek | 4 | 4,938(0.08%)#59 | 53,673(0.01%)#752 |
| 60. | Streamwood | 2 | 4,938(0.04%)#60 | 53,673(0.00%)#760 |
Common Questions
What are the Top 10 Cities with the Most Immigrants from Moldova in Illinois?
Top 10 Cities with the Most Immigrants from Moldova in Illinois are:
#1
829
#2
516
#3
396
#4
230
#5
216
#6
211
#7
204
#8
186
#9
172
#10
140
What city has the Most Immigrants from Moldova in Illinois?
Chicago has the Most Immigrants from Moldova in Illinois with 829.
What is the Total Immigrants from Moldova in the State of Illinois?
Total Immigrants from Moldova in Illinois is 4,938.
What is the Total Immigrants from Moldova in the United States?
Total Immigrants from Moldova in the United States is 53,673.