Cities with the Most Immigrants from Laos in the United States
RELATED REPORTS & OPTIONS
Laos
United States
Compare Cities
Map of Cities with the Most Immigrants from Laos in the United States
0
10,000
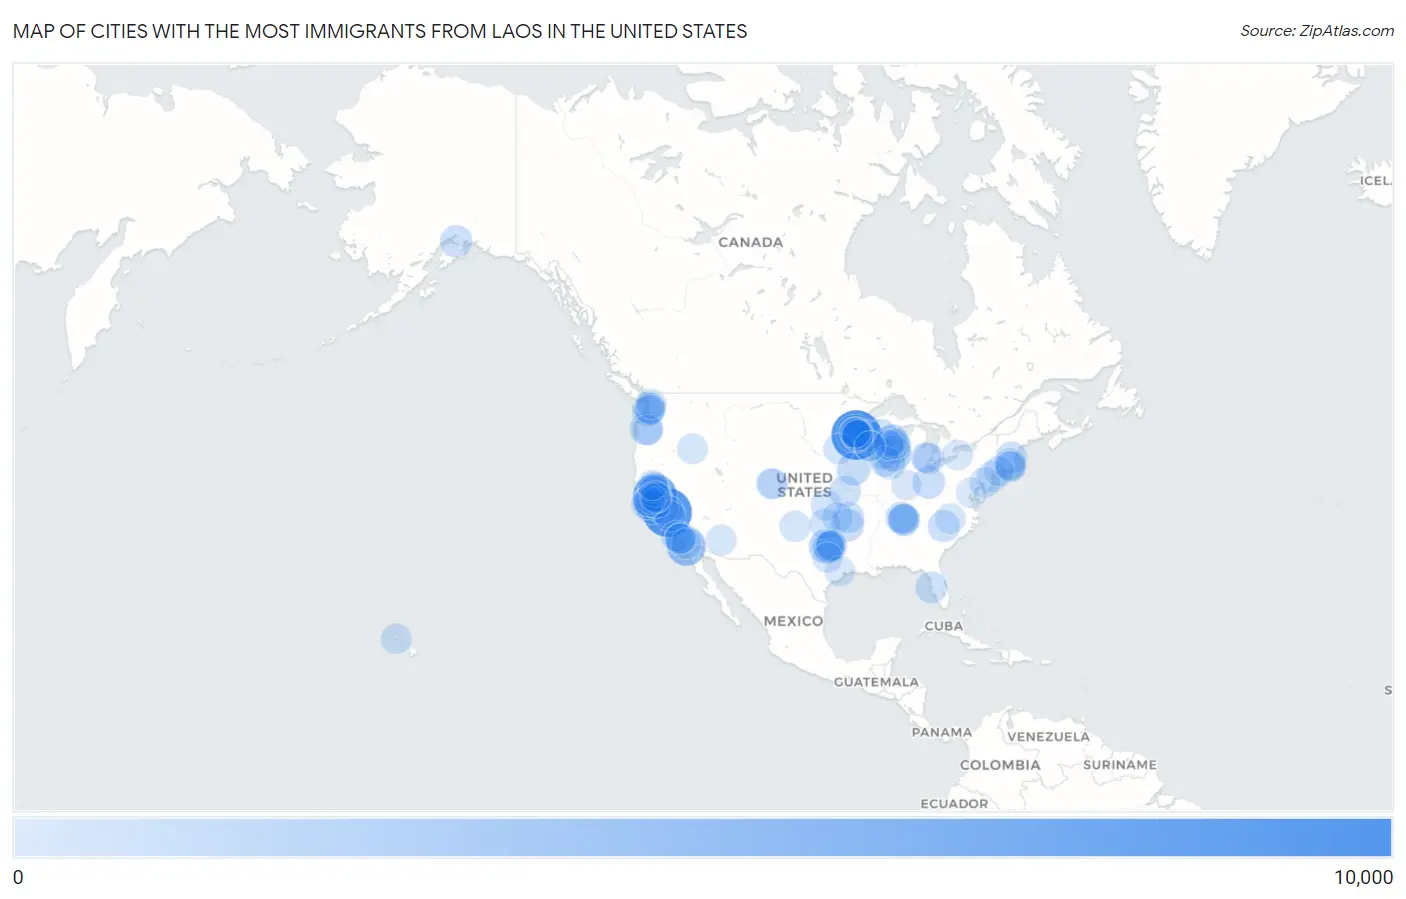
Cities with the Most Immigrants from Laos in the United States
| City | Laos | vs State | vs National | |
| 1. | St Paul | 8,129 | 24,591 (33.06%)#1 | 174,982 (4.65%)#1 |
| 2. | Fresno | 7,750 | 48,911 (15.85%)#1 | 174,982 (4.43%)#2 |
| 3. | Sacramento | 5,913 | 48,911 (12.09%)#2 | 174,982 (3.38%)#3 |
| 4. | San Diego | 3,699 | 48,911 (7.56%)#3 | 174,982 (2.11%)#4 |
| 5. | Brooklyn Park | 3,401 | 24,591 (13.83%)#2 | 174,982 (1.94%)#5 |
| 6. | Milwaukee | 2,262 | 12,681 (17.84%)#1 | 174,982 (1.29%)#6 |
| 7. | Minneapolis | 2,044 | 24,591 (8.31%)#3 | 174,982 (1.17%)#7 |
| 8. | Fort Worth | 1,901 | 9,141 (20.80%)#1 | 174,982 (1.09%)#8 |
| 9. | Stockton | 1,875 | 48,911 (3.83%)#4 | 174,982 (1.07%)#9 |
| 10. | Maplewood | 1,590 | 24,591 (6.47%)#4 | 174,982 (0.91%)#10 |
| 11. | San Jose | 1,453 | 48,911 (2.97%)#5 | 174,982 (0.83%)#11 |
| 12. | Des Moines | 1,364 | 3,682 (37.05%)#1 | 174,982 (0.78%)#12 |
| 13. | Portland | 1,326 | 3,218 (41.21%)#1 | 174,982 (0.76%)#13 |
| 14. | Fort Smith | 1,270 | 3,381 (37.56%)#1 | 174,982 (0.73%)#14 |
| 15. | Columbus | 1,102 | 2,488 (44.29%)#1 | 174,982 (0.63%)#15 |
| 16. | Merced | 1,096 | 48,911 (2.24%)#6 | 174,982 (0.63%)#16 |
| 17. | Oakland | 1,088 | 48,911 (2.22%)#7 | 174,982 (0.62%)#17 |
| 18. | Sheboygan | 999 | 12,681 (7.88%)#2 | 174,982 (0.57%)#18 |
| 19. | Elk Grove | 978 | 48,911 (2.00%)#8 | 174,982 (0.56%)#19 |
| 20. | Florin | 964 | 48,911 (1.97%)#9 | 174,982 (0.55%)#20 |
| 21. | Murfreesboro | 957 | 4,233 (22.61%)#1 | 174,982 (0.55%)#21 |
| 22. | Anchorage | 948 | 1,137 (83.38%)#1 | 174,982 (0.54%)#22 |
| 23. | Kansas City | 821 | 3,082 (26.64%)#1 | 174,982 (0.47%)#23 |
| 24. | Lowell | 789 | 2,448 (32.23%)#1 | 174,982 (0.45%)#24 |
| 25. | Charlotte | 783 | 4,983 (15.71%)#1 | 174,982 (0.45%)#25 |
| 26. | St Petersburg | 779 | 4,073 (19.13%)#1 | 174,982 (0.45%)#26 |
| 27. | Wausau | 776 | 12,681 (6.12%)#3 | 174,982 (0.44%)#27 |
| 28. | Nashville | 762 | 4,233 (18.00%)#2 | 174,982 (0.44%)#28 |
| 29. | Warren | 746 | 3,027 (24.64%)#1 | 174,982 (0.43%)#29 |
| 30. | Madison | 733 | 12,681 (5.78%)#4 | 174,982 (0.42%)#30 |
| 31. | Elgin | 720 | 3,512 (20.50%)#1 | 174,982 (0.41%)#31 |
| 32. | Woonsocket | 715 | 2,091 (34.19%)#1 | 174,982 (0.41%)#32 |
| 33. | Appleton | 705 | 12,681 (5.56%)#5 | 174,982 (0.40%)#33 |
| 34. | Green Bay | 682 | 12,681 (5.38%)#6 | 174,982 (0.39%)#34 |
| 35. | Clovis | 681 | 48,911 (1.39%)#10 | 174,982 (0.39%)#35 |
| 36. | Springdale | 676 | 3,381 (19.99%)#2 | 174,982 (0.39%)#36 |
| 37. | Richmond | 673 | 48,911 (1.38%)#11 | 174,982 (0.38%)#37 |
| 38. | Providence | 671 | 2,091 (32.09%)#2 | 174,982 (0.38%)#38 |
| 39. | New York | 665 | 2,177 (30.55%)#1 | 174,982 (0.38%)#39 |
| 40. | Linda | 657 | 48,911 (1.34%)#12 | 174,982 (0.38%)#40 |
| 41. | Haltom City | 655 | 9,141 (7.17%)#2 | 174,982 (0.37%)#41 |
| 42. | Anaheim | 630 | 48,911 (1.29%)#13 | 174,982 (0.36%)#42 |
| 43. | Seattle | 619 | 5,926 (10.45%)#1 | 174,982 (0.35%)#43 |
| 44. | Smyrna | 610 | 4,233 (14.41%)#3 | 174,982 (0.35%)#44 |
| 45. | Brooklyn Center | 595 | 24,591 (2.42%)#5 | 174,982 (0.34%)#45 |
| 46. | Amarillo | 592 | 9,141 (6.48%)#3 | 174,982 (0.34%)#46 |
| 47. | Wichita | 581 | 3,082 (18.85%)#2 | 174,982 (0.33%)#47 |
| 48. | Grand Prairie | 568 | 9,141 (6.21%)#4 | 174,982 (0.32%)#48 |
| 49. | Tacoma | 555 | 5,926 (9.37%)#2 | 174,982 (0.32%)#49 |
| 50. | Oklahoma City | 544 | 2,834 (19.20%)#1 | 174,982 (0.31%)#50 |
| 51. | Eau Claire | 543 | 12,681 (4.28%)#7 | 174,982 (0.31%)#51 |
| 52. | Tulsa | 542 | 2,834 (19.12%)#2 | 174,982 (0.31%)#52 |
| 53. | Cottage Grove | 539 | 24,591 (2.19%)#6 | 174,982 (0.31%)#53 |
| 54. | Los Angeles | 514 | 48,911 (1.05%)#14 | 174,982 (0.29%)#54 |
| 55. | Visalia | 510 | 48,911 (1.04%)#15 | 174,982 (0.29%)#55 |
| 56. | Euless | 505 | 9,141 (5.52%)#5 | 174,982 (0.29%)#56 |
| 57. | Renton | 483 | 5,926 (8.15%)#3 | 174,982 (0.28%)#57 |
| 58. | Garland | 475 | 9,141 (5.20%)#6 | 174,982 (0.27%)#58 |
| 59. | Boise City | 459 | 956 (48.01%)#1 | 174,982 (0.26%)#59 |
| 60. | Santa Ana | 456 | 48,911 (0.93%)#16 | 174,982 (0.26%)#60 |
| 61. | Urban Honolulu | 454 | 1,164 (39.00%)#1 | 174,982 (0.26%)#61 |
| 62. | Rockford | 453 | 3,512 (12.90%)#2 | 174,982 (0.26%)#62 |
| 63. | Philadelphia | 440 | 2,153 (20.44%)#1 | 174,982 (0.25%)#63 |
| 64. | Kent | 438 | 5,926 (7.39%)#4 | 174,982 (0.25%)#64 |
| 65. | Yuba City | 435 | 48,911 (0.89%)#17 | 174,982 (0.25%)#65 |
| 66. | Phoenix | 426 | 1,156 (36.85%)#1 | 174,982 (0.24%)#66 |
| 67. | San Francisco | 414 | 48,911 (0.85%)#18 | 174,982 (0.24%)#67 |
| 68. | High Point | 411 | 4,983 (8.25%)#2 | 174,982 (0.23%)#68 |
| 69. | Oakdale | 399 | 24,591 (1.62%)#7 | 174,982 (0.23%)#69 |
| 70. | Lemon Hill | 398 | 48,911 (0.81%)#19 | 174,982 (0.23%)#70 |
| 71. | Plano | 396 | 9,141 (4.33%)#7 | 174,982 (0.23%)#71 |
| 72. | La Vergne | 396 | 4,233 (9.36%)#4 | 174,982 (0.23%)#72 |
| 73. | Oroville | 396 | 48,911 (0.81%)#20 | 174,982 (0.23%)#73 |
| 74. | Manitowoc | 390 | 12,681 (3.08%)#8 | 174,982 (0.22%)#74 |
| 75. | Westminster | 387 | 2,063 (18.76%)#1 | 174,982 (0.22%)#75 |
| 76. | Pontiac | 383 | 3,027 (12.65%)#2 | 174,982 (0.22%)#76 |
| 77. | Worthington | 381 | 24,591 (1.55%)#8 | 174,982 (0.22%)#77 |
| 78. | Garden Grove | 372 | 48,911 (0.76%)#21 | 174,982 (0.21%)#78 |
| 79. | Escondido | 372 | 48,911 (0.76%)#22 | 174,982 (0.21%)#79 |
| 80. | Gresham | 372 | 3,218 (11.56%)#2 | 174,982 (0.21%)#80 |
| 81. | Bridgeport | 369 | 1,845 (20.00%)#1 | 174,982 (0.21%)#81 |
| 82. | Blaine | 357 | 24,591 (1.45%)#9 | 174,982 (0.20%)#82 |
| 83. | San Pablo | 354 | 48,911 (0.72%)#23 | 174,982 (0.20%)#83 |
| 84. | La Crosse | 346 | 12,681 (2.73%)#9 | 174,982 (0.20%)#84 |
| 85. | Onalaska | 333 | 12,681 (2.63%)#10 | 174,982 (0.19%)#85 |
| 86. | North St Paul | 333 | 24,591 (1.35%)#10 | 174,982 (0.19%)#86 |
| 87. | Coon Rapids | 331 | 24,591 (1.35%)#11 | 174,982 (0.19%)#87 |
| 88. | Lathrop | 331 | 48,911 (0.68%)#24 | 174,982 (0.19%)#88 |
| 89. | Everett | 318 | 5,926 (5.37%)#5 | 174,982 (0.18%)#89 |
| 90. | Fairfield | 310 | 48,911 (0.63%)#25 | 174,982 (0.18%)#90 |
| 91. | Buffalo | 304 | 2,177 (13.96%)#2 | 174,982 (0.17%)#91 |
| 92. | Oshkosh | 302 | 12,681 (2.38%)#11 | 174,982 (0.17%)#92 |
| 93. | Indianapolis | 298 | 921 (32.36%)#1 | 174,982 (0.17%)#93 |
| 94. | Adelphi | 297 | 1,211 (24.53%)#1 | 174,982 (0.17%)#94 |
| 95. | Houston | 296 | 9,141 (3.24%)#8 | 174,982 (0.17%)#95 |
| 96. | Vineyard | 291 | 48,911 (0.59%)#26 | 174,982 (0.17%)#96 |
| 97. | Waco | 286 | 9,141 (3.13%)#9 | 174,982 (0.16%)#97 |
| 98. | Cranston | 279 | 2,091 (13.34%)#3 | 174,982 (0.16%)#98 |
| 99. | Chico | 278 | 48,911 (0.57%)#27 | 174,982 (0.16%)#99 |
| 100. | Thornton | 264 | 2,063 (12.80%)#2 | 174,982 (0.15%)#100 |
Common Questions
What are the Top 10 Cities with the Most Immigrants from Laos in the United States?
Top 10 Cities with the Most Immigrants from Laos in the United States are:
#1
8,129
#2
7,750
#3
5,913
#4
3,699
#5
3,401
#6
2,262
#7
2,044
#8
1,901
#9
1,875
#10
1,590
What city has the Most Immigrants from Laos in the United States?
St Paul has the Most Immigrants from Laos in the United States with 8,129.
What is the Total Immigrants from Laos in the United States?
Total Immigrants from Laos in the United States is 174,982.