Cities with the Highest Percentage of Navajo Population in Illinois
RELATED REPORTS & OPTIONS
Navajo
Illinois
Compare Cities
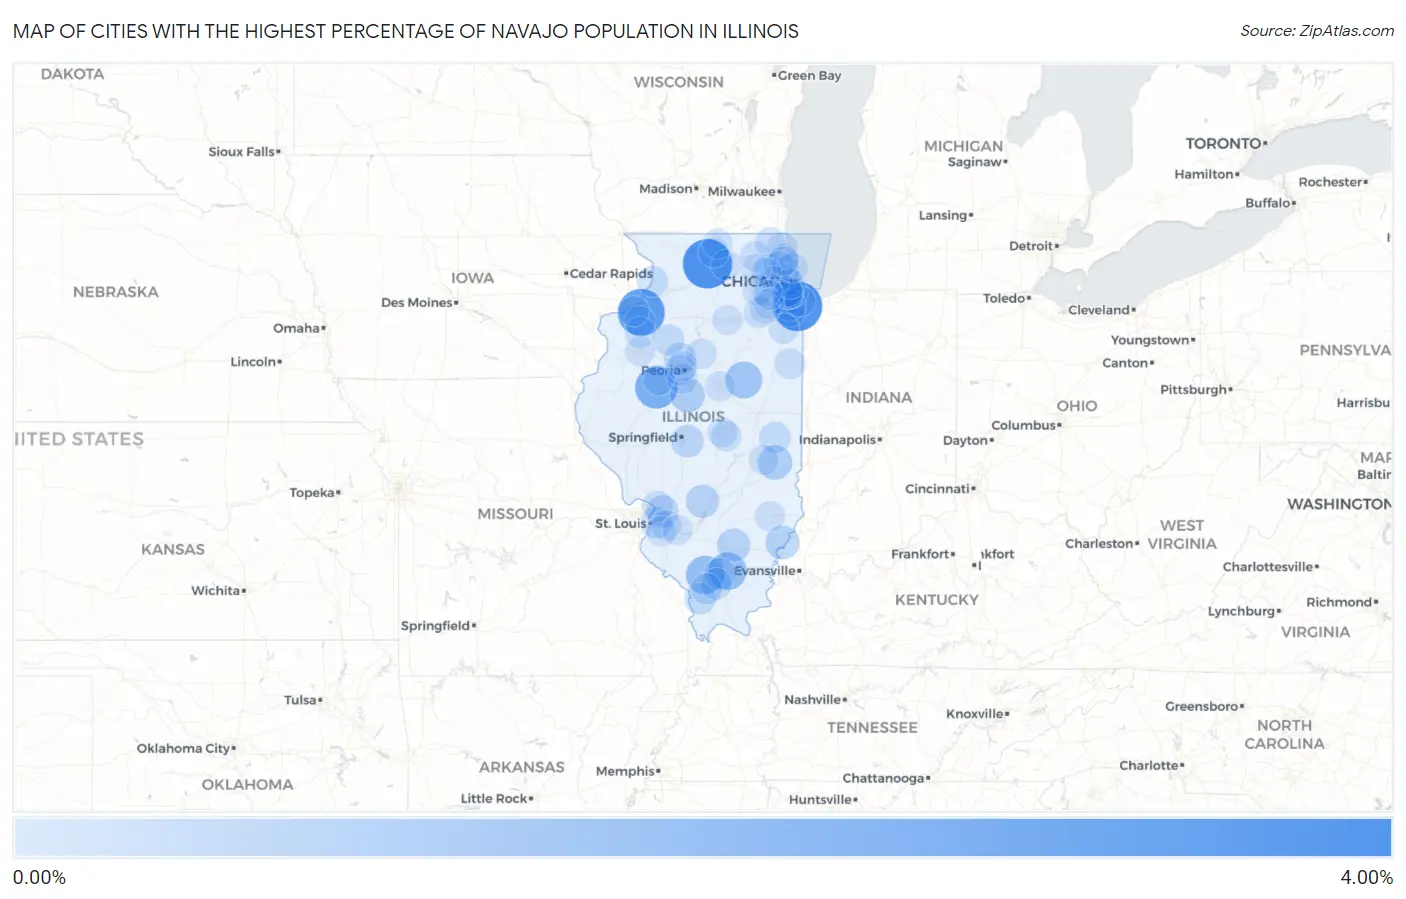
Map of Cities with the Highest Percentage of Navajo Population in Illinois
0.00%
4.00%
Cities with the Highest Percentage of Navajo Population in Illinois
| City | Navajo | vs State | vs National | |
| 1. | Glenwood | 3.59% | 0.019%(+3.58)#1 | 0.12%(+3.47)#234 |
| 2. | Stillman Valley | 3.57% | 0.019%(+3.55)#2 | 0.12%(+3.44)#237 |
| 3. | Colona | 3.13% | 0.019%(+3.11)#3 | 0.12%(+3.00)#250 |
| 4. | Bryant | 2.22% | 0.019%(+2.20)#4 | 0.12%(+2.10)#316 |
| 5. | Cahokia Heights | 1.88% | 0.019%(+1.86)#5 | 0.12%(+1.76)#346 |
| 6. | Elkville | 1.47% | 0.019%(+1.45)#6 | 0.12%(+1.34)#395 |
| 7. | Hanaford | 1.42% | 0.019%(+1.41)#7 | 0.12%(+1.30)#400 |
| 8. | Anchor | 1.20% | 0.019%(+1.19)#8 | 0.12%(+1.08)#442 |
| 9. | Delavan | 0.82% | 0.019%(+0.801)#9 | 0.12%(+0.696)#559 |
| 10. | Westfield | 0.80% | 0.019%(+0.776)#10 | 0.12%(+0.672)#563 |
| 11. | Keensburg | 0.66% | 0.019%(+0.643)#11 | 0.12%(+0.539)#631 |
| 12. | Mulberry Grove | 0.55% | 0.019%(+0.531)#12 | 0.12%(+0.427)#697 |
| 13. | Bluford | 0.54% | 0.019%(+0.522)#13 | 0.12%(+0.417)#704 |
| 14. | Forest Park | 0.48% | 0.019%(+0.461)#14 | 0.12%(+0.356)#742 |
| 15. | Rochester | 0.45% | 0.019%(+0.434)#15 | 0.12%(+0.329)#754 |
| 16. | Dunlap | 0.35% | 0.019%(+0.334)#16 | 0.12%(+0.229)#862 |
| 17. | Edwardsville | 0.35% | 0.019%(+0.330)#17 | 0.12%(+0.226)#868 |
| 18. | Orient | 0.32% | 0.019%(+0.303)#18 | 0.12%(+0.198)#898 |
| 19. | Alto Pass | 0.26% | 0.019%(+0.243)#19 | 0.12%(+0.139)#992 |
| 20. | Newman | 0.26% | 0.019%(+0.237)#20 | 0.12%(+0.133)#1,000 |
| 21. | Herrin | 0.24% | 0.019%(+0.224)#21 | 0.12%(+0.119)#1,028 |
| 22. | Washington Park | 0.23% | 0.019%(+0.206)#22 | 0.12%(+0.102)#1,067 |
| 23. | Toulon | 0.22% | 0.019%(+0.200)#23 | 0.12%(+0.096)#1,082 |
| 24. | Carbondale | 0.21% | 0.019%(+0.194)#24 | 0.12%(+0.090)#1,095 |
| 25. | Fulton | 0.17% | 0.019%(+0.152)#25 | 0.12%(+0.047)#1,196 |
| 26. | Country Club Hills | 0.17% | 0.019%(+0.150)#26 | 0.12%(+0.045)#1,198 |
| 27. | Bellevue | 0.13% | 0.019%(+0.111)#27 | 0.12%(+0.007)#1,317 |
| 28. | Alpha | 0.13% | 0.019%(+0.107)#28 | 0.12%(+0.003)#1,338 |
| 29. | Wood River | 0.12% | 0.019%(+0.097)#29 | 0.12%(-0.007)#1,379 |
| 30. | Watseka | 0.11% | 0.019%(+0.096)#30 | 0.12%(-0.009)#1,385 |
| 31. | Park Ridge | 0.11% | 0.019%(+0.095)#31 | 0.12%(-0.009)#1,386 |
| 32. | Washburn | 0.089% | 0.019%(+0.070)#32 | 0.12%(-0.035)#1,506 |
| 33. | Minooka | 0.087% | 0.019%(+0.068)#33 | 0.12%(-0.036)#1,514 |
| 34. | Long Creek | 0.076% | 0.019%(+0.057)#34 | 0.12%(-0.048)#1,576 |
| 35. | Pekin | 0.072% | 0.019%(+0.053)#35 | 0.12%(-0.052)#1,615 |
| 36. | Richton Park | 0.071% | 0.019%(+0.052)#36 | 0.12%(-0.053)#1,626 |
| 37. | Kirkland | 0.067% | 0.019%(+0.048)#37 | 0.12%(-0.057)#1,646 |
| 38. | Calumet City | 0.056% | 0.019%(+0.037)#38 | 0.12%(-0.068)#1,707 |
| 39. | Canton | 0.052% | 0.019%(+0.033)#39 | 0.12%(-0.071)#1,740 |
| 40. | Lake In The Hills | 0.052% | 0.019%(+0.033)#40 | 0.12%(-0.072)#1,745 |
| 41. | Orion | 0.051% | 0.019%(+0.032)#41 | 0.12%(-0.073)#1,749 |
| 42. | Evergreen Park | 0.051% | 0.019%(+0.032)#42 | 0.12%(-0.073)#1,752 |
| 43. | Oak Lawn | 0.047% | 0.019%(+0.028)#43 | 0.12%(-0.077)#1,782 |
| 44. | Manteno | 0.046% | 0.019%(+0.027)#44 | 0.12%(-0.077)#1,785 |
| 45. | Moline | 0.045% | 0.019%(+0.026)#45 | 0.12%(-0.079)#1,795 |
| 46. | North Chicago | 0.042% | 0.019%(+0.023)#46 | 0.12%(-0.082)#1,818 |
| 47. | Chicago Ridge | 0.042% | 0.019%(+0.023)#47 | 0.12%(-0.082)#1,821 |
| 48. | Deerfield | 0.042% | 0.019%(+0.023)#48 | 0.12%(-0.082)#1,825 |
| 49. | Round Lake Beach | 0.040% | 0.019%(+0.021)#49 | 0.12%(-0.083)#1,834 |
| 50. | Schaumburg | 0.040% | 0.019%(+0.021)#50 | 0.12%(-0.084)#1,838 |
| 51. | Burbank | 0.038% | 0.019%(+0.019)#51 | 0.12%(-0.086)#1,860 |
| 52. | O Fallon | 0.034% | 0.019%(+0.015)#52 | 0.12%(-0.089)#1,901 |
| 53. | Belleville | 0.033% | 0.019%(+0.014)#53 | 0.12%(-0.090)#1,915 |
| 54. | New Baden | 0.029% | 0.019%(+0.010)#54 | 0.12%(-0.095)#1,973 |
| 55. | Charleston | 0.028% | 0.019%(+0.009)#55 | 0.12%(-0.096)#1,988 |
| 56. | Joliet | 0.025% | 0.019%(+0.006)#56 | 0.12%(-0.098)#2,015 |
| 57. | Decatur | 0.024% | 0.019%(+0.005)#57 | 0.12%(-0.100)#2,028 |
| 58. | Mount Prospect | 0.023% | 0.019%(+0.004)#58 | 0.12%(-0.100)#2,038 |
| 59. | Aurora | 0.022% | 0.019%(+0.003)#59 | 0.12%(-0.102)#2,056 |
| 60. | Peoria | 0.021% | 0.019%(+0.002)#60 | 0.12%(-0.102)#2,068 |
| 61. | Lombard | 0.020% | 0.019%(+0.001)#61 | 0.12%(-0.103)#2,074 |
| 62. | Galesburg | 0.020% | 0.019%(+0.001)#62 | 0.12%(-0.104)#2,081 |
| 63. | Chicago | 0.019% | 0.019%(-0.000)#63 | 0.12%(-0.105)#2,105 |
| 64. | Evanston | 0.018% | 0.019%(-0.001)#64 | 0.12%(-0.105)#2,111 |
| 65. | Naperville | 0.018% | 0.019%(-0.001)#65 | 0.12%(-0.106)#2,112 |
| 66. | Northbrook | 0.017% | 0.019%(-0.002)#66 | 0.12%(-0.106)#2,121 |
| 67. | Hanover Park | 0.016% | 0.019%(-0.003)#67 | 0.12%(-0.108)#2,134 |
| 68. | Crest Hill | 0.015% | 0.019%(-0.004)#68 | 0.12%(-0.109)#2,154 |
| 69. | Bolingbrook | 0.015% | 0.019%(-0.004)#69 | 0.12%(-0.109)#2,158 |
| 70. | Machesney Park | 0.013% | 0.019%(-0.006)#70 | 0.12%(-0.110)#2,176 |
| 71. | Bloomington | 0.011% | 0.019%(-0.008)#71 | 0.12%(-0.112)#2,202 |
| 72. | Olney | 0.011% | 0.019%(-0.008)#72 | 0.12%(-0.113)#2,206 |
| 73. | Ottawa | 0.011% | 0.019%(-0.008)#73 | 0.12%(-0.113)#2,209 |
| 74. | Rockford | 0.0094% | 0.019%(-0.010)#74 | 0.12%(-0.114)#2,222 |
| 75. | Elgin | 0.0053% | 0.019%(-0.014)#75 | 0.12%(-0.118)#2,287 |
Common Questions
What are the Top 10 Cities with the Highest Percentage of Navajo Population in Illinois?
Top 10 Cities with the Highest Percentage of Navajo Population in Illinois are:
What city has the Highest Percentage of Navajo Population in Illinois?
Glenwood has the Highest Percentage of Navajo Population in Illinois with 3.59%.
What is the Percentage of Navajo Population in the State of Illinois?
Percentage of Navajo Population in Illinois is 0.019%.
What is the Percentage of Navajo Population in the United States?
Percentage of Navajo Population in the United States is 0.12%.