Cities with the Highest Percentage of Households Residing in Detached Homes in New Mexico
RELATED REPORTS & OPTIONS
Detached Home Residency
New Mexico
Compare Cities
Map of Cities with the Highest Percentage of Households Residing in Detached Homes in New Mexico
0.0%
100.0%
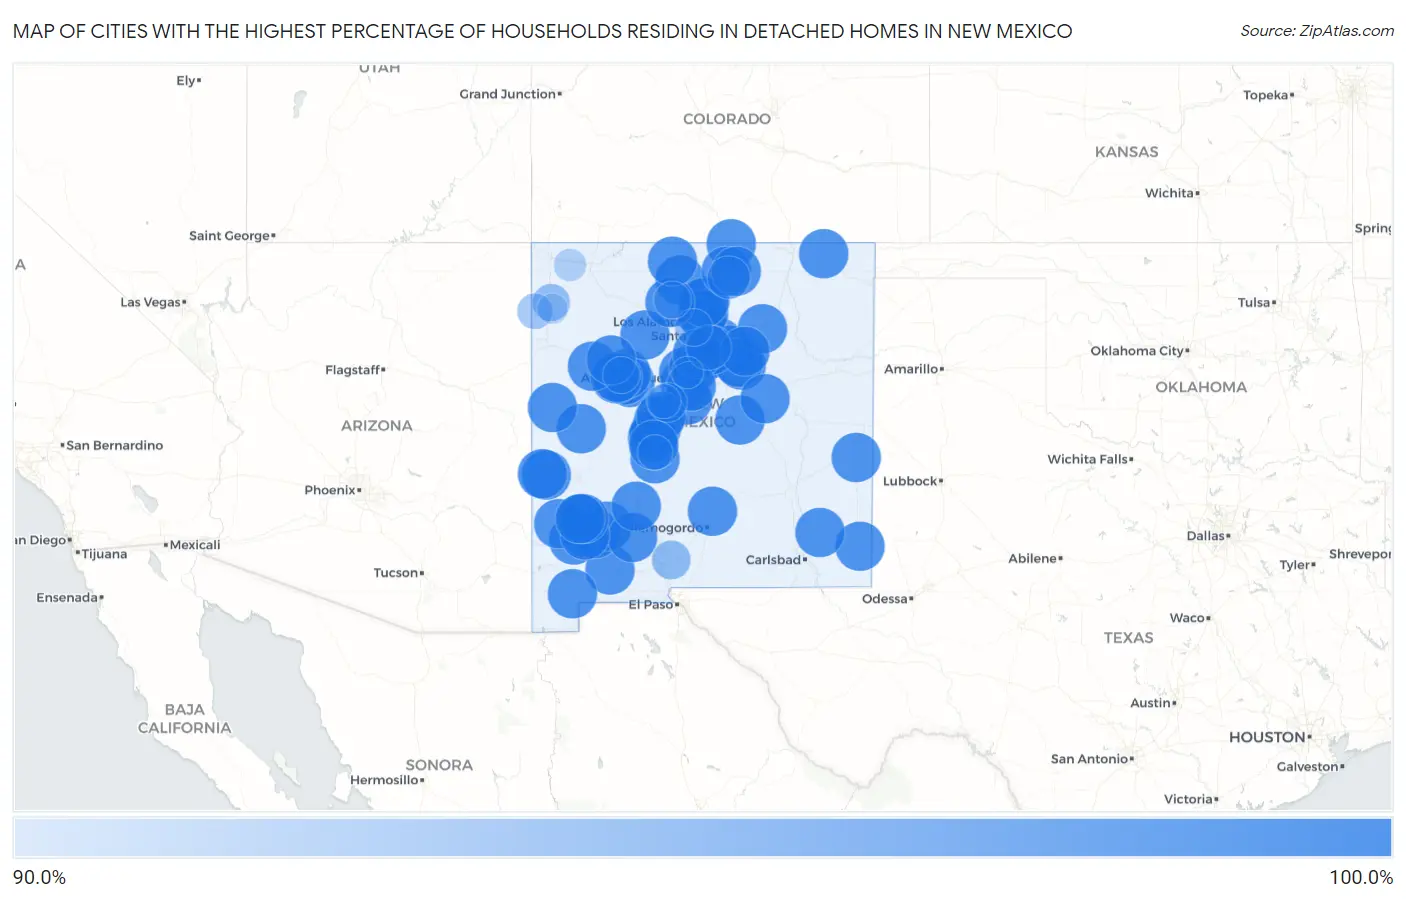
Cities with the Highest Percentage of Households Residing in Detached Homes in New Mexico
| City | Detached Home Residency | vs State | vs National | |
| 1. | Mesita | 100.0% | 65.7% (+34.3)#1 | 62.5% (+37.5)#160 |
| 2. | Tyrone | 100.0% | 65.7% (+34.3)#2 | 62.5% (+37.5)#337 |
| 3. | Laguna | 100.0% | 65.7% (+34.3)#3 | 62.5% (+37.5)#363 |
| 4. | Paa-Ko | 100.0% | 65.7% (+34.3)#4 | 62.5% (+37.5)#388 |
| 5. | Canova | 100.0% | 65.7% (+34.3)#5 | 62.5% (+37.5)#416 |
| 6. | Cedro | 100.0% | 65.7% (+34.3)#6 | 62.5% (+37.5)#424 |
| 7. | Glorieta | 100.0% | 65.7% (+34.3)#7 | 62.5% (+37.5)#447 |
| 8. | Paguate | 100.0% | 65.7% (+34.3)#8 | 62.5% (+37.5)#508 |
| 9. | Pecan Park | 100.0% | 65.7% (+34.3)#9 | 62.5% (+37.5)#518 |
| 10. | Villanueva | 100.0% | 65.7% (+34.3)#11 | 62.5% (+37.5)#566 |
| 11. | Cuartelez | 100.0% | 65.7% (+34.3)#12 | 62.5% (+37.5)#568 |
| 12. | Hyde Park | 100.0% | 65.7% (+34.3)#13 | 62.5% (+37.5)#583 |
| 13. | Costilla | 100.0% | 65.7% (+34.3)#14 | 62.5% (+37.5)#590 |
| 14. | Sandia Park | 100.0% | 65.7% (+34.3)#15 | 62.5% (+37.5)#592 |
| 15. | Fort Wingate | 100.0% | 65.7% (+34.3)#16 | 62.5% (+37.5)#638 |
| 16. | Ojo Sarco | 100.0% | 65.7% (+34.3)#17 | 62.5% (+37.5)#834 |
| 17. | Becenti | 100.0% | 65.7% (+34.3)#18 | 62.5% (+37.5)#853 |
| 18. | Hanover | 100.0% | 65.7% (+34.3)#19 | 62.5% (+37.5)#899 |
| 19. | San Lorenzo | 100.0% | 65.7% (+34.3)#20 | 62.5% (+37.5)#900 |
| 20. | San Pedro | 100.0% | 65.7% (+34.3)#21 | 62.5% (+37.5)#990 |
| 21. | North Acomita Village | 100.0% | 65.7% (+34.3)#22 | 62.5% (+37.5)#1,000 |
| 22. | North San Ysidro | 100.0% | 65.7% (+34.3)#23 | 62.5% (+37.5)#1,063 |
| 23. | Gila | 100.0% | 65.7% (+34.3)#24 | 62.5% (+37.5)#1,161 |
| 24. | Bent | 100.0% | 65.7% (+34.3)#25 | 62.5% (+37.5)#1,179 |
| 25. | Tajique | 100.0% | 65.7% (+34.3)#26 | 62.5% (+37.5)#1,209 |
| 26. | Pie Town | 100.0% | 65.7% (+34.3)#27 | 62.5% (+37.5)#1,215 |
| 27. | Galisteo | 100.0% | 65.7% (+34.3)#28 | 62.5% (+37.5)#1,228 |
| 28. | San Luis | 100.0% | 65.7% (+34.3)#29 | 62.5% (+37.5)#1,281 |
| 29. | Abeytas | 100.0% | 65.7% (+34.3)#30 | 62.5% (+37.5)#1,318 |
| 30. | Sena | 100.0% | 65.7% (+34.3)#31 | 62.5% (+37.5)#1,328 |
| 31. | Golden Acres | 100.0% | 65.7% (+34.3)#32 | 62.5% (+37.5)#1,382 |
| 32. | La Joya | 100.0% | 65.7% (+34.3)#33 | 62.5% (+37.5)#1,411 |
| 33. | Canjilon | 100.0% | 65.7% (+34.3)#34 | 62.5% (+37.5)#1,442 |
| 34. | Monument | 100.0% | 65.7% (+34.3)#35 | 62.5% (+37.5)#1,506 |
| 35. | Sombrillo | 100.0% | 65.7% (+34.3)#36 | 62.5% (+37.5)#1,586 |
| 36. | Lamy | 100.0% | 65.7% (+34.3)#37 | 62.5% (+37.5)#1,602 |
| 37. | Fence Lake | 100.0% | 65.7% (+34.3)#38 | 62.5% (+37.5)#1,627 |
| 38. | Los Cerrillos | 100.0% | 65.7% (+34.3)#39 | 62.5% (+37.5)#1,762 |
| 39. | Lyden | 100.0% | 65.7% (+34.3)#40 | 62.5% (+37.5)#1,808 |
| 40. | Kingston | 100.0% | 65.7% (+34.3)#41 | 62.5% (+37.5)#1,828 |
| 41. | San Cristobal | 100.0% | 65.7% (+34.3)#42 | 62.5% (+37.5)#1,913 |
| 42. | Garfield | 100.0% | 65.7% (+34.3)#43 | 62.5% (+37.5)#1,978 |
| 43. | Encantado | 100.0% | 65.7% (+34.3)#44 | 62.5% (+37.5)#1,979 |
| 44. | Cubero | 100.0% | 65.7% (+34.3)#45 | 62.5% (+37.5)#1,995 |
| 45. | Loco Hills | 100.0% | 65.7% (+34.3)#46 | 62.5% (+37.5)#2,036 |
| 46. | San Antonio | 100.0% | 65.7% (+34.3)#47 | 62.5% (+37.5)#2,052 |
| 47. | Taos Ski Valley | 100.0% | 65.7% (+34.3)#48 | 62.5% (+37.5)#2,112 |
| 48. | Dora | 100.0% | 65.7% (+34.3)#49 | 62.5% (+37.5)#2,127 |
| 49. | El Morro Valley | 100.0% | 65.7% (+34.3)#50 | 62.5% (+37.5)#2,173 |
| 50. | Hot Springs Landing | 100.0% | 65.7% (+34.3)#51 | 62.5% (+37.5)#2,187 |
| 51. | Watrous | 100.0% | 65.7% (+34.3)#52 | 62.5% (+37.5)#2,188 |
| 52. | Chamizal | 100.0% | 65.7% (+34.3)#53 | 62.5% (+37.5)#2,301 |
| 53. | Lake Roberts | 100.0% | 65.7% (+34.3)#54 | 62.5% (+37.5)#2,317 |
| 54. | Manzano Springs | 100.0% | 65.7% (+34.3)#55 | 62.5% (+37.5)#2,318 |
| 55. | Folsom | 100.0% | 65.7% (+34.3)#56 | 62.5% (+37.5)#2,328 |
| 56. | Ojo Caliente | 100.0% | 65.7% (+34.3)#57 | 62.5% (+37.5)#2,342 |
| 57. | San Acacia | 100.0% | 65.7% (+34.3)#58 | 62.5% (+37.5)#2,537 |
| 58. | Rivers | 100.0% | 65.7% (+34.3)#59 | 62.5% (+37.5)#2,538 |
| 59. | Rancho Grande | 100.0% | 65.7% (+34.3)#60 | 62.5% (+37.5)#2,566 |
| 60. | Cobre | 100.0% | 65.7% (+34.3)#61 | 62.5% (+37.5)#2,580 |
| 61. | Coyote | 100.0% | 65.7% (+34.3)#62 | 62.5% (+37.5)#2,581 |
| 62. | Veguita | 100.0% | 65.7% (+34.3)#63 | 62.5% (+37.5)#2,599 |
| 63. | Seton | 100.0% | 65.7% (+34.3)#64 | 62.5% (+37.5)#2,623 |
| 64. | Bluewater Village | 100.0% | 65.7% (+34.3)#65 | 62.5% (+37.5)#2,690 |
| 65. | Tecolote | 100.0% | 65.7% (+34.3)#66 | 62.5% (+37.5)#2,705 |
| 66. | Deer Canyon | 100.0% | 65.7% (+34.3)#67 | 62.5% (+37.5)#2,706 |
| 67. | Lake Roberts Heights | 100.0% | 65.7% (+34.3)#68 | 62.5% (+37.5)#2,727 |
| 68. | San Mateo | 100.0% | 65.7% (+34.3)#69 | 62.5% (+37.5)#2,766 |
| 69. | Los Ojos | 100.0% | 65.7% (+34.3)#70 | 62.5% (+37.5)#2,804 |
| 70. | Trout Valley | 100.0% | 65.7% (+34.3)#72 | 62.5% (+37.5)#2,832 |
| 71. | Duran | 100.0% | 65.7% (+34.3)#73 | 62.5% (+37.5)#2,833 |
| 72. | Redrock | 100.0% | 65.7% (+34.3)#74 | 62.5% (+37.5)#2,834 |
| 73. | Escondida | 100.0% | 65.7% (+34.3)#75 | 62.5% (+37.5)#2,849 |
| 74. | Hachita | 100.0% | 65.7% (+34.3)#76 | 62.5% (+37.5)#2,891 |
| 75. | Mogollon | 100.0% | 65.7% (+34.3)#77 | 62.5% (+37.5)#3,055 |
| 76. | Pastura | 100.0% | 65.7% (+34.3)#78 | 62.5% (+37.5)#3,091 |
| 77. | Purty Rock | 100.0% | 65.7% (+34.3)#79 | 62.5% (+37.5)#3,102 |
| 78. | Eldorado At Santa Fe | 98.7% | 65.7% (+33.0)#80 | 62.5% (+36.2)#3,383 |
| 79. | Las Campanas | 98.4% | 65.7% (+32.7)#81 | 62.5% (+35.9)#3,503 |
| 80. | Conejo | 98.1% | 65.7% (+32.4)#82 | 62.5% (+35.6)#3,634 |
| 81. | Arroyo Seco | 98.0% | 65.7% (+32.3)#83 | 62.5% (+35.5)#3,668 |
| 82. | Tano Road | 97.5% | 65.7% (+31.8)#84 | 62.5% (+35.0)#3,882 |
| 83. | Santa Fe Foothills | 97.3% | 65.7% (+31.6)#85 | 62.5% (+34.8)#3,977 |
| 84. | Las Maravillas | 96.9% | 65.7% (+31.2)#86 | 62.5% (+34.4)#4,176 |
| 85. | Organ | 96.8% | 65.7% (+31.1)#87 | 62.5% (+34.3)#4,262 |
| 86. | White Rock | 96.4% | 65.7% (+30.7)#88 | 62.5% (+33.9)#4,415 |
| 87. | Sheep Springs | 96.4% | 65.7% (+30.7)#89 | 62.5% (+33.9)#4,446 |
| 88. | Youngsville | 96.4% | 65.7% (+30.7)#90 | 62.5% (+33.9)#4,466 |
| 89. | Encinal | 96.2% | 65.7% (+30.5)#91 | 62.5% (+33.7)#4,559 |
| 90. | Crystal | 95.9% | 65.7% (+30.2)#92 | 62.5% (+33.4)#4,698 |
| 91. | Timberlake | 95.8% | 65.7% (+30.1)#93 | 62.5% (+33.3)#4,742 |
| 92. | Luis Lopez | 95.7% | 65.7% (+30.0)#94 | 62.5% (+33.2)#4,824 |
| 93. | Tome | 95.5% | 65.7% (+29.8)#95 | 62.5% (+33.0)#4,894 |
| 94. | Ojo Encino | 95.4% | 65.7% (+29.7)#96 | 62.5% (+32.9)#4,962 |
| 95. | Placitas Cdp Sandoval County | 95.3% | 65.7% (+29.6)#97 | 62.5% (+32.8)#4,978 |
| 96. | Ojo Amarillo | 95.0% | 65.7% (+29.3)#98 | 62.5% (+32.5)#5,165 |
| 97. | Sandia Knolls | 94.8% | 65.7% (+29.1)#99 | 62.5% (+32.3)#5,243 |
| 98. | San Antonito Cdp Bernalillo County | 94.4% | 65.7% (+28.7)#100 | 62.5% (+31.9)#5,413 |
| 99. | Naschitti | 94.4% | 65.7% (+28.7)#101 | 62.5% (+31.9)#5,427 |
| 100. | Picacho Hills | 93.6% | 65.7% (+27.9)#102 | 62.5% (+31.1)#5,859 |
Common Questions
What are the Top 10 Cities with the Highest Percentage of Households Residing in Detached Homes in New Mexico?
Top 10 Cities with the Highest Percentage of Households Residing in Detached Homes in New Mexico are:
#1
100.0%
#2
100.0%
#3
100.0%
#4
100.0%
#5
100.0%
#6
100.0%
#7
100.0%
#8
100.0%
#9
100.0%
#10
100.0%
What city has the Highest Percentage of Households Residing in Detached Homes in New Mexico?
Mesita has the Highest Percentage of Households Residing in Detached Homes in New Mexico with 100.0%.
What is the Percentage of Households Residing in Detached Homes in the State of New Mexico?
Percentage of Households Residing in Detached Homes in New Mexico is 65.7%.
What is the Percentage of Households Residing in Detached Homes in the United States?
Percentage of Households Residing in Detached Homes in the United States is 62.5%.