Cities with the Highest Percentage of Households Residing in Detached Homes in Connecticut
RELATED REPORTS & OPTIONS
Detached Home Residency
Connecticut
Compare Cities
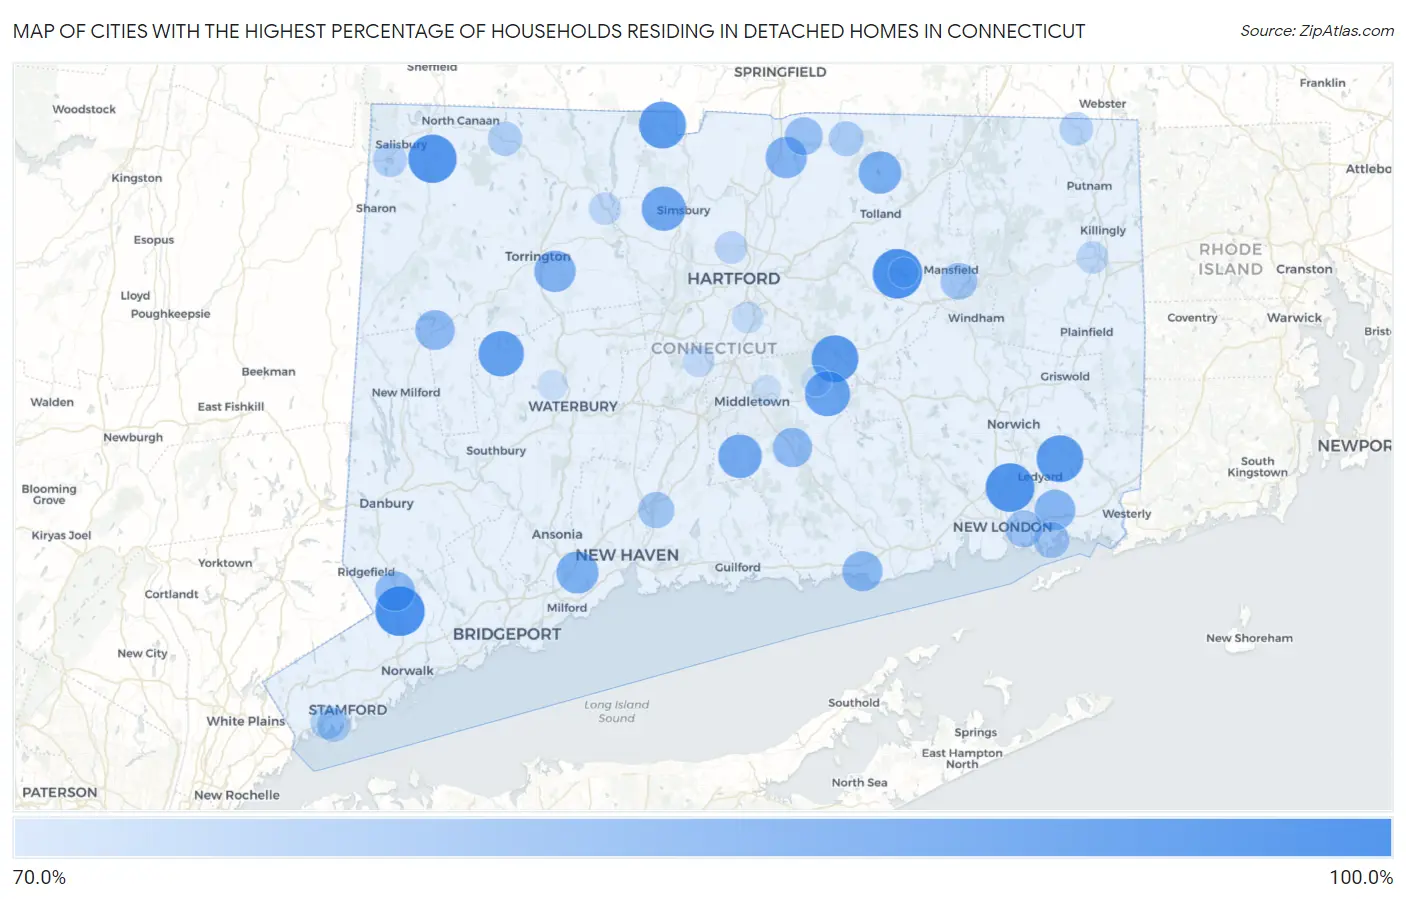
Map of Cities with the Highest Percentage of Households Residing in Detached Homes in Connecticut
0.0%
100.0%
Cities with the Highest Percentage of Households Residing in Detached Homes in Connecticut
| City | Detached Home Residency | vs State | vs National | |
| 1. | Coventry Lake | 100.0% | 59.8%(+40.2)#1 | 62.5%(+37.5)#67 |
| 2. | Mill Plain | 100.0% | 59.8%(+40.2)#2 | 62.5%(+37.5)#92 |
| 3. | Lakes East | 100.0% | 59.8%(+40.2)#3 | 62.5%(+37.5)#132 |
| 4. | Poplar Plains | 100.0% | 59.8%(+40.2)#4 | 62.5%(+37.5)#136 |
| 5. | Lakes West | 100.0% | 59.8%(+40.2)#5 | 62.5%(+37.5)#145 |
| 6. | Bigelow Corners | 100.0% | 59.8%(+40.2)#6 | 62.5%(+37.5)#244 |
| 7. | Plattsville | 100.0% | 59.8%(+40.2)#7 | 62.5%(+37.5)#266 |
| 8. | Weston | 100.0% | 59.8%(+40.2)#8 | 62.5%(+37.5)#298 |
| 9. | Candlewood Shores | 100.0% | 59.8%(+40.2)#9 | 62.5%(+37.5)#305 |
| 10. | Candlewood Orchards | 100.0% | 59.8%(+40.2)#10 | 62.5%(+37.5)#364 |
| 11. | Botsford | 100.0% | 59.8%(+40.2)#11 | 62.5%(+37.5)#428 |
| 12. | Taylor Corners | 100.0% | 59.8%(+40.2)#12 | 62.5%(+37.5)#431 |
| 13. | Gaylordsville | 100.0% | 59.8%(+40.2)#13 | 62.5%(+37.5)#456 |
| 14. | Cannondale | 100.0% | 59.8%(+40.2)#14 | 62.5%(+37.5)#461 |
| 15. | Lake Bungee | 100.0% | 59.8%(+40.2)#15 | 62.5%(+37.5)#482 |
| 16. | Mamanasco Lake | 100.0% | 59.8%(+40.2)#16 | 62.5%(+37.5)#522 |
| 17. | Candlewood Isle | 100.0% | 59.8%(+40.2)#17 | 62.5%(+37.5)#525 |
| 18. | West Mountain | 100.0% | 59.8%(+40.2)#18 | 62.5%(+37.5)#580 |
| 19. | Rock Ridge | 100.0% | 59.8%(+40.2)#19 | 62.5%(+37.5)#585 |
| 20. | Witches Woods | 100.0% | 59.8%(+40.2)#20 | 62.5%(+37.5)#610 |
| 21. | Riverton | 100.0% | 59.8%(+40.2)#21 | 62.5%(+37.5)#710 |
| 22. | Knollcrest | 100.0% | 59.8%(+40.2)#22 | 62.5%(+37.5)#775 |
| 23. | Lake Chaffee | 100.0% | 59.8%(+40.2)#23 | 62.5%(+37.5)#780 |
| 24. | Redding Center | 100.0% | 59.8%(+40.2)#24 | 62.5%(+37.5)#904 |
| 25. | Quasset Lake | 100.0% | 59.8%(+40.2)#25 | 62.5%(+37.5)#952 |
| 26. | Bogus Hill | 100.0% | 59.8%(+40.2)#26 | 62.5%(+37.5)#1,125 |
| 27. | Topstone | 100.0% | 59.8%(+40.2)#27 | 62.5%(+37.5)#1,220 |
| 28. | Candlewood Knolls | 100.0% | 59.8%(+40.2)#28 | 62.5%(+37.5)#1,264 |
| 29. | Candlewood Lake Club | 100.0% | 59.8%(+40.2)#29 | 62.5%(+37.5)#1,406 |
| 30. | Sail Harbor | 100.0% | 59.8%(+40.2)#30 | 62.5%(+37.5)#1,415 |
| 31. | Chimney Point | 100.0% | 59.8%(+40.2)#31 | 62.5%(+37.5)#1,708 |
| 32. | Sherman | 100.0% | 59.8%(+40.2)#32 | 62.5%(+37.5)#2,573 |
| 33. | Daniels Farm | 99.1% | 59.8%(+39.3)#33 | 62.5%(+36.6)#3,251 |
| 34. | Gales Ferry | 98.8% | 59.8%(+39.0)#34 | 62.5%(+36.3)#3,362 |
| 35. | Ball Pond | 98.6% | 59.8%(+38.8)#35 | 62.5%(+36.1)#3,420 |
| 36. | Falls Village | 98.4% | 59.8%(+38.6)#36 | 62.5%(+35.9)#3,515 |
| 37. | Groton Long Point Borough | 97.7% | 59.8%(+37.9)#37 | 62.5%(+35.2)#3,805 |
| 38. | Tokeneke | 97.5% | 59.8%(+37.7)#38 | 62.5%(+35.0)#3,876 |
| 39. | Coleytown | 97.4% | 59.8%(+37.6)#39 | 62.5%(+34.9)#3,922 |
| 40. | Murray | 97.3% | 59.8%(+37.5)#40 | 62.5%(+34.8)#3,978 |
| 41. | Newtown Borough | 97.1% | 59.8%(+37.3)#41 | 62.5%(+34.6)#4,057 |
| 42. | Ridgebury | 97.0% | 59.8%(+37.2)#42 | 62.5%(+34.5)#4,109 |
| 43. | North Granby | 96.7% | 59.8%(+36.9)#43 | 62.5%(+34.2)#4,282 |
| 44. | Terramuggus | 96.5% | 59.8%(+36.7)#44 | 62.5%(+34.0)#4,391 |
| 45. | East | 96.4% | 59.8%(+36.6)#45 | 62.5%(+33.9)#4,416 |
| 46. | Mashantucket | 96.4% | 59.8%(+36.6)#46 | 62.5%(+33.9)#4,464 |
| 47. | Fenwick Borough | 95.8% | 59.8%(+36.0)#47 | 62.5%(+33.3)#4,760 |
| 48. | Bethlehem Village | 94.8% | 59.8%(+35.0)#48 | 62.5%(+32.3)#5,236 |
| 49. | East Hampton | 94.1% | 59.8%(+34.3)#49 | 62.5%(+31.6)#5,569 |
| 50. | Lakeside Woods | 93.4% | 59.8%(+33.6)#50 | 62.5%(+30.9)#5,994 |
| 51. | West Simsbury | 92.9% | 59.8%(+33.1)#51 | 62.5%(+30.4)#6,203 |
| 52. | Bridgewater | 92.7% | 59.8%(+32.9)#52 | 62.5%(+30.2)#6,355 |
| 53. | Durham | 92.0% | 59.8%(+32.2)#53 | 62.5%(+29.5)#6,719 |
| 54. | Old Hill | 91.9% | 59.8%(+32.1)#54 | 62.5%(+29.4)#6,785 |
| 55. | Cornwall | 91.9% | 59.8%(+32.1)#55 | 62.5%(+29.4)#6,827 |
| 56. | Sandy Hook | 91.6% | 59.8%(+31.8)#56 | 62.5%(+29.1)#6,957 |
| 57. | Staples | 91.4% | 59.8%(+31.6)#57 | 62.5%(+28.9)#7,060 |
| 58. | Tashua | 91.3% | 59.8%(+31.5)#58 | 62.5%(+28.8)#7,130 |
| 59. | Northford | 91.2% | 59.8%(+31.4)#59 | 62.5%(+28.7)#7,191 |
| 60. | Compo | 91.1% | 59.8%(+31.3)#60 | 62.5%(+28.6)#7,246 |
| 61. | Crystal Lake | 90.7% | 59.8%(+30.9)#61 | 62.5%(+28.2)#7,498 |
| 62. | Inglenook | 90.4% | 59.8%(+30.6)#62 | 62.5%(+27.9)#7,705 |
| 63. | Orange | 90.0% | 59.8%(+30.2)#63 | 62.5%(+27.5)#7,900 |
| 64. | Northwest Harwinton | 89.3% | 59.8%(+29.5)#64 | 62.5%(+26.8)#8,296 |
| 65. | Southwood Acres | 89.1% | 59.8%(+29.3)#65 | 62.5%(+26.6)#8,409 |
| 66. | West Cornwall | 88.5% | 59.8%(+28.7)#66 | 62.5%(+26.0)#8,865 |
| 67. | Old Mystic | 88.2% | 59.8%(+28.4)#67 | 62.5%(+25.7)#8,997 |
| 68. | Saybrook Manor | 87.4% | 59.8%(+27.6)#68 | 62.5%(+24.9)#9,521 |
| 69. | Georgetown | 86.9% | 59.8%(+27.1)#69 | 62.5%(+24.4)#9,787 |
| 70. | New Preston | 86.9% | 59.8%(+27.1)#70 | 62.5%(+24.4)#9,798 |
| 71. | Indian Field | 86.9% | 59.8%(+27.1)#71 | 62.5%(+24.4)#9,812 |
| 72. | Higganum | 86.4% | 59.8%(+26.6)#72 | 62.5%(+23.9)#10,086 |
| 73. | Dayville | 85.2% | 59.8%(+25.4)#73 | 62.5%(+22.7)#10,868 |
| 74. | Noroton Heights | 85.0% | 59.8%(+25.2)#74 | 62.5%(+22.5)#10,964 |
| 75. | Westport | 85.0% | 59.8%(+25.2)#75 | 62.5%(+22.5)#10,966 |
| 76. | Hazardville | 84.5% | 59.8%(+24.7)#76 | 62.5%(+22.0)#11,284 |
| 77. | Lordship | 83.9% | 59.8%(+24.1)#77 | 62.5%(+21.4)#11,692 |
| 78. | Long Hill | 83.4% | 59.8%(+23.6)#78 | 62.5%(+20.9)#11,974 |
| 79. | Mansfield Center | 83.0% | 59.8%(+23.2)#79 | 62.5%(+20.5)#12,255 |
| 80. | North Haven | 82.3% | 59.8%(+22.5)#80 | 62.5%(+19.8)#12,704 |
| 81. | Noank | 82.1% | 59.8%(+22.3)#81 | 62.5%(+19.6)#12,830 |
| 82. | Greens Farms | 81.9% | 59.8%(+22.1)#82 | 62.5%(+19.4)#12,940 |
| 83. | Somers | 80.6% | 59.8%(+20.8)#83 | 62.5%(+18.1)#13,725 |
| 84. | Trumbull Center | 80.4% | 59.8%(+20.6)#84 | 62.5%(+17.9)#13,837 |
| 85. | Norfolk | 79.9% | 59.8%(+20.1)#85 | 62.5%(+17.4)#14,223 |
| 86. | Lakeville | 79.4% | 59.8%(+19.6)#86 | 62.5%(+16.9)#14,503 |
| 87. | Riverside | 79.3% | 59.8%(+19.5)#87 | 62.5%(+16.8)#14,534 |
| 88. | Old Greenwich | 79.3% | 59.8%(+19.5)#88 | 62.5%(+16.8)#14,539 |
| 89. | Noroton | 79.0% | 59.8%(+19.2)#89 | 62.5%(+16.5)#14,734 |
| 90. | Quinebaug | 78.9% | 59.8%(+19.1)#90 | 62.5%(+16.4)#14,820 |
| 91. | Blue Hills | 77.6% | 59.8%(+17.8)#91 | 62.5%(+15.1)#15,655 |
| 92. | New Hartford Center | 77.5% | 59.8%(+17.7)#92 | 62.5%(+15.0)#15,719 |
| 93. | East Brooklyn | 77.2% | 59.8%(+17.4)#93 | 62.5%(+14.7)#15,906 |
| 94. | Kensington | 76.5% | 59.8%(+16.7)#94 | 62.5%(+14.0)#16,340 |
| 95. | Wethersfield | 76.2% | 59.8%(+16.4)#95 | 62.5%(+13.7)#16,514 |
| 96. | Litchfield Borough | 75.7% | 59.8%(+15.9)#96 | 62.5%(+13.2)#16,848 |
| 97. | Oakville | 74.9% | 59.8%(+15.1)#97 | 62.5%(+12.4)#17,357 |
| 98. | Portland | 74.6% | 59.8%(+14.8)#98 | 62.5%(+12.1)#17,536 |
| 99. | Lake Pocotopaug | 74.6% | 59.8%(+14.8)#99 | 62.5%(+12.1)#17,539 |
| 100. | South Coventry | 74.4% | 59.8%(+14.6)#100 | 62.5%(+11.9)#17,686 |
Common Questions
What are the Top 10 Cities with the Highest Percentage of Households Residing in Detached Homes in Connecticut?
Top 10 Cities with the Highest Percentage of Households Residing in Detached Homes in Connecticut are:
#1
100.0%
#2
100.0%
#3
98.8%
#4
98.4%
#5
96.7%
#6
96.5%
#7
96.4%
#8
94.8%
#9
94.1%
#10
92.9%
What city has the Highest Percentage of Households Residing in Detached Homes in Connecticut?
Coventry Lake has the Highest Percentage of Households Residing in Detached Homes in Connecticut with 100.0%.
What is the Percentage of Households Residing in Detached Homes in the State of Connecticut?
Percentage of Households Residing in Detached Homes in Connecticut is 59.8%.
What is the Percentage of Households Residing in Detached Homes in the United States?
Percentage of Households Residing in Detached Homes in the United States is 62.5%.