Cities with the Highest Percentage of Households Residing in Detached Homes in Vermont
RELATED REPORTS & OPTIONS
Detached Home Residency
Vermont
Compare Cities
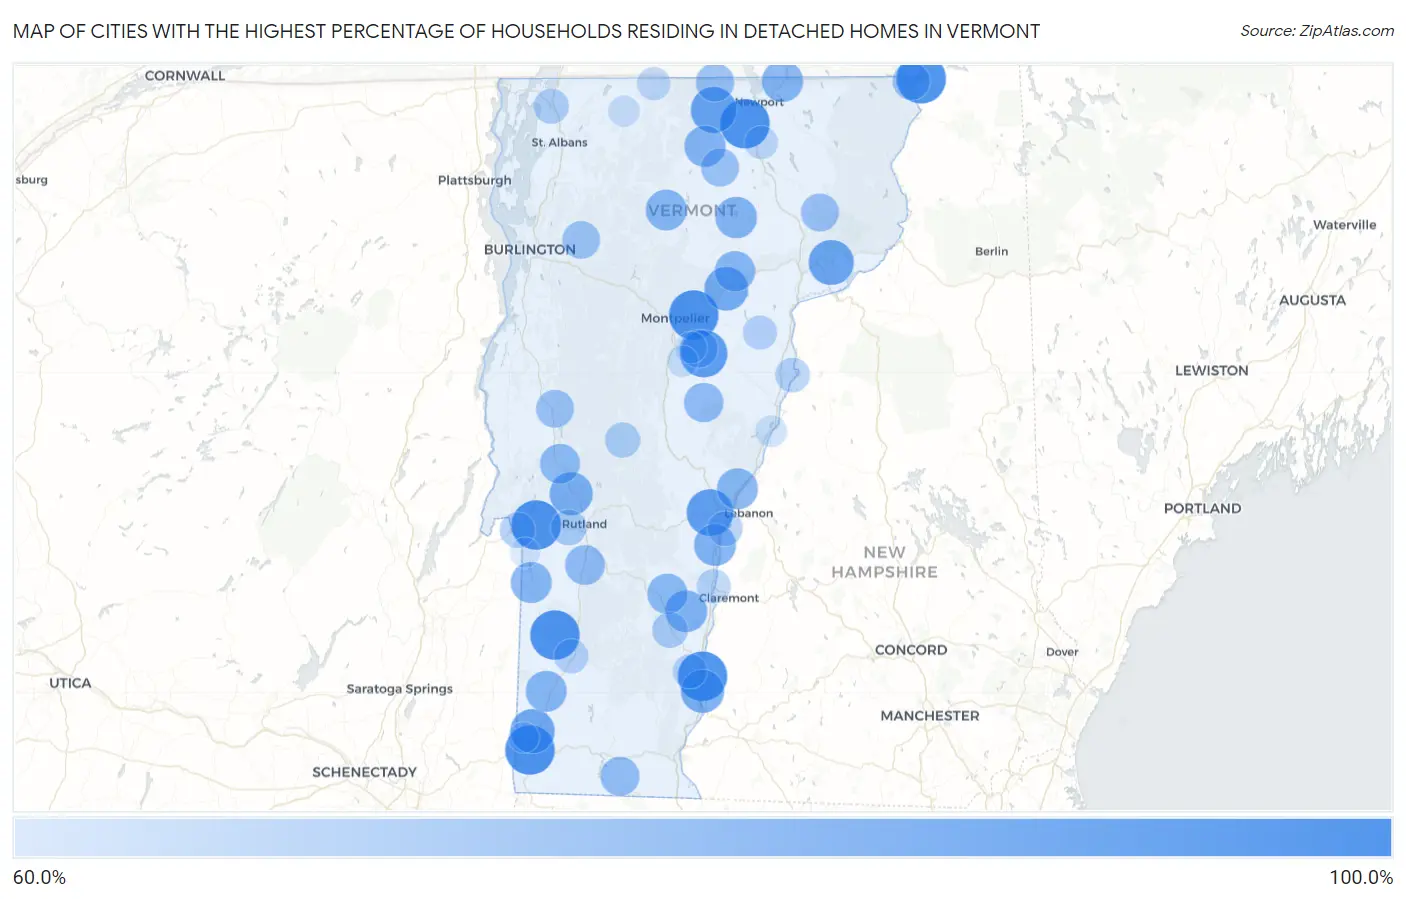
Map of Cities with the Highest Percentage of Households Residing in Detached Homes in Vermont
0.0%
100.0%
Cities with the Highest Percentage of Households Residing in Detached Homes in Vermont
| City | Detached Home Residency | vs State | vs National | |
| 1. | Castleton | 100.0% | 66.8%(+33.2)#1 | 62.5%(+37.5)#253 |
| 2. | Dorset | 100.0% | 66.8%(+33.2)#2 | 62.5%(+37.5)#647 |
| 3. | Lyndon Center | 100.0% | 66.8%(+33.2)#3 | 62.5%(+37.5)#797 |
| 4. | Highgate Center | 100.0% | 66.8%(+33.2)#4 | 62.5%(+37.5)#891 |
| 5. | West Charlotte | 100.0% | 66.8%(+33.2)#5 | 62.5%(+37.5)#1,024 |
| 6. | Old Bennington | 100.0% | 66.8%(+33.2)#6 | 62.5%(+37.5)#1,298 |
| 7. | Sutton | 100.0% | 66.8%(+33.2)#7 | 62.5%(+37.5)#1,349 |
| 8. | North Westminster | 100.0% | 66.8%(+33.2)#8 | 62.5%(+37.5)#1,484 |
| 9. | Beecher Falls | 100.0% | 66.8%(+33.2)#9 | 62.5%(+37.5)#1,749 |
| 10. | Jamaica | 100.0% | 66.8%(+33.2)#10 | 62.5%(+37.5)#2,068 |
| 11. | East Montpelier | 100.0% | 66.8%(+33.2)#11 | 62.5%(+37.5)#2,124 |
| 12. | Underhill Center | 100.0% | 66.8%(+33.2)#12 | 62.5%(+37.5)#2,229 |
| 13. | Weston | 100.0% | 66.8%(+33.2)#13 | 62.5%(+37.5)#2,460 |
| 14. | Chimney Hill | 100.0% | 66.8%(+33.2)#14 | 62.5%(+37.5)#2,498 |
| 15. | Bolton | 100.0% | 66.8%(+33.2)#15 | 62.5%(+37.5)#2,501 |
| 16. | South Woodstock | 100.0% | 66.8%(+33.2)#16 | 62.5%(+37.5)#2,702 |
| 17. | Coventry | 100.0% | 66.8%(+33.2)#17 | 62.5%(+37.5)#2,902 |
| 18. | North Hyde Park | 96.0% | 66.8%(+29.2)#18 | 62.5%(+33.5)#4,638 |
| 19. | East Barre | 95.4% | 66.8%(+28.6)#19 | 62.5%(+32.9)#4,950 |
| 20. | Bakersfield | 95.0% | 66.8%(+28.2)#20 | 62.5%(+32.5)#5,164 |
| 21. | West Pawlet | 94.4% | 66.8%(+27.6)#21 | 62.5%(+31.9)#5,429 |
| 22. | Quechee | 94.1% | 66.8%(+27.3)#22 | 62.5%(+31.6)#5,604 |
| 23. | East Poultney | 93.4% | 66.8%(+26.6)#23 | 62.5%(+30.9)#6,000 |
| 24. | Pawlet | 93.3% | 66.8%(+26.5)#24 | 62.5%(+30.8)#6,033 |
| 25. | Stratton Mountain | 93.1% | 66.8%(+26.3)#25 | 62.5%(+30.6)#6,151 |
| 26. | East Dorset | 93.0% | 66.8%(+26.2)#26 | 62.5%(+30.5)#6,185 |
| 27. | Westford | 92.6% | 66.8%(+25.8)#27 | 62.5%(+30.1)#6,393 |
| 28. | Troy | 92.6% | 66.8%(+25.8)#28 | 62.5%(+30.1)#6,397 |
| 29. | Stamford | 92.5% | 66.8%(+25.7)#29 | 62.5%(+30.0)#6,441 |
| 30. | North Pownal | 91.5% | 66.8%(+24.7)#30 | 62.5%(+29.0)#7,040 |
| 31. | Concord | 91.0% | 66.8%(+24.2)#31 | 62.5%(+28.5)#7,367 |
| 32. | South Lincoln | 90.8% | 66.8%(+24.0)#32 | 62.5%(+28.3)#7,480 |
| 33. | South Shaftsbury | 89.6% | 66.8%(+22.8)#33 | 62.5%(+27.1)#8,159 |
| 34. | Wardsboro | 88.2% | 66.8%(+21.4)#34 | 62.5%(+25.7)#9,042 |
| 35. | Marshfield | 88.1% | 66.8%(+21.3)#35 | 62.5%(+25.6)#9,083 |
| 36. | Harmonyville | 87.5% | 66.8%(+20.7)#36 | 62.5%(+25.0)#9,453 |
| 37. | Westminster | 87.3% | 66.8%(+20.5)#37 | 62.5%(+24.8)#9,585 |
| 38. | Gilman | 87.0% | 66.8%(+20.2)#38 | 62.5%(+24.5)#9,750 |
| 39. | Pittsford | 86.8% | 66.8%(+20.0)#39 | 62.5%(+24.3)#9,851 |
| 40. | Chittenden | 86.8% | 66.8%(+20.0)#40 | 62.5%(+24.3)#9,874 |
| 41. | Hartland | 84.5% | 66.8%(+17.7)#41 | 62.5%(+22.0)#11,306 |
| 42. | North Springfield | 84.5% | 66.8%(+17.7)#42 | 62.5%(+22.0)#11,311 |
| 43. | Greensboro | 83.9% | 66.8%(+17.1)#43 | 62.5%(+21.4)#11,731 |
| 44. | Derby Line | 83.5% | 66.8%(+16.7)#44 | 62.5%(+21.0)#11,941 |
| 45. | Huntington | 83.5% | 66.8%(+16.7)#45 | 62.5%(+21.0)#11,947 |
| 46. | Hanksville | 83.3% | 66.8%(+16.5)#46 | 62.5%(+20.8)#12,084 |
| 47. | Lowell | 83.1% | 66.8%(+16.3)#47 | 62.5%(+20.6)#12,210 |
| 48. | Grafton | 82.9% | 66.8%(+16.1)#48 | 62.5%(+20.4)#12,352 |
| 49. | Wells | 82.8% | 66.8%(+16.0)#49 | 62.5%(+20.3)#12,399 |
| 50. | Norwich | 82.7% | 66.8%(+15.9)#50 | 62.5%(+20.2)#12,443 |
| 51. | Arlington | 82.5% | 66.8%(+15.7)#51 | 62.5%(+20.0)#12,580 |
| 52. | Hyde Park | 82.5% | 66.8%(+15.7)#52 | 62.5%(+20.0)#12,609 |
| 53. | Cabot | 81.7% | 66.8%(+14.9)#53 | 62.5%(+19.2)#13,114 |
| 54. | Cavendish | 81.5% | 66.8%(+14.7)#54 | 62.5%(+19.0)#13,238 |
| 55. | South Hero | 81.5% | 66.8%(+14.7)#55 | 62.5%(+19.0)#13,242 |
| 56. | Middletown Springs | 81.3% | 66.8%(+14.5)#56 | 62.5%(+18.8)#13,336 |
| 57. | Brandon | 80.7% | 66.8%(+13.9)#57 | 62.5%(+18.2)#13,675 |
| 58. | Wallingford | 80.3% | 66.8%(+13.5)#58 | 62.5%(+17.8)#13,931 |
| 59. | Chelsea | 79.7% | 66.8%(+12.9)#59 | 62.5%(+17.2)#14,336 |
| 60. | Sheffield | 79.2% | 66.8%(+12.4)#60 | 62.5%(+16.7)#14,651 |
| 61. | Jacksonville | 78.9% | 66.8%(+12.1)#61 | 62.5%(+16.4)#14,844 |
| 62. | Peacham | 78.8% | 66.8%(+12.0)#62 | 62.5%(+16.3)#14,907 |
| 63. | North Troy | 77.6% | 66.8%(+10.8)#63 | 62.5%(+15.1)#15,669 |
| 64. | Lunenburg | 77.2% | 66.8%(+10.4)#64 | 62.5%(+14.7)#15,931 |
| 65. | Albany | 76.9% | 66.8%(+10.1)#65 | 62.5%(+14.4)#16,105 |
| 66. | East Burke | 76.8% | 66.8%(+10.0)#66 | 62.5%(+14.3)#16,188 |
| 67. | Websterville | 76.7% | 66.8%(+9.90)#67 | 62.5%(+14.2)#16,251 |
| 68. | East Middlebury | 76.6% | 66.8%(+9.80)#68 | 62.5%(+14.1)#16,311 |
| 69. | Danby | 76.6% | 66.8%(+9.80)#69 | 62.5%(+14.1)#16,323 |
| 70. | West Dummerston | 76.5% | 66.8%(+9.70)#70 | 62.5%(+14.0)#16,393 |
| 71. | Jericho | 76.2% | 66.8%(+9.40)#71 | 62.5%(+13.7)#16,553 |
| 72. | Canaan | 75.9% | 66.8%(+9.10)#72 | 62.5%(+13.4)#16,759 |
| 73. | Waterbury Center | 75.6% | 66.8%(+8.80)#73 | 62.5%(+13.1)#16,943 |
| 74. | Proctor | 74.7% | 66.8%(+7.90)#74 | 62.5%(+12.2)#17,490 |
| 75. | New Haven | 74.7% | 66.8%(+7.90)#75 | 62.5%(+12.2)#17,520 |
| 76. | West Rutland | 72.2% | 66.8%(+5.40)#76 | 62.5%(+9.70)#19,012 |
| 77. | Chester | 72.1% | 66.8%(+5.30)#77 | 62.5%(+9.60)#19,087 |
| 78. | Lincoln | 72.0% | 66.8%(+5.20)#78 | 62.5%(+9.50)#19,168 |
| 79. | Fair Haven | 71.5% | 66.8%(+4.70)#79 | 62.5%(+9.00)#19,415 |
| 80. | Rochester | 71.3% | 66.8%(+4.50)#80 | 62.5%(+8.80)#19,570 |
| 81. | Swanton | 71.0% | 66.8%(+4.20)#81 | 62.5%(+8.50)#19,737 |
| 82. | North Hartland | 70.5% | 66.8%(+3.70)#82 | 62.5%(+8.00)#20,058 |
| 83. | Newbury | 70.0% | 66.8%(+3.20)#83 | 62.5%(+7.50)#20,313 |
| 84. | Pownal Center | 69.8% | 66.8%(+3.00)#84 | 62.5%(+7.30)#20,438 |
| 85. | Saxtons River | 69.6% | 66.8%(+2.80)#85 | 62.5%(+7.10)#20,534 |
| 86. | Manchester Center | 69.4% | 66.8%(+2.60)#86 | 62.5%(+6.90)#20,648 |
| 87. | Groton | 69.1% | 66.8%(+2.30)#87 | 62.5%(+6.60)#20,809 |
| 88. | Ascutney | 68.9% | 66.8%(+2.10)#88 | 62.5%(+6.40)#20,941 |
| 89. | Wolcott | 68.1% | 66.8%(+1.30)#89 | 62.5%(+5.60)#21,396 |
| 90. | Richford | 67.5% | 66.8%(+0.700)#90 | 62.5%(+5.00)#21,704 |
| 91. | Orleans | 67.5% | 66.8%(+0.700)#91 | 62.5%(+5.00)#21,710 |
| 92. | Underhill Flats | 66.6% | 66.8%(-0.200)#92 | 62.5%(+4.10)#22,223 |
| 93. | Whitingham | 65.8% | 66.8%(-1.00)#93 | 62.5%(+3.30)#22,610 |
| 94. | South Barre | 64.3% | 66.8%(-2.50)#94 | 62.5%(+1.80)#23,292 |
| 95. | Fairlee | 64.0% | 66.8%(-2.80)#95 | 62.5%(+1.50)#23,455 |
| 96. | Enosburg Falls | 63.9% | 66.8%(-2.90)#96 | 62.5%(+1.40)#23,480 |
| 97. | Williamstown | 63.7% | 66.8%(-3.10)#97 | 62.5%(+1.20)#23,586 |
| 98. | Castleton Four Corners | 63.7% | 66.8%(-3.10)#98 | 62.5%(+1.20)#23,591 |
| 99. | North Bennington | 62.2% | 66.8%(-4.60)#99 | 62.5%(-0.300)#24,259 |
| 100. | Poultney | 61.4% | 66.8%(-5.40)#100 | 62.5%(-1.10)#24,580 |
1
2Common Questions
What are the Top 10 Cities with the Highest Percentage of Households Residing in Detached Homes in Vermont?
Top 10 Cities with the Highest Percentage of Households Residing in Detached Homes in Vermont are:
#1
100.0%
#2
100.0%
#3
100.0%
#4
100.0%
#5
100.0%
#6
100.0%
#7
100.0%
#8
95.4%
#9
94.1%
#10
92.6%
What city has the Highest Percentage of Households Residing in Detached Homes in Vermont?
Castleton has the Highest Percentage of Households Residing in Detached Homes in Vermont with 100.0%.
What is the Percentage of Households Residing in Detached Homes in the State of Vermont?
Percentage of Households Residing in Detached Homes in Vermont is 66.8%.
What is the Percentage of Households Residing in Detached Homes in the United States?
Percentage of Households Residing in Detached Homes in the United States is 62.5%.