Cities with the Highest Percentage of Households Residing in Detached Homes in New Hampshire
RELATED REPORTS & OPTIONS
Detached Home Residency
New Hampshire
Compare Cities
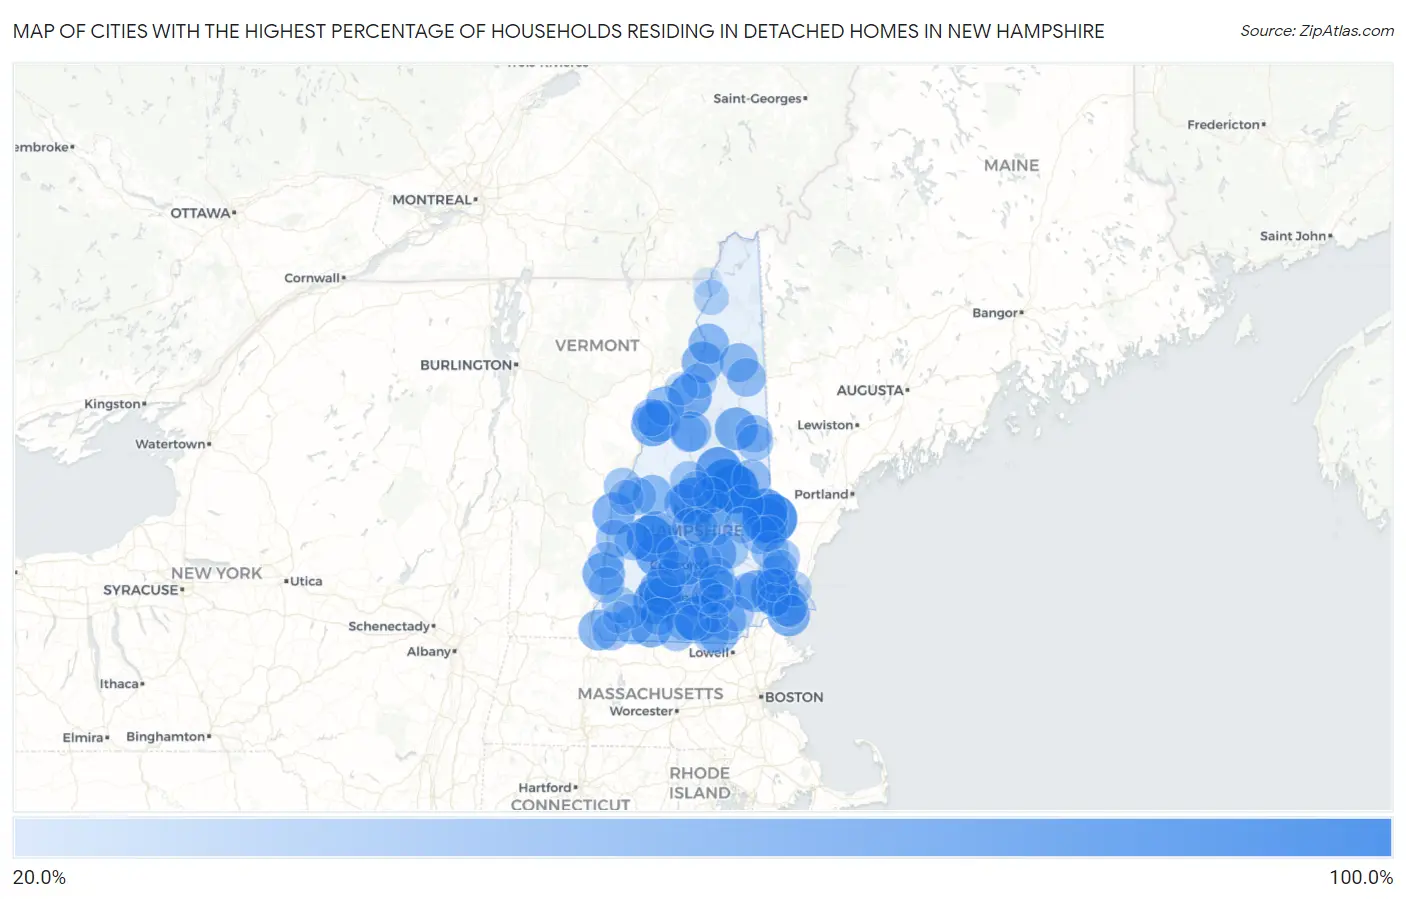
Map of Cities with the Highest Percentage of Households Residing in Detached Homes in New Hampshire
0.0%
100.0%
Cities with the Highest Percentage of Households Residing in Detached Homes in New Hampshire
| City | Detached Home Residency | vs State | vs National | |
| 1. | Suissevale | 100.0% | 63.1%(+36.9)#1 | 62.5%(+37.5)#599 |
| 2. | Francestown | 100.0% | 63.1%(+36.9)#2 | 62.5%(+37.5)#1,508 |
| 3. | Milton Mills | 100.0% | 63.1%(+36.9)#3 | 62.5%(+37.5)#1,573 |
| 4. | Melvin Village | 100.0% | 63.1%(+36.9)#4 | 62.5%(+37.5)#1,685 |
| 5. | Newfields | 92.5% | 63.1%(+29.4)#5 | 62.5%(+30.0)#6,450 |
| 6. | New Hampton | 91.4% | 63.1%(+28.3)#6 | 62.5%(+28.9)#7,099 |
| 7. | Blodgett Landing | 88.1% | 63.1%(+25.0)#7 | 62.5%(+25.6)#9,098 |
| 8. | Center Sandwich | 85.3% | 63.1%(+22.2)#8 | 62.5%(+22.8)#10,815 |
| 9. | Union | 85.1% | 63.1%(+22.0)#9 | 62.5%(+22.6)#10,935 |
| 10. | Hancock | 84.7% | 63.1%(+21.6)#10 | 62.5%(+22.2)#11,201 |
| 11. | Goffstown | 84.6% | 63.1%(+21.5)#11 | 62.5%(+22.1)#11,221 |
| 12. | Amherst | 83.4% | 63.1%(+20.3)#12 | 62.5%(+20.9)#11,992 |
| 13. | Sanbornville | 83.1% | 63.1%(+20.0)#13 | 62.5%(+20.6)#12,184 |
| 14. | Contoocook | 82.0% | 63.1%(+18.9)#14 | 62.5%(+19.5)#12,904 |
| 15. | New Boston | 78.1% | 63.1%(+15.0)#15 | 62.5%(+15.6)#15,338 |
| 16. | Bethlehem | 75.8% | 63.1%(+12.7)#16 | 62.5%(+13.3)#16,805 |
| 17. | Klondike Corner | 75.3% | 63.1%(+12.2)#17 | 62.5%(+12.8)#17,116 |
| 18. | Bradford | 75.3% | 63.1%(+12.2)#18 | 62.5%(+12.8)#17,123 |
| 19. | Antrim | 73.2% | 63.1%(+10.1)#19 | 62.5%(+10.7)#18,417 |
| 20. | North Haverhill | 72.0% | 63.1%(+8.90)#20 | 62.5%(+9.50)#19,155 |
| 21. | Bartlett | 71.7% | 63.1%(+8.60)#21 | 62.5%(+9.20)#19,323 |
| 22. | New London | 71.4% | 63.1%(+8.30)#22 | 62.5%(+8.90)#19,472 |
| 23. | Loudon | 71.4% | 63.1%(+8.30)#23 | 62.5%(+8.90)#19,482 |
| 24. | North Walpole | 71.2% | 63.1%(+8.10)#24 | 62.5%(+8.70)#19,613 |
| 25. | Plainfield | 71.1% | 63.1%(+8.00)#25 | 62.5%(+8.60)#19,698 |
| 26. | South Hooksett | 71.0% | 63.1%(+7.90)#26 | 62.5%(+8.50)#19,721 |
| 27. | Seabrook Beach | 70.7% | 63.1%(+7.60)#27 | 62.5%(+8.20)#19,932 |
| 28. | Jaffrey | 69.7% | 63.1%(+6.60)#28 | 62.5%(+7.20)#20,473 |
| 29. | Epping | 69.0% | 63.1%(+5.90)#29 | 62.5%(+6.50)#20,853 |
| 30. | Mountain Lakes | 68.6% | 63.1%(+5.50)#30 | 62.5%(+6.10)#21,105 |
| 31. | Lancaster | 67.3% | 63.1%(+4.20)#31 | 62.5%(+4.80)#21,816 |
| 32. | Hinsdale | 64.4% | 63.1%(+1.30)#32 | 62.5%(+1.90)#23,242 |
| 33. | Hampton | 63.3% | 63.1%(+0.200)#33 | 62.5%(+0.800)#23,740 |
| 34. | Groveton | 61.9% | 63.1%(-1.20)#34 | 62.5%(-0.600)#24,379 |
| 35. | Wolfeboro | 61.8% | 63.1%(-1.30)#35 | 62.5%(-0.700)#24,412 |
| 36. | Bennington | 61.2% | 63.1%(-1.90)#36 | 62.5%(-1.30)#24,667 |
| 37. | Canaan | 61.0% | 63.1%(-2.10)#37 | 62.5%(-1.50)#24,749 |
| 38. | Londonderry | 60.6% | 63.1%(-2.50)#38 | 62.5%(-1.90)#24,885 |
| 39. | Lincoln | 60.6% | 63.1%(-2.50)#39 | 62.5%(-1.90)#24,906 |
| 40. | Bristol | 60.5% | 63.1%(-2.60)#40 | 62.5%(-2.00)#24,946 |
| 41. | Hudson | 58.3% | 63.1%(-4.80)#41 | 62.5%(-4.20)#25,717 |
| 42. | Franklin | 57.3% | 63.1%(-5.80)#42 | 62.5%(-5.20)#26,081 |
| 43. | Hillsborough | 57.0% | 63.1%(-6.10)#43 | 62.5%(-5.50)#26,200 |
| 44. | Lisbon | 56.9% | 63.1%(-6.20)#44 | 62.5%(-5.60)#26,235 |
| 45. | Troy | 56.5% | 63.1%(-6.60)#45 | 62.5%(-6.00)#26,355 |
| 46. | Center Ossipee | 56.1% | 63.1%(-7.00)#46 | 62.5%(-6.40)#26,477 |
| 47. | Berlin | 55.9% | 63.1%(-7.20)#47 | 62.5%(-6.60)#26,526 |
| 48. | Wilton | 55.5% | 63.1%(-7.60)#48 | 62.5%(-7.00)#26,644 |
| 49. | Gorham | 55.2% | 63.1%(-7.90)#49 | 62.5%(-7.30)#26,720 |
| 50. | Farmington | 53.6% | 63.1%(-9.50)#50 | 62.5%(-8.90)#27,134 |
| 51. | Newport | 53.4% | 63.1%(-9.70)#51 | 62.5%(-9.10)#27,172 |
| 52. | Claremont | 53.0% | 63.1%(-10.1)#52 | 62.5%(-9.50)#27,287 |
| 53. | Winchester | 52.8% | 63.1%(-10.3)#53 | 62.5%(-9.70)#27,347 |
| 54. | Durham | 52.2% | 63.1%(-10.9)#54 | 62.5%(-10.3)#27,490 |
| 55. | Rochester | 51.1% | 63.1%(-12.0)#55 | 62.5%(-11.4)#27,735 |
| 56. | Laconia | 51.1% | 63.1%(-12.0)#56 | 62.5%(-11.4)#27,739 |
| 57. | Enfield | 50.8% | 63.1%(-12.3)#57 | 62.5%(-11.7)#27,811 |
| 58. | Peterborough | 50.7% | 63.1%(-12.4)#58 | 62.5%(-11.8)#27,822 |
| 59. | Belmont | 50.6% | 63.1%(-12.5)#59 | 62.5%(-11.9)#27,857 |
| 60. | Plymouth | 50.5% | 63.1%(-12.6)#60 | 62.5%(-12.0)#27,873 |
| 61. | North Conway | 50.4% | 63.1%(-12.7)#61 | 62.5%(-12.1)#27,898 |
| 62. | Woodsville | 50.4% | 63.1%(-12.7)#62 | 62.5%(-12.1)#27,900 |
| 63. | Somersworth | 49.6% | 63.1%(-13.5)#63 | 62.5%(-12.9)#28,085 |
| 64. | Hanover | 49.6% | 63.1%(-13.5)#64 | 62.5%(-12.9)#28,087 |
| 65. | Greenville | 49.3% | 63.1%(-13.8)#65 | 62.5%(-13.2)#28,141 |
| 66. | North Woodstock | 48.8% | 63.1%(-14.3)#66 | 62.5%(-13.7)#28,240 |
| 67. | Milton | 47.8% | 63.1%(-15.3)#67 | 62.5%(-14.7)#28,420 |
| 68. | Conway | 47.6% | 63.1%(-15.5)#68 | 62.5%(-14.9)#28,449 |
| 69. | Raymond | 47.2% | 63.1%(-15.9)#69 | 62.5%(-15.3)#28,513 |
| 70. | Alton | 46.5% | 63.1%(-16.6)#70 | 62.5%(-16.0)#28,644 |
| 71. | Keene | 46.4% | 63.1%(-16.7)#71 | 62.5%(-16.1)#28,649 |
| 72. | Meredith | 46.2% | 63.1%(-16.9)#72 | 62.5%(-16.3)#28,689 |
| 73. | Tilton Northfield | 45.9% | 63.1%(-17.2)#73 | 62.5%(-16.6)#28,750 |
| 74. | Pittsfield | 45.9% | 63.1%(-17.2)#74 | 62.5%(-16.6)#28,752 |
| 75. | Charlestown | 45.8% | 63.1%(-17.3)#75 | 62.5%(-16.7)#28,774 |
| 76. | Nashua | 45.7% | 63.1%(-17.4)#76 | 62.5%(-16.8)#28,787 |
| 77. | Suncook | 45.5% | 63.1%(-17.6)#77 | 62.5%(-17.0)#28,822 |
| 78. | Walpole | 45.2% | 63.1%(-17.9)#78 | 62.5%(-17.3)#28,881 |
| 79. | Concord | 43.3% | 63.1%(-19.8)#79 | 62.5%(-19.2)#29,129 |
| 80. | Whitefield | 43.3% | 63.1%(-19.8)#80 | 62.5%(-19.2)#29,140 |
| 81. | Milford | 43.2% | 63.1%(-19.9)#81 | 62.5%(-19.3)#29,153 |
| 82. | Portsmouth | 43.0% | 63.1%(-20.1)#82 | 62.5%(-19.5)#29,170 |
| 83. | Dover | 42.9% | 63.1%(-20.2)#83 | 62.5%(-19.6)#29,188 |
| 84. | Derry | 42.3% | 63.1%(-20.8)#84 | 62.5%(-20.2)#29,261 |
| 85. | Ashland | 42.3% | 63.1%(-20.8)#85 | 62.5%(-20.2)#29,266 |
| 86. | Lebanon | 41.9% | 63.1%(-21.2)#86 | 62.5%(-20.6)#29,316 |
| 87. | Marlborough | 40.6% | 63.1%(-22.5)#87 | 62.5%(-21.9)#29,473 |
| 88. | Colebrook | 40.5% | 63.1%(-22.6)#88 | 62.5%(-22.0)#29,486 |
| 89. | Pinardville | 40.0% | 63.1%(-23.1)#89 | 62.5%(-22.5)#29,536 |
| 90. | Henniker | 39.6% | 63.1%(-23.5)#90 | 62.5%(-22.9)#29,587 |
| 91. | Hooksett | 38.0% | 63.1%(-25.1)#91 | 62.5%(-24.5)#29,756 |
| 92. | Manchester | 37.8% | 63.1%(-25.3)#92 | 62.5%(-24.7)#29,774 |
| 93. | Littleton | 35.3% | 63.1%(-27.8)#93 | 62.5%(-27.2)#30,020 |
| 94. | Exeter | 34.6% | 63.1%(-28.5)#94 | 62.5%(-27.9)#30,076 |
| 95. | Warner | 33.2% | 63.1%(-29.9)#95 | 62.5%(-29.3)#30,203 |
| 96. | Newmarket | 32.6% | 63.1%(-30.5)#96 | 62.5%(-29.9)#30,238 |
| 97. | Hampton Beach | 31.6% | 63.1%(-31.5)#97 | 62.5%(-30.9)#30,296 |
| 98. | West Swanzey | 29.7% | 63.1%(-33.4)#98 | 62.5%(-32.8)#30,412 |
| 99. | West Stewartstown | 21.2% | 63.1%(-41.9)#99 | 62.5%(-41.3)#30,838 |
| 100. | East Merrimack | 20.9% | 63.1%(-42.2)#100 | 62.5%(-41.6)#30,856 |
1
Common Questions
What are the Top 10 Cities with the Highest Percentage of Households Residing in Detached Homes in New Hampshire?
Top 10 Cities with the Highest Percentage of Households Residing in Detached Homes in New Hampshire are:
#1
100.0%
#2
100.0%
#3
100.0%
#4
92.5%
#5
91.4%
#6
88.1%
#7
85.3%
#8
85.1%
#9
84.7%
#10
84.6%
What city has the Highest Percentage of Households Residing in Detached Homes in New Hampshire?
Suissevale has the Highest Percentage of Households Residing in Detached Homes in New Hampshire with 100.0%.
What is the Percentage of Households Residing in Detached Homes in the State of New Hampshire?
Percentage of Households Residing in Detached Homes in New Hampshire is 63.1%.
What is the Percentage of Households Residing in Detached Homes in the United States?
Percentage of Households Residing in Detached Homes in the United States is 62.5%.