Cities with the Highest Percentage of Households Residing in Detached Homes in Massachusetts
RELATED REPORTS & OPTIONS
Detached Home Residency
Massachusetts
Compare Cities
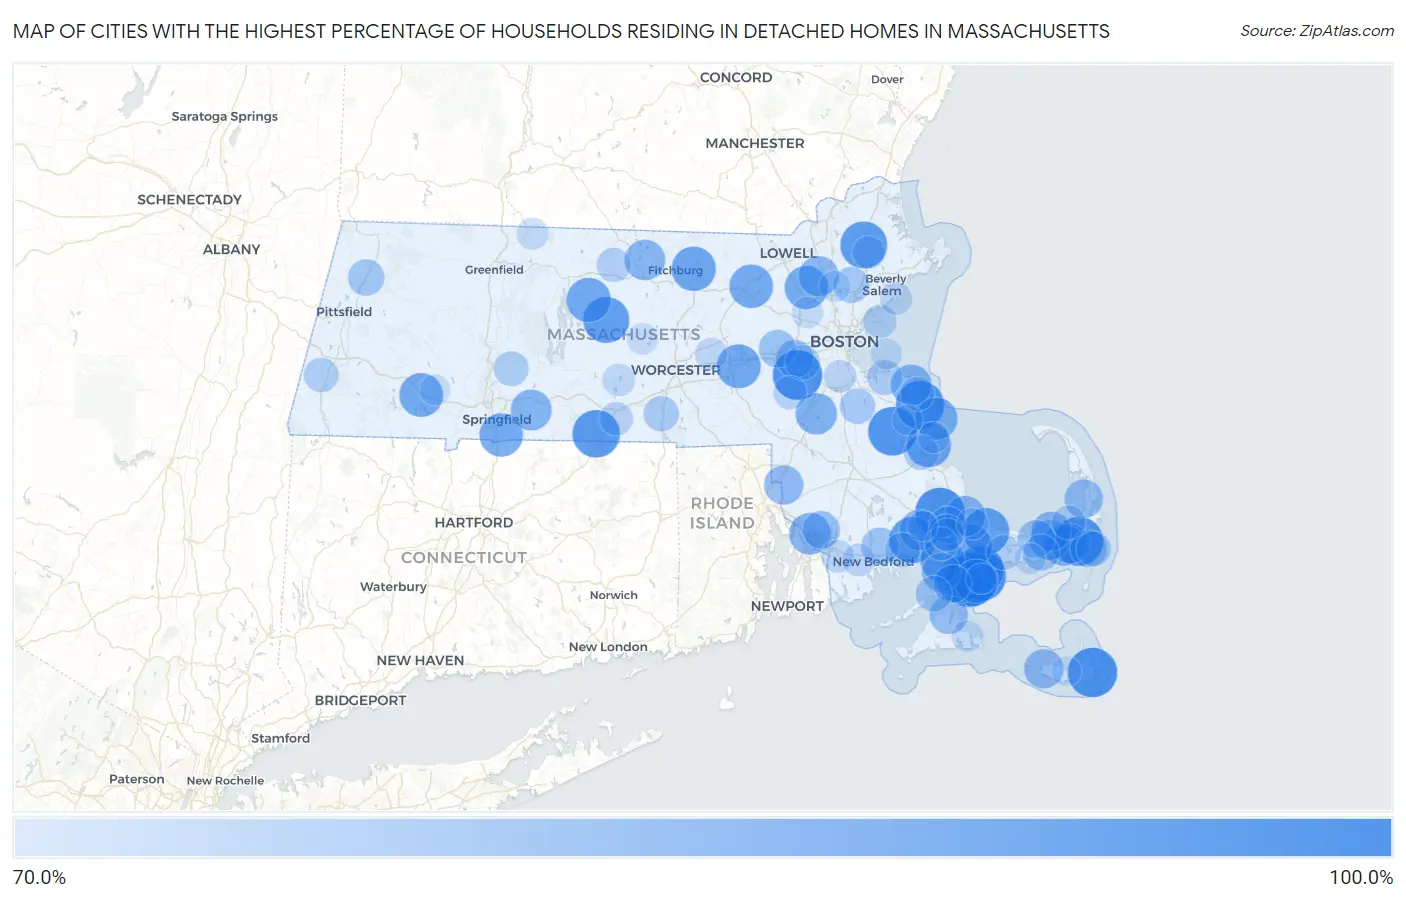
Map of Cities with the Highest Percentage of Households Residing in Detached Homes in Massachusetts
0.0%
100.0%
Cities with the Highest Percentage of Households Residing in Detached Homes in Massachusetts
| City | Detached Home Residency | vs State | vs National | |
| 1. | Dover | 100.0% | 51.3%(+48.7)#1 | 62.5%(+37.5)#54 |
| 2. | Cedar Crest | 100.0% | 51.3%(+48.7)#2 | 62.5%(+37.5)#56 |
| 3. | White Island Shores | 100.0% | 51.3%(+48.7)#3 | 62.5%(+37.5)#69 |
| 4. | Green Harbor | 100.0% | 51.3%(+48.7)#4 | 62.5%(+37.5)#182 |
| 5. | Seabrook | 100.0% | 51.3%(+48.7)#5 | 62.5%(+37.5)#406 |
| 6. | Seconsett Island | 100.0% | 51.3%(+48.7)#6 | 62.5%(+37.5)#1,455 |
| 7. | Monomoscoy Island | 100.0% | 51.3%(+48.7)#7 | 62.5%(+37.5)#1,553 |
| 8. | Siasconset | 100.0% | 51.3%(+48.7)#8 | 62.5%(+37.5)#1,625 |
| 9. | Popponesset Island | 100.0% | 51.3%(+48.7)#9 | 62.5%(+37.5)#2,054 |
| 10. | East Harwich | 99.3% | 51.3%(+48.0)#10 | 62.5%(+36.8)#3,199 |
| 11. | Hanson | 98.7% | 51.3%(+47.4)#11 | 62.5%(+36.2)#3,391 |
| 12. | Marshfield Hills | 98.2% | 51.3%(+46.9)#12 | 62.5%(+35.7)#3,592 |
| 13. | Mashpee Neck | 97.5% | 51.3%(+46.2)#13 | 62.5%(+35.0)#3,887 |
| 14. | Holland | 97.0% | 51.3%(+45.7)#14 | 62.5%(+34.5)#4,115 |
| 15. | Boxford | 96.1% | 51.3%(+44.8)#15 | 62.5%(+33.6)#4,581 |
| 16. | Marion Center | 95.7% | 51.3%(+44.4)#16 | 62.5%(+33.2)#4,778 |
| 17. | East Sandwich | 95.1% | 51.3%(+43.8)#17 | 62.5%(+32.6)#5,099 |
| 18. | East Falmouth | 95.0% | 51.3%(+43.7)#18 | 62.5%(+32.5)#5,140 |
| 19. | Barre | 95.0% | 51.3%(+43.7)#19 | 62.5%(+32.5)#5,159 |
| 20. | South Duxbury | 92.6% | 51.3%(+41.3)#20 | 62.5%(+30.1)#6,368 |
| 21. | Forestdale | 92.4% | 51.3%(+41.1)#21 | 62.5%(+29.9)#6,472 |
| 22. | Lunenburg | 92.4% | 51.3%(+41.1)#22 | 62.5%(+29.9)#6,480 |
| 23. | North Falmouth | 92.0% | 51.3%(+40.7)#23 | 62.5%(+29.5)#6,725 |
| 24. | Petersham | 92.0% | 51.3%(+40.7)#24 | 62.5%(+29.5)#6,765 |
| 25. | Cordaville | 91.7% | 51.3%(+40.4)#25 | 62.5%(+29.2)#6,890 |
| 26. | New Seabury | 91.4% | 51.3%(+40.1)#26 | 62.5%(+28.9)#7,079 |
| 27. | Blandford | 91.3% | 51.3%(+40.0)#27 | 62.5%(+28.8)#7,165 |
| 28. | Littleton Common | 91.1% | 51.3%(+39.8)#28 | 62.5%(+28.6)#7,248 |
| 29. | Longmeadow | 90.9% | 51.3%(+39.6)#29 | 62.5%(+28.4)#7,372 |
| 30. | Pinehurst | 90.7% | 51.3%(+39.4)#30 | 62.5%(+28.2)#7,489 |
| 31. | Ocean Bluff Brant Rock | 89.5% | 51.3%(+38.2)#31 | 62.5%(+27.0)#8,186 |
| 32. | Ocean Grove | 88.3% | 51.3%(+37.0)#32 | 62.5%(+25.8)#8,934 |
| 33. | Northwest Harwich | 88.0% | 51.3%(+36.7)#33 | 62.5%(+25.5)#9,113 |
| 34. | Sharon | 87.9% | 51.3%(+36.6)#34 | 62.5%(+25.4)#9,179 |
| 35. | North Scituate | 87.3% | 51.3%(+36.0)#35 | 62.5%(+24.8)#9,562 |
| 36. | Wilbraham | 87.2% | 51.3%(+35.9)#36 | 62.5%(+24.7)#9,612 |
| 37. | Weweantic | 87.0% | 51.3%(+35.7)#37 | 62.5%(+24.5)#9,724 |
| 38. | Sagamore | 86.8% | 51.3%(+35.5)#38 | 62.5%(+24.3)#9,831 |
| 39. | South Ashburnham | 86.7% | 51.3%(+35.4)#39 | 62.5%(+24.2)#9,906 |
| 40. | Wilmington | 86.3% | 51.3%(+35.0)#40 | 62.5%(+23.8)#10,134 |
| 41. | South Dennis | 85.5% | 51.3%(+34.2)#41 | 62.5%(+23.0)#10,661 |
| 42. | Harwich Center | 85.3% | 51.3%(+34.0)#42 | 62.5%(+22.8)#10,784 |
| 43. | East Dennis | 85.1% | 51.3%(+33.8)#43 | 62.5%(+22.6)#10,892 |
| 44. | Madaket | 84.9% | 51.3%(+33.6)#44 | 62.5%(+22.4)#11,051 |
| 45. | North Seekonk | 84.7% | 51.3%(+33.4)#45 | 62.5%(+22.2)#11,152 |
| 46. | West Falmouth | 83.9% | 51.3%(+32.6)#46 | 62.5%(+21.4)#11,703 |
| 47. | North Eastham | 83.8% | 51.3%(+32.5)#47 | 62.5%(+21.3)#11,752 |
| 48. | Vineyard Haven | 83.3% | 51.3%(+32.0)#48 | 62.5%(+20.8)#12,015 |
| 49. | Teaticket | 82.8% | 51.3%(+31.5)#49 | 62.5%(+20.3)#12,379 |
| 50. | Wellesley | 82.4% | 51.3%(+31.1)#50 | 62.5%(+19.9)#12,627 |
| 51. | Somerset | 82.2% | 51.3%(+30.9)#51 | 62.5%(+19.7)#12,753 |
| 52. | Cochituate | 82.1% | 51.3%(+30.8)#52 | 62.5%(+19.6)#12,807 |
| 53. | Yarmouth Port | 82.0% | 51.3%(+30.7)#53 | 62.5%(+19.5)#12,885 |
| 54. | Acushnet Center | 82.0% | 51.3%(+30.7)#54 | 62.5%(+19.5)#12,895 |
| 55. | West Chatham | 81.6% | 51.3%(+30.3)#55 | 62.5%(+19.1)#13,153 |
| 56. | Buzzards Bay | 81.5% | 51.3%(+30.2)#56 | 62.5%(+19.0)#13,203 |
| 57. | Cheshire | 80.6% | 51.3%(+29.3)#57 | 62.5%(+18.1)#13,741 |
| 58. | South Yarmouth | 80.3% | 51.3%(+29.0)#58 | 62.5%(+17.8)#13,904 |
| 59. | Bourne | 80.1% | 51.3%(+28.8)#59 | 62.5%(+17.6)#14,036 |
| 60. | Lynnfield | 80.0% | 51.3%(+28.7)#60 | 62.5%(+17.5)#14,059 |
| 61. | Woods Hole | 80.0% | 51.3%(+28.7)#61 | 62.5%(+17.5)#14,094 |
| 62. | Holbrook | 79.0% | 51.3%(+27.7)#62 | 62.5%(+16.5)#14,726 |
| 63. | Oxford | 78.9% | 51.3%(+27.6)#63 | 62.5%(+16.4)#14,800 |
| 64. | Hingham | 78.6% | 51.3%(+27.3)#64 | 62.5%(+16.1)#14,995 |
| 65. | Barnstable Town | 78.3% | 51.3%(+27.0)#65 | 62.5%(+15.8)#15,154 |
| 66. | Mattapoisett Center | 78.3% | 51.3%(+27.0)#66 | 62.5%(+15.8)#15,175 |
| 67. | Granby | 78.3% | 51.3%(+27.0)#67 | 62.5%(+15.8)#15,187 |
| 68. | Kingston | 78.2% | 51.3%(+26.9)#68 | 62.5%(+15.7)#15,227 |
| 69. | Needham | 78.1% | 51.3%(+26.8)#69 | 62.5%(+15.6)#15,278 |
| 70. | Chatham | 78.0% | 51.3%(+26.7)#70 | 62.5%(+15.5)#15,381 |
| 71. | Housatonic | 77.8% | 51.3%(+26.5)#71 | 62.5%(+15.3)#15,529 |
| 72. | Scituate | 77.2% | 51.3%(+25.9)#72 | 62.5%(+14.7)#15,896 |
| 73. | Baldwinville | 77.2% | 51.3%(+25.9)#73 | 62.5%(+14.7)#15,905 |
| 74. | Brewster | 76.9% | 51.3%(+25.6)#74 | 62.5%(+14.4)#16,074 |
| 75. | Sturbridge | 76.3% | 51.3%(+25.0)#75 | 62.5%(+13.8)#16,475 |
| 76. | Medfield | 76.2% | 51.3%(+24.9)#76 | 62.5%(+13.7)#16,530 |
| 77. | Nahant | 76.1% | 51.3%(+24.8)#77 | 62.5%(+13.6)#16,591 |
| 78. | Pocasset | 76.1% | 51.3%(+24.8)#78 | 62.5%(+13.6)#16,597 |
| 79. | Monument Beach | 75.5% | 51.3%(+24.2)#79 | 62.5%(+13.0)#16,972 |
| 80. | North Westport | 75.1% | 51.3%(+23.8)#80 | 62.5%(+12.6)#17,210 |
| 81. | Smith Mills | 75.1% | 51.3%(+23.8)#81 | 62.5%(+12.6)#17,212 |
| 82. | Topsfield | 75.1% | 51.3%(+23.8)#82 | 62.5%(+12.6)#17,215 |
| 83. | Milton | 75.0% | 51.3%(+23.7)#83 | 62.5%(+12.5)#17,247 |
| 84. | East Brookfield | 74.7% | 51.3%(+23.4)#84 | 62.5%(+12.2)#17,494 |
| 85. | Marblehead | 74.5% | 51.3%(+23.2)#85 | 62.5%(+12.0)#17,586 |
| 86. | Northborough | 74.4% | 51.3%(+23.1)#86 | 62.5%(+11.9)#17,667 |
| 87. | Northfield | 74.0% | 51.3%(+22.7)#87 | 62.5%(+11.5)#17,945 |
| 88. | Sandwich | 73.6% | 51.3%(+22.3)#88 | 62.5%(+11.1)#18,154 |
| 89. | Lexington | 73.5% | 51.3%(+22.2)#89 | 62.5%(+11.0)#18,198 |
| 90. | Duxbury | 73.2% | 51.3%(+21.9)#90 | 62.5%(+10.7)#18,412 |
| 91. | Edgartown | 73.2% | 51.3%(+21.9)#91 | 62.5%(+10.7)#18,429 |
| 92. | Reading | 73.1% | 51.3%(+21.8)#92 | 62.5%(+10.6)#18,450 |
| 93. | Rutland | 73.1% | 51.3%(+21.8)#93 | 62.5%(+10.6)#18,476 |
| 94. | West Yarmouth | 73.0% | 51.3%(+21.7)#94 | 62.5%(+10.5)#18,518 |
| 95. | Hull | 72.9% | 51.3%(+21.6)#95 | 62.5%(+10.4)#18,579 |
| 96. | Russell | 72.5% | 51.3%(+21.2)#96 | 62.5%(+10.00)#18,841 |
| 97. | North Pembroke | 72.0% | 51.3%(+20.7)#97 | 62.5%(+9.50)#19,131 |
| 98. | Popponesset | 71.8% | 51.3%(+20.5)#98 | 62.5%(+9.30)#19,266 |
| 99. | Wareham Center | 71.5% | 51.3%(+20.2)#99 | 62.5%(+9.00)#19,412 |
| 100. | Nantucket | 71.4% | 51.3%(+20.1)#100 | 62.5%(+8.90)#19,447 |
Common Questions
What are the Top 10 Cities with the Highest Percentage of Households Residing in Detached Homes in Massachusetts?
Top 10 Cities with the Highest Percentage of Households Residing in Detached Homes in Massachusetts are:
#1
100.0%
#2
100.0%
#3
100.0%
#4
100.0%
#5
100.0%
#6
100.0%
#7
100.0%
#8
99.3%
#9
98.7%
#10
98.2%
What city has the Highest Percentage of Households Residing in Detached Homes in Massachusetts?
Dover has the Highest Percentage of Households Residing in Detached Homes in Massachusetts with 100.0%.
What is the Percentage of Households Residing in Detached Homes in the State of Massachusetts?
Percentage of Households Residing in Detached Homes in Massachusetts is 51.3%.
What is the Percentage of Households Residing in Detached Homes in the United States?
Percentage of Households Residing in Detached Homes in the United States is 62.5%.