Cities with the Highest Percentage of Households Residing in Detached Homes in North Carolina
RELATED REPORTS & OPTIONS
Detached Home Residency
North Carolina
Compare Cities
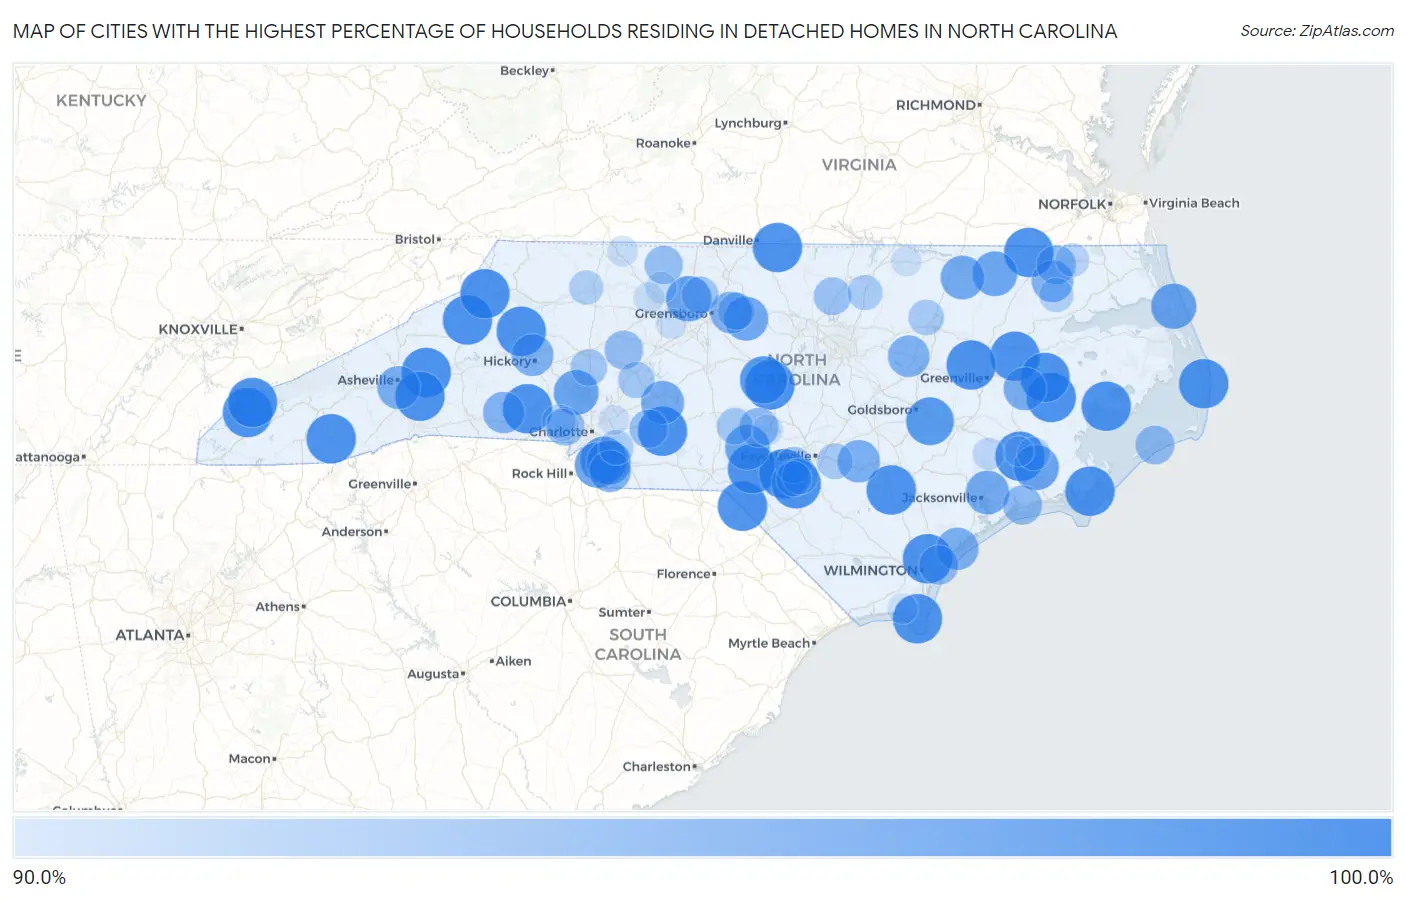
Map of Cities with the Highest Percentage of Households Residing in Detached Homes in North Carolina
0.0%
100.0%
Cities with the Highest Percentage of Households Residing in Detached Homes in North Carolina
| City | Detached Home Residency | vs State | vs National | |
| 1. | Brices Creek | 100.0% | 66.4%(+33.6)#1 | 62.5%(+37.5)#23 |
| 2. | Cypress Landing | 100.0% | 66.4%(+33.6)#2 | 62.5%(+37.5)#206 |
| 3. | Scotch Meadows | 100.0% | 66.4%(+33.6)#3 | 62.5%(+37.5)#371 |
| 4. | Deercroft | 100.0% | 66.4%(+33.6)#4 | 62.5%(+37.5)#549 |
| 5. | Montreat | 100.0% | 66.4%(+33.6)#5 | 62.5%(+37.5)#556 |
| 6. | Aquadale | 100.0% | 66.4%(+33.6)#6 | 62.5%(+37.5)#597 |
| 7. | Cedar Rock | 100.0% | 66.4%(+33.6)#7 | 62.5%(+37.5)#598 |
| 8. | Swan Quarter | 100.0% | 66.4%(+33.6)#8 | 62.5%(+37.5)#801 |
| 9. | Davis | 100.0% | 66.4%(+33.6)#9 | 62.5%(+37.5)#855 |
| 10. | Gerton | 100.0% | 66.4%(+33.6)#10 | 62.5%(+37.5)#928 |
| 11. | Bath | 100.0% | 66.4%(+33.6)#11 | 62.5%(+37.5)#979 |
| 12. | Roberdel | 100.0% | 66.4%(+33.6)#12 | 62.5%(+37.5)#1,111 |
| 13. | Crouse | 100.0% | 66.4%(+33.6)#13 | 62.5%(+37.5)#1,212 |
| 14. | Gulf | 100.0% | 66.4%(+33.6)#14 | 62.5%(+37.5)#1,216 |
| 15. | Milton | 100.0% | 66.4%(+33.6)#15 | 62.5%(+37.5)#1,393 |
| 16. | Crossnore | 100.0% | 66.4%(+33.6)#17 | 62.5%(+37.5)#1,439 |
| 17. | Waves | 100.0% | 66.4%(+33.6)#18 | 62.5%(+37.5)#1,440 |
| 18. | Bald Head Island | 100.0% | 66.4%(+33.6)#19 | 62.5%(+37.5)#1,444 |
| 19. | Valle Crucis | 100.0% | 66.4%(+33.6)#20 | 62.5%(+37.5)#1,450 |
| 20. | Glenville | 100.0% | 66.4%(+33.6)#21 | 62.5%(+37.5)#1,460 |
| 21. | Bear Grass | 100.0% | 66.4%(+33.6)#22 | 62.5%(+37.5)#1,507 |
| 22. | Blue Clay Farms | 100.0% | 66.4%(+33.6)#23 | 62.5%(+37.5)#1,545 |
| 23. | Falkland | 100.0% | 66.4%(+33.6)#24 | 62.5%(+37.5)#1,562 |
| 24. | Lake Santeetlah | 100.0% | 66.4%(+33.6)#25 | 62.5%(+37.5)#1,576 |
| 25. | Como | 100.0% | 66.4%(+33.6)#26 | 62.5%(+37.5)#1,904 |
| 26. | Dundarrach | 100.0% | 66.4%(+33.6)#27 | 62.5%(+37.5)#2,270 |
| 27. | Pinetown | 100.0% | 66.4%(+33.6)#28 | 62.5%(+37.5)#2,415 |
| 28. | Rex | 100.0% | 66.4%(+33.6)#29 | 62.5%(+37.5)#2,416 |
| 29. | Delway | 100.0% | 66.4%(+33.6)#30 | 62.5%(+37.5)#2,509 |
| 30. | Graingers | 100.0% | 66.4%(+33.6)#31 | 62.5%(+37.5)#2,617 |
| 31. | Dellview | 100.0% | 66.4%(+33.6)#32 | 62.5%(+37.5)#2,695 |
| 32. | Fontana Dam | 100.0% | 66.4%(+33.6)#33 | 62.5%(+37.5)#2,982 |
| 33. | Briar Chapel | 99.3% | 66.4%(+32.9)#34 | 62.5%(+36.8)#3,201 |
| 34. | Walnut Creek | 99.3% | 66.4%(+32.9)#35 | 62.5%(+36.8)#3,212 |
| 35. | Goldston | 99.2% | 66.4%(+32.8)#36 | 62.5%(+36.7)#3,244 |
| 36. | Governors Club | 99.1% | 66.4%(+32.7)#37 | 62.5%(+36.6)#3,263 |
| 37. | Weddington | 98.9% | 66.4%(+32.5)#38 | 62.5%(+36.4)#3,318 |
| 38. | Oak Ridge | 98.4% | 66.4%(+32.0)#39 | 62.5%(+35.9)#3,490 |
| 39. | Marvin | 98.4% | 66.4%(+32.0)#40 | 62.5%(+35.9)#3,491 |
| 40. | Southern Shores | 98.3% | 66.4%(+31.9)#41 | 62.5%(+35.8)#3,539 |
| 41. | Neuse Forest | 98.3% | 66.4%(+31.9)#42 | 62.5%(+35.8)#3,542 |
| 42. | Westport | 98.2% | 66.4%(+31.8)#43 | 62.5%(+35.7)#3,587 |
| 43. | Pinebluff | 98.1% | 66.4%(+31.7)#44 | 62.5%(+35.6)#3,623 |
| 44. | Lasker | 98.1% | 66.4%(+31.7)#45 | 62.5%(+35.6)#3,650 |
| 45. | Wesley Chapel | 98.0% | 66.4%(+31.6)#46 | 62.5%(+35.5)#3,660 |
| 46. | Alamance | 97.8% | 66.4%(+31.4)#47 | 62.5%(+35.3)#3,749 |
| 47. | Pumpkin Center | 97.7% | 66.4%(+31.3)#48 | 62.5%(+35.2)#3,791 |
| 48. | Halifax | 97.7% | 66.4%(+31.3)#49 | 62.5%(+35.2)#3,816 |
| 49. | New London | 97.5% | 66.4%(+31.1)#50 | 62.5%(+35.0)#3,896 |
| 50. | Biltmore Forest | 97.4% | 66.4%(+31.0)#51 | 62.5%(+34.9)#3,925 |
| 51. | Washington Park | 97.4% | 66.4%(+31.0)#52 | 62.5%(+34.9)#3,937 |
| 52. | Salemburg | 97.2% | 66.4%(+30.8)#53 | 62.5%(+34.7)#4,026 |
| 53. | Topsail Beach | 97.1% | 66.4%(+30.7)#54 | 62.5%(+34.6)#4,074 |
| 54. | Northlakes | 97.0% | 66.4%(+30.6)#55 | 62.5%(+34.5)#4,117 |
| 55. | Sedalia | 97.0% | 66.4%(+30.6)#56 | 62.5%(+34.5)#4,139 |
| 56. | Mineral Springs | 96.9% | 66.4%(+30.5)#57 | 62.5%(+34.4)#4,170 |
| 57. | Sims | 96.9% | 66.4%(+30.5)#58 | 62.5%(+34.4)#4,190 |
| 58. | Harrellsville | 96.9% | 66.4%(+30.5)#59 | 62.5%(+34.4)#4,198 |
| 59. | Kingstown | 96.8% | 66.4%(+30.4)#60 | 62.5%(+34.3)#4,244 |
| 60. | Spout Springs | 96.7% | 66.4%(+30.3)#61 | 62.5%(+34.2)#4,272 |
| 61. | Ogden | 96.0% | 66.4%(+29.6)#62 | 62.5%(+33.5)#4,606 |
| 62. | Whispering Pines | 96.0% | 66.4%(+29.6)#63 | 62.5%(+33.5)#4,610 |
| 63. | Gatesville | 96.0% | 66.4%(+29.6)#64 | 62.5%(+33.5)#4,643 |
| 64. | Cape Carteret | 95.9% | 66.4%(+29.5)#65 | 62.5%(+33.4)#4,667 |
| 65. | Ocracoke | 95.8% | 66.4%(+29.4)#66 | 62.5%(+33.3)#4,734 |
| 66. | Mcadenville | 95.7% | 66.4%(+29.3)#67 | 62.5%(+33.2)#4,777 |
| 67. | Cooleemee | 95.7% | 66.4%(+29.3)#68 | 62.5%(+33.2)#4,781 |
| 68. | Oakboro | 95.6% | 66.4%(+29.2)#69 | 62.5%(+33.1)#4,838 |
| 69. | Danbury | 95.6% | 66.4%(+29.2)#70 | 62.5%(+33.1)#4,865 |
| 70. | Springdale | 95.3% | 66.4%(+28.9)#71 | 62.5%(+32.8)#4,991 |
| 71. | Stem | 95.3% | 66.4%(+28.9)#72 | 62.5%(+32.8)#4,992 |
| 72. | Whitsett | 95.1% | 66.4%(+28.7)#73 | 62.5%(+32.6)#5,114 |
| 73. | Summerfield | 95.0% | 66.4%(+28.6)#74 | 62.5%(+32.5)#5,138 |
| 74. | Troutman | 94.9% | 66.4%(+28.5)#75 | 62.5%(+32.4)#5,185 |
| 75. | Seven Lakes | 94.8% | 66.4%(+28.4)#76 | 62.5%(+32.3)#5,229 |
| 76. | Rockfish | 94.8% | 66.4%(+28.4)#77 | 62.5%(+32.3)#5,230 |
| 77. | Faith | 94.8% | 66.4%(+28.4)#78 | 62.5%(+32.3)#5,246 |
| 78. | Parkton | 94.7% | 66.4%(+28.3)#79 | 62.5%(+32.2)#5,302 |
| 79. | Stedman | 94.6% | 66.4%(+28.2)#80 | 62.5%(+32.1)#5,338 |
| 80. | Red Oak | 94.5% | 66.4%(+28.1)#81 | 62.5%(+32.0)#5,365 |
| 81. | Kittrell | 94.3% | 66.4%(+27.9)#82 | 62.5%(+31.8)#5,509 |
| 82. | Lumber Bridge | 94.3% | 66.4%(+27.9)#83 | 62.5%(+31.8)#5,510 |
| 83. | Hemby Bridge | 94.2% | 66.4%(+27.8)#84 | 62.5%(+31.7)#5,522 |
| 84. | Pleasant Hill | 94.0% | 66.4%(+27.6)#85 | 62.5%(+31.5)#5,638 |
| 85. | Colerain | 94.0% | 66.4%(+27.6)#86 | 62.5%(+31.5)#5,649 |
| 86. | Cherry Branch | 93.9% | 66.4%(+27.5)#87 | 62.5%(+31.4)#5,690 |
| 87. | Ranlo | 93.7% | 66.4%(+27.3)#88 | 62.5%(+31.2)#5,798 |
| 88. | Sunbury | 93.7% | 66.4%(+27.3)#89 | 62.5%(+31.2)#5,839 |
| 89. | Fairfield Harbour | 93.6% | 66.4%(+27.2)#90 | 62.5%(+31.1)#5,854 |
| 90. | Lowell | 93.2% | 66.4%(+26.8)#91 | 62.5%(+30.7)#6,060 |
| 91. | Trenton | 93.2% | 66.4%(+26.8)#92 | 62.5%(+30.7)#6,096 |
| 92. | Germanton | 92.9% | 66.4%(+26.5)#93 | 62.5%(+30.4)#6,217 |
| 93. | Vass | 92.7% | 66.4%(+26.3)#94 | 62.5%(+30.2)#6,319 |
| 94. | Flat Rock | 92.7% | 66.4%(+26.3)#95 | 62.5%(+30.2)#6,323 |
| 95. | Bethania | 92.7% | 66.4%(+26.3)#96 | 62.5%(+30.2)#6,343 |
| 96. | Wallburg | 92.6% | 66.4%(+26.2)#97 | 62.5%(+30.1)#6,371 |
| 97. | Harrisburg | 92.5% | 66.4%(+26.1)#98 | 62.5%(+30.0)#6,403 |
| 98. | St James | 92.5% | 66.4%(+26.1)#99 | 62.5%(+30.0)#6,408 |
| 99. | Macon | 92.5% | 66.4%(+26.1)#100 | 62.5%(+30.0)#6,464 |
| 100. | Trent Woods | 92.4% | 66.4%(+26.0)#101 | 62.5%(+29.9)#6,471 |
Common Questions
What are the Top 10 Cities with the Highest Percentage of Households Residing in Detached Homes in North Carolina?
Top 10 Cities with the Highest Percentage of Households Residing in Detached Homes in North Carolina are:
#1
100.0%
#2
100.0%
#3
100.0%
#4
100.0%
#5
100.0%
#6
100.0%
#7
100.0%
#8
100.0%
#9
100.0%
#10
100.0%
What city has the Highest Percentage of Households Residing in Detached Homes in North Carolina?
Brices Creek has the Highest Percentage of Households Residing in Detached Homes in North Carolina with 100.0%.
What is the Percentage of Households Residing in Detached Homes in the State of North Carolina?
Percentage of Households Residing in Detached Homes in North Carolina is 66.4%.
What is the Percentage of Households Residing in Detached Homes in the United States?
Percentage of Households Residing in Detached Homes in the United States is 62.5%.