Cities with the Highest Percentage of Chilean Population in Georgia

RELATED REPORTS & OPTIONS

Chilean
Population
Families and Households
Female Fertility
Female Fertility (Unmarried)
Race (Community Size)
Race (Percentage)
Ancestry (Community Size)
AfghanAfricanAlaska NativeAlaskan AthabascanAlbanianAleutAlsatianAmericanApacheArabArapahoArgentineanArmenianAssyrian / Chaldean / SyriacAustralianAustrianBahamianBangladeshiBarbadianBasqueBelgianBelizeanBermudanBhutaneseBlackfeetBolivianBrazilianBritishBritish West IndianBulgarianBurmeseCajunCambodianCanadianCape VerdeanCarpatho RusynCelticCentral AmericanCentral American IndianCherokeeCheyenneChickasawChileanChineseChippewaChoctawColombianColvilleComancheCosta RicanCreeCreekCroatianCrowCubanCypriotCzechCzechoslovakianDanishDelawareDominicanDutchDutch West IndianEastern EuropeanEcuadorianEgyptianEnglishEstonianEthiopianEuropeanFijianFilipinoFinnishFrenchFrench American IndianFrench CanadianGermanGerman RussianGhanaianGreekGuamanian / ChamorroGuatemalanGuyaneseHaitianHmongHonduranHopiHoumaHungarianIcelanderIndian (Asian)IndonesianInupiatIranianIraqiIrishIroquoisIsraeliItalianJamaicanJapaneseJordanianKenyanKiowaKoreanLaotianLatvianLebaneseLiberianLithuanianLumbeeLuxembourgerMacedonianMalaysianMalteseMarshalleseMenomineeMexicanMexican American IndianMongolianMoroccanNative HawaiianNavajoNepaleseNew ZealanderNicaraguanNigerianNorthern EuropeanNorwegianOkinawanOsageOttawaPaiutePakistaniPalestinianPanamanianParaguayanPennsylvania GermanPeruvianPimaPolishPortuguesePotawatomiPuebloPuerto RicanPuget Sound SalishRomanianRussianSalvadoranSamoanScandinavianScotch-IrishScottishSeminoleSenegaleseSerbianShoshoneSierra LeoneanSiouxSlavicSlovakSloveneSomaliSouth AfricanSouth AmericanSouth American IndianSoviet UnionSpaniardSpanishSpanish AmericanSpanish American IndianSri LankanSubsaharan AfricanSudaneseSwedishSwissSyrianTaiwaneseThaiTlingit-HaidaTohono O'OdhamTonganTrinidadian and TobagonianTsimshianTurkishU.S. Virgin IslanderUgandanUkrainianUruguayanUteVenezuelanVietnameseWelshWest IndianYakamaYaquiYugoslavianYumanYup'ikZimbabwean
Ancestry (Percentage)
AfghanAfricanAlaska NativeAlaskan AthabascanAlbanianAleutAlsatianAmericanApacheArabArapahoArgentineanArmenianAssyrian / Chaldean / SyriacAustralianAustrianBahamianBangladeshiBarbadianBasqueBelgianBelizeanBermudanBhutaneseBlackfeetBolivianBrazilianBritishBritish West IndianBulgarianBurmeseCajunCambodianCanadianCape VerdeanCarpatho RusynCelticCentral AmericanCentral American IndianCherokeeCheyenneChickasawChileanChineseChippewaChoctawColombianColvilleComancheCosta RicanCreeCreekCroatianCrowCubanCypriotCzechCzechoslovakianDanishDelawareDominicanDutchDutch West IndianEastern EuropeanEcuadorianEgyptianEnglishEstonianEthiopianEuropeanFijianFilipinoFinnishFrenchFrench American IndianFrench CanadianGermanGerman RussianGhanaianGreekGuamanian / ChamorroGuatemalanGuyaneseHaitianHmongHonduranHopiHoumaHungarianIcelanderIndian (Asian)IndonesianInupiatIranianIraqiIrishIroquoisIsraeliItalianJamaicanJapaneseJordanianKenyanKiowaKoreanLaotianLatvianLebaneseLiberianLithuanianLumbeeLuxembourgerMacedonianMalaysianMalteseMarshalleseMenomineeMexicanMexican American IndianMongolianMoroccanNative HawaiianNavajoNepaleseNew ZealanderNicaraguanNigerianNorthern EuropeanNorwegianOkinawanOsageOttawaPaiutePakistaniPalestinianPanamanianParaguayanPennsylvania GermanPeruvianPimaPolishPortuguesePotawatomiPuebloPuerto RicanPuget Sound SalishRomanianRussianSalvadoranSamoanScandinavianScotch-IrishScottishSeminoleSenegaleseSerbianShoshoneSierra LeoneanSiouxSlavicSlovakSloveneSomaliSouth AfricanSouth AmericanSouth American IndianSoviet UnionSpaniardSpanishSpanish AmericanSpanish American IndianSri LankanSubsaharan AfricanSudaneseSwedishSwissSyrianTaiwaneseThaiTlingit-HaidaTohono O'OdhamTonganTrinidadian and TobagonianTsimshianTurkishU.S. Virgin IslanderUgandanUkrainianUruguayanUteVenezuelanVietnameseWelshWest IndianYakamaYaquiYugoslavianYumanYup'ikZimbabwean
Immigrant Origin (Total)
AfghanistanAfricaAlbaniaArgentinaArmeniaAsiaAustraliaAustriaAzoresBahamasBangladeshBarbadosBelarusBelgiumBelizeBoliviaBosnia and HerzegovinaBrazilBulgariaBurma / MyanmarCabo VerdeCambodiaCameroonCanadaCaribbeanCentral AmericaChileChinaColombiaCongoCosta RicaCroatiaCubaCzechoslovakiaDenmarkDominicaDominican RepublicEastern AfricaEastern AsiaEastern EuropeEcuadorEgyptEl SalvadorEnglandEritreaEthiopiaEuropeFijiFranceGermanyGhanaGreeceGrenadaGuatemalaGuyanaHaitiHondurasHong KongHungaryIndiaIndonesiaIranIraqIrelandIsraelItalyJamaicaJapanJordanKazakhstanKenyaKoreaKuwaitLaosLatin AmericaLatviaLebanonLiberiaLithuaniaMalaysiaMexicoMicronesiaMiddle AfricaMoldovaMoroccoNepalNetherlandsNicaraguaNigeriaNorth MacedoniaNorthern AfricaNorthern EuropeNorwayOceaniaPakistanPanamaPeruPhilippinesPolandPortugalRomaniaRussiaSaudi ArabiaScotlandSenegalSerbiaSierra LeoneSingaporeSomaliaSouth AfricaSouth AmericaSouth Central AsiaSouth Eastern AsiaSouthern EuropeSpainSri LankaSt. Vincent and the GrenadinesSudanSwedenSwitzerlandSyriaTaiwanThailandTrinidad and TobagoTurkeyUgandaUkraineUruguayUzbekistanVenezuelaVietnamWest IndiesWestern AfricaWestern AsiaWestern EuropeYemenZaireZimbabwe
Immigrant Origin (Percentage)
AfghanistanAfricaAlbaniaArgentinaArmeniaAsiaAustraliaAustriaAzoresBahamasBangladeshBarbadosBelarusBelgiumBelizeBoliviaBosnia and HerzegovinaBrazilBulgariaBurma / MyanmarCabo VerdeCambodiaCameroonCanadaCaribbeanCentral AmericaChileChinaColombiaCongoCosta RicaCroatiaCubaCzechoslovakiaDenmarkDominicaDominican RepublicEastern AfricaEastern AsiaEastern EuropeEcuadorEgyptEl SalvadorEnglandEritreaEthiopiaEuropeFijiFranceGermanyGhanaGreeceGrenadaGuatemalaGuyanaHaitiHondurasHong KongHungaryIndiaIndonesiaIranIraqIrelandIsraelItalyJamaicaJapanJordanKazakhstanKenyaKoreaKuwaitLaosLatin AmericaLatviaLebanonLiberiaLithuaniaMalaysiaMexicoMicronesiaMiddle AfricaMoldovaMoroccoNepalNetherlandsNicaraguaNigeriaNorth MacedoniaNorthern AfricaNorthern EuropeNorwayOceaniaPakistanPanamaPeruPhilippinesPolandPortugalRomaniaRussiaSaudi ArabiaScotlandSenegalSerbiaSierra LeoneSingaporeSomaliaSouth AfricaSouth AmericaSouth Central AsiaSouth Eastern AsiaSouthern EuropeSpainSri LankaSt. Vincent and the GrenadinesSudanSwedenSwitzerlandSyriaTaiwanThailandTrinidad and TobagoTurkeyUgandaUkraineUruguayUzbekistanVenezuelaVietnamWest IndiesWestern AfricaWestern AsiaWestern EuropeYemenZaireZimbabwe
Income
Income (Families)
Income (Households)
Poverty
Poverty (Families)
Unemployment
Employment Occupations
Employment Industries
Employer Class
Commute Time
Commute Means
School Enrollment
Education by Degree Field
Occupancy
Finances
Physical Characteristics
Georgia
Compare Cities
Comparison Subject

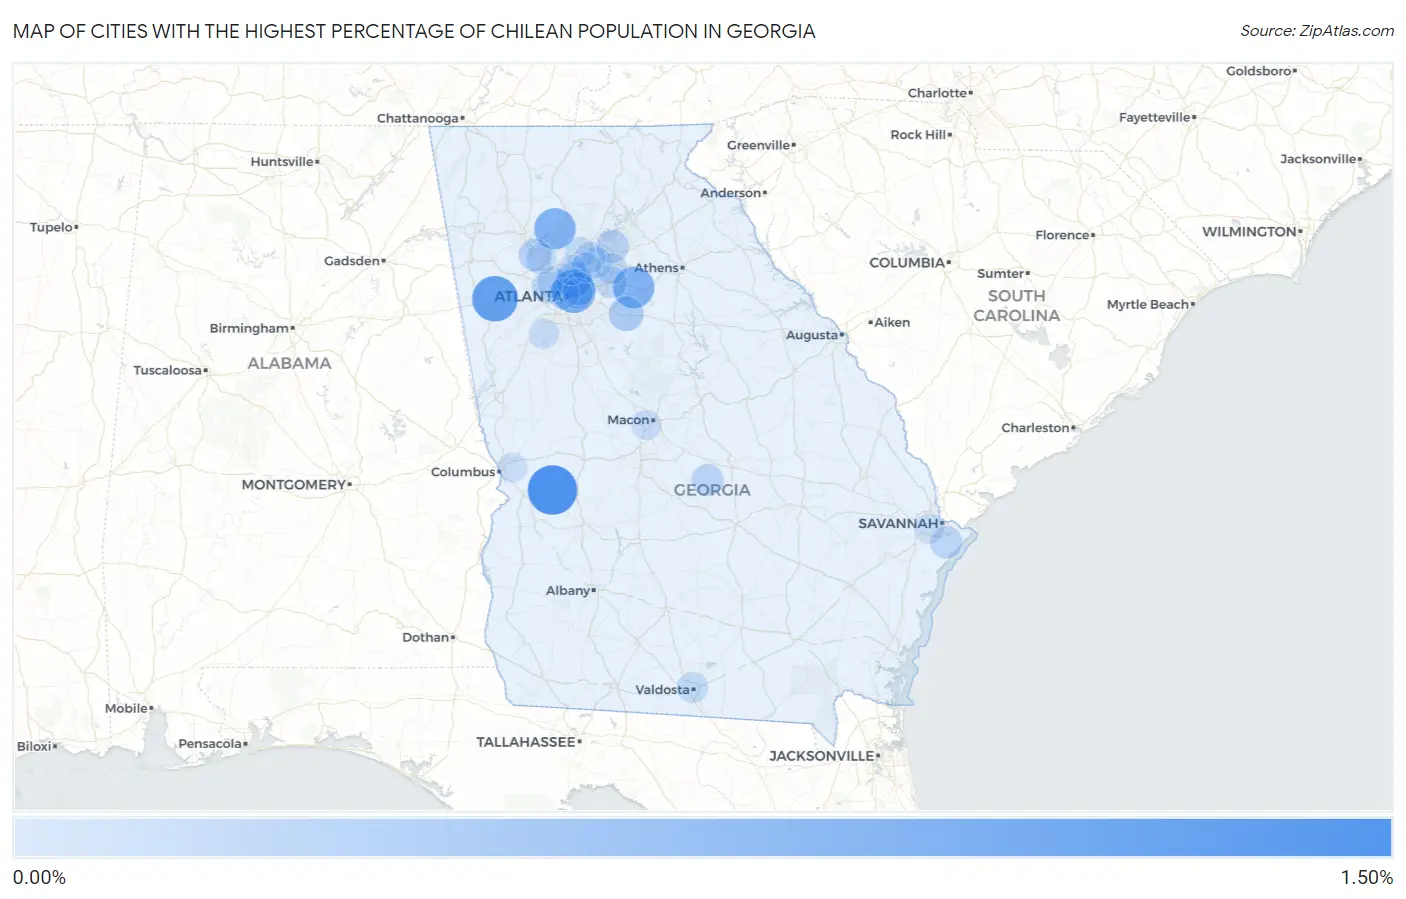
Map of Cities with the Highest Percentage of Chilean Population in Georgia

0.00%
1.50%
Cities with the Highest Percentage of Chilean Population in Georgia Map

Cities with the Highest Percentage of Chilean Population in Georgia

City Chilean vs State vs National
1.Buena Vista1.07%0.029%(+1.04)#10.055%(+1.01)#137
2.Temple0.85%0.029%(+0.824)#20.055%(+0.797)#189
3.Druid Hills0.73%0.029%(+0.704)#30.055%(+0.677)#226
4.Between0.61%0.029%(+0.582)#40.055%(+0.556)#274
5.Canton0.61%0.029%(+0.580)#50.055%(+0.554)#276
6.Brookhaven0.30%0.029%(+0.276)#60.055%(+0.249)#535
7.Oxford0.25%0.029%(+0.217)#70.055%(+0.191)#659
8.North Decatur0.18%0.029%(+0.152)#80.055%(+0.125)#831
9.Buford0.15%0.029%(+0.122)#90.055%(+0.096)#925
10.Acworth0.14%0.029%(+0.110)#100.055%(+0.084)#973
11.Chester0.12%0.029%(+0.089)#110.055%(+0.062)#1,069
12.Skidaway Island0.11%0.029%(+0.079)#120.055%(+0.052)#1,118
13.Mableton0.091%0.029%(+0.063)#130.055%(+0.036)#1,227
14.Snellville0.086%0.029%(+0.057)#140.055%(+0.031)#1,257
15.Duluth0.063%0.029%(+0.034)#150.055%(+0.008)#1,430
16.Valdosta0.060%0.029%(+0.031)#160.055%(+0.005)#1,456
17.Smyrna0.057%0.029%(+0.029)#170.055%(+0.002)#1,486
18.Kennesaw0.054%0.029%(+0.025)#180.055%(-0.001)#1,519
19.Lawrenceville0.053%0.029%(+0.024)#190.055%(-0.003)#1,538
20.Johns Creek0.052%0.029%(+0.024)#200.055%(-0.003)#1,540
21.Atlanta0.048%0.029%(+0.020)#210.055%(-0.007)#1,576
22.Alpharetta0.042%0.029%(+0.014)#220.055%(-0.013)#1,627
23.Decatur0.029%0.029%(-0.000)#230.055%(-0.027)#1,757
24.Augusta-Richmond County Consolidated Government (Balance)0.028%0.029%(-0.000)#240.055%(-0.027)#1,761
25.Sandy Springs0.021%0.029%(-0.007)#250.055%(-0.034)#1,835
26.Macon Bibb County0.016%0.029%(-0.013)#260.055%(-0.039)#1,888
27.Tyrone0.013%0.029%(-0.016)#270.055%(-0.042)#1,915
28.Athens-Clarke County Unified Government (Balance)0.011%0.029%(-0.018)#280.055%(-0.044)#1,926
29.Columbus0.0073%0.029%(-0.021)#290.055%(-0.048)#1,966
30.Savannah0.0047%0.029%(-0.024)#300.055%(-0.050)#1,991
31.Peachtree Corners0.0024%0.029%(-0.026)#310.055%(-0.053)#2,004

Common Questions

What are the Top 10 Cities with the Highest Percentage of Chilean Population in Georgia?
Top 10 Cities with the Highest Percentage of Chilean Population in Georgia are:
#1
1.07%
#2
0.85%
#3
0.73%
#4
0.61%
#5
0.61%
#6
0.30%
#7
0.25%
#8
0.18%
#9
0.15%
#10
0.14%
What city has the Highest Percentage of Chilean Population in Georgia?
Buena Vista has the Highest Percentage of Chilean Population in Georgia with 1.07%.
What is the Percentage of Chilean Population in the State of Georgia?
Percentage of Chilean Population in Georgia is 0.029%.
What is the Percentage of Chilean Population in the United States?
Percentage of Chilean Population in the United States is 0.055%.