Cities with the Highest Percentage of Chilean Population in the United States
RELATED REPORTS & OPTIONS
Chilean
United States
Compare Cities
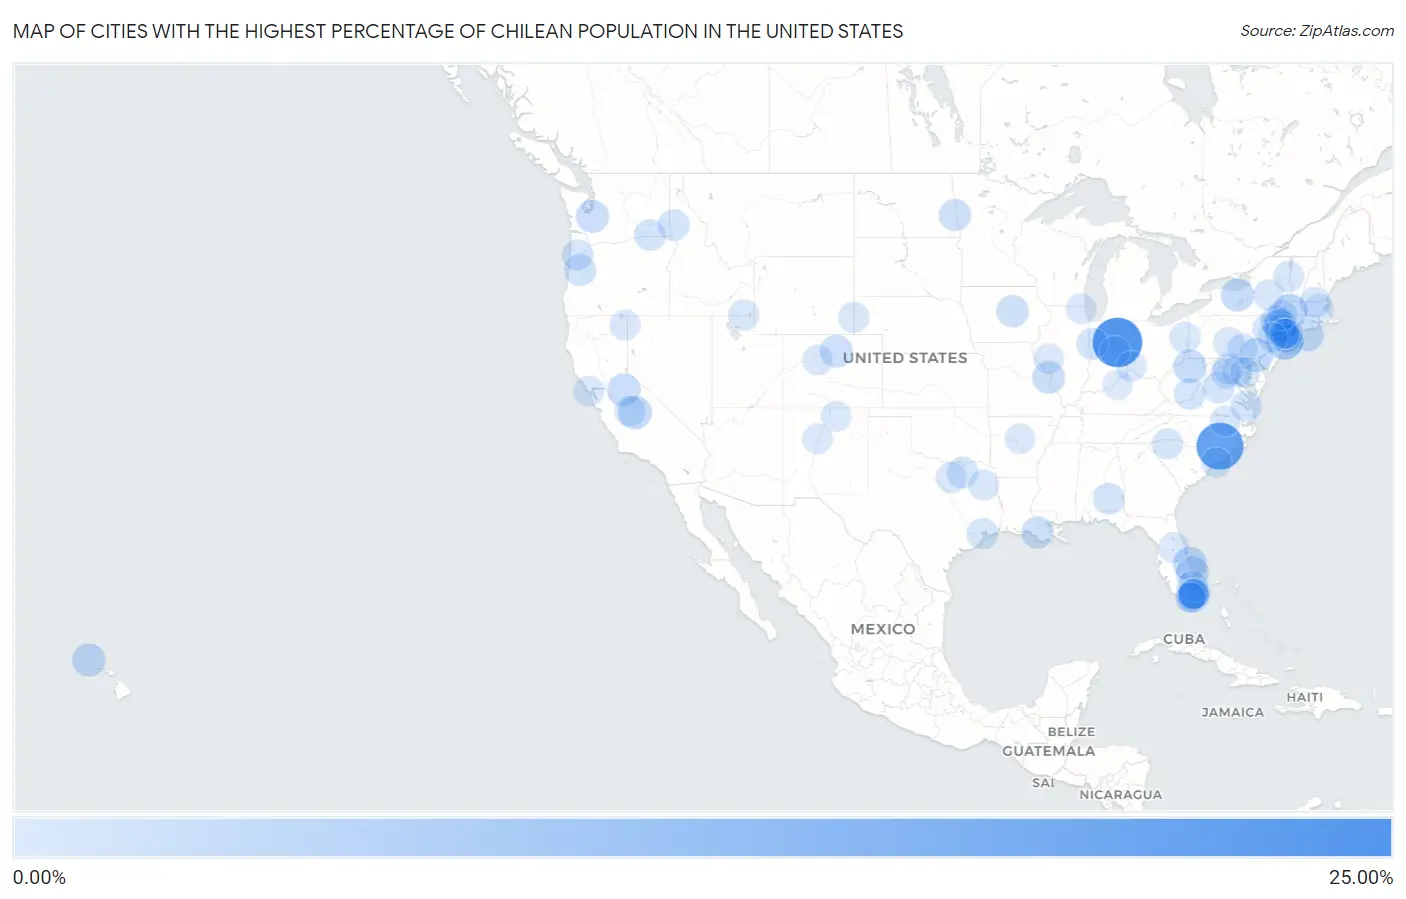
Map of Cities with the Highest Percentage of Chilean Population in the United States
0.00%
25.00%
Cities with the Highest Percentage of Chilean Population in the United States
| City | Chilean | vs State | vs National | |
| 1. | Landess | 24.47% | 0.010%(+24.5)#1 | 0.055%(+24.4)#1 |
| 2. | Ingold | 21.27% | 0.042%(+21.2)#1 | 0.055%(+21.2)#2 |
| 3. | Port Morris | 14.21% | 0.12%(+14.1)#1 | 0.055%(+14.2)#3 |
| 4. | Fieldsboro Borough | 12.30% | 0.12%(+12.2)#2 | 0.055%(+12.2)#4 |
| 5. | Ashley Borough | 9.49% | 0.038%(+9.46)#1 | 0.055%(+9.44)#5 |
| 6. | Cedarhurst | 8.81% | 0.10%(+8.71)#1 | 0.055%(+8.76)#6 |
| 7. | Poplar Plains | 6.64% | 0.099%(+6.54)#1 | 0.055%(+6.58)#7 |
| 8. | Housatonic | 6.60% | 0.057%(+6.54)#1 | 0.055%(+6.54)#8 |
| 9. | El Portal | 5.99% | 0.15%(+5.84)#1 | 0.055%(+5.93)#9 |
| 10. | Gardnertown | 5.68% | 0.10%(+5.58)#2 | 0.055%(+5.63)#10 |
| 11. | Unionville | 5.40% | 0.038%(+5.36)#2 | 0.055%(+5.35)#11 |
| 12. | Orchid | 5.40% | 0.15%(+5.25)#2 | 0.055%(+5.35)#12 |
| 13. | Minkler | 4.98% | 0.076%(+4.90)#1 | 0.055%(+4.92)#13 |
| 14. | Wolf Summit | 4.81% | 0.011%(+4.80)#1 | 0.055%(+4.76)#14 |
| 15. | Punaluu | 4.80% | 0.038%(+4.76)#1 | 0.055%(+4.74)#15 |
| 16. | Byram | 4.62% | 0.099%(+4.52)#2 | 0.055%(+4.56)#16 |
| 17. | Newark | 4.59% | 0.10%(+4.49)#3 | 0.055%(+4.54)#17 |
| 18. | Mono Vista | 4.50% | 0.076%(+4.43)#2 | 0.055%(+4.45)#18 |
| 19. | South Creek | 4.26% | 0.057%(+4.21)#1 | 0.055%(+4.21)#19 |
| 20. | Ocean Breeze | 4.21% | 0.15%(+4.06)#3 | 0.055%(+4.16)#20 |
| 21. | Altona | 4.14% | 0.067%(+4.08)#1 | 0.055%(+4.09)#21 |
| 22. | Overland | 4.10% | 0.022%(+4.08)#1 | 0.055%(+4.04)#22 |
| 23. | Riverdale Borough | 4.07% | 0.12%(+3.95)#3 | 0.055%(+4.01)#23 |
| 24. | Vails Gate | 4.06% | 0.10%(+3.96)#4 | 0.055%(+4.01)#24 |
| 25. | Amagansett | 3.98% | 0.10%(+3.88)#5 | 0.055%(+3.93)#25 |
| 26. | Bal Harbour | 3.72% | 0.15%(+3.57)#4 | 0.055%(+3.67)#26 |
| 27. | Conrad | 3.65% | 0.016%(+3.63)#1 | 0.055%(+3.59)#27 |
| 28. | Verplanck | 3.64% | 0.10%(+3.54)#6 | 0.055%(+3.59)#28 |
| 29. | Amelia | 3.50% | 0.012%(+3.49)#1 | 0.055%(+3.44)#29 |
| 30. | Argusville | 3.49% | 0.035%(+3.46)#1 | 0.055%(+3.44)#30 |
| 31. | Baden Borough | 3.21% | 0.038%(+3.17)#3 | 0.055%(+3.16)#31 |
| 32. | Ellenville | 3.20% | 0.10%(+3.10)#7 | 0.055%(+3.15)#32 |
| 33. | Key Biscayne | 3.07% | 0.15%(+2.93)#5 | 0.055%(+3.02)#33 |
| 34. | Monroe | 3.05% | 0.037%(+3.01)#1 | 0.055%(+2.99)#34 |
| 35. | Oxford | 3.01% | 0.010%(+3.00)#2 | 0.055%(+2.96)#35 |
| 36. | Piney Mountain | 2.94% | 0.072%(+2.87)#1 | 0.055%(+2.88)#36 |
| 37. | Goshen | 2.91% | 0.017%(+2.89)#1 | 0.055%(+2.85)#37 |
| 38. | Juliaetta | 2.91% | 0.035%(+2.87)#1 | 0.055%(+2.85)#38 |
| 39. | Lewisburg | 2.72% | 0.011%(+2.71)#2 | 0.055%(+2.67)#39 |
| 40. | Garrett | 2.72% | 0.057%(+2.67)#2 | 0.055%(+2.67)#40 |
| 41. | Hamilton | 2.67% | 0.072%(+2.60)#2 | 0.055%(+2.62)#41 |
| 42. | Chelsea Cove | 2.60% | 0.10%(+2.49)#8 | 0.055%(+2.54)#42 |
| 43. | Shoreacres | 2.56% | 0.040%(+2.52)#1 | 0.055%(+2.51)#43 |
| 44. | Blue Ridge | 2.55% | 0.040%(+2.51)#2 | 0.055%(+2.49)#44 |
| 45. | Port Royal Borough | 2.47% | 0.038%(+2.43)#4 | 0.055%(+2.41)#45 |
| 46. | Bethel Manor | 2.44% | 0.072%(+2.37)#3 | 0.055%(+2.39)#46 |
| 47. | North Bay Village | 2.39% | 0.15%(+2.24)#6 | 0.055%(+2.34)#47 |
| 48. | Southern Shops | 2.31% | 0.020%(+2.29)#1 | 0.055%(+2.25)#48 |
| 49. | Willamina | 2.27% | 0.037%(+2.24)#2 | 0.055%(+2.22)#49 |
| 50. | Pepperell | 2.22% | 0.057%(+2.17)#2 | 0.055%(+2.17)#50 |
| 51. | Old Fig Garden | 2.21% | 0.076%(+2.13)#3 | 0.055%(+2.16)#51 |
| 52. | Union Grove | 2.13% | 0.040%(+2.09)#3 | 0.055%(+2.08)#52 |
| 53. | Port Henry | 2.12% | 0.10%(+2.02)#9 | 0.055%(+2.07)#53 |
| 54. | Leetonia | 2.12% | 0.020%(+2.10)#1 | 0.055%(+2.07)#54 |
| 55. | Franklin | 2.10% | 0.035%(+2.07)#2 | 0.055%(+2.05)#55 |
| 56. | Strodes Mills | 2.10% | 0.038%(+2.06)#5 | 0.055%(+2.04)#56 |
| 57. | North Wantagh | 2.04% | 0.10%(+1.94)#10 | 0.055%(+1.99)#57 |
| 58. | Watergate | 2.03% | 0.15%(+1.88)#7 | 0.055%(+1.98)#58 |
| 59. | Lyman | 2.03% | 0.059%(+1.97)#1 | 0.055%(+1.97)#59 |
| 60. | Westlake | 2.00% | 0.040%(+1.96)#4 | 0.055%(+1.94)#60 |
| 61. | Little Falls | 1.96% | 0.10%(+1.86)#11 | 0.055%(+1.90)#61 |
| 62. | Conashaugh Lakes | 1.94% | 0.038%(+1.90)#6 | 0.055%(+1.88)#62 |
| 63. | Mifflintown Borough | 1.92% | 0.038%(+1.88)#7 | 0.055%(+1.86)#63 |
| 64. | Hollister | 1.89% | 0.042%(+1.85)#2 | 0.055%(+1.83)#64 |
| 65. | Strasburg Borough | 1.87% | 0.038%(+1.84)#8 | 0.055%(+1.82)#65 |
| 66. | Mount Plymouth | 1.83% | 0.15%(+1.68)#8 | 0.055%(+1.78)#66 |
| 67. | Hainesville | 1.80% | 0.034%(+1.77)#1 | 0.055%(+1.75)#67 |
| 68. | Woodlawn Heights | 1.77% | 0.010%(+1.76)#3 | 0.055%(+1.71)#68 |
| 69. | North Chevy Chase | 1.76% | 0.074%(+1.69)#1 | 0.055%(+1.71)#69 |
| 70. | Surfside | 1.76% | 0.15%(+1.61)#9 | 0.055%(+1.70)#70 |
| 71. | Rutherford | 1.75% | 0.038%(+1.71)#9 | 0.055%(+1.69)#71 |
| 72. | Baxter Estates | 1.74% | 0.10%(+1.64)#12 | 0.055%(+1.69)#72 |
| 73. | Bolinas | 1.72% | 0.076%(+1.64)#4 | 0.055%(+1.66)#73 |
| 74. | Elmsford | 1.71% | 0.10%(+1.61)#13 | 0.055%(+1.66)#74 |
| 75. | Candlewood Isle | 1.71% | 0.099%(+1.61)#3 | 0.055%(+1.66)#75 |
| 76. | Lake Hiawatha | 1.70% | 0.12%(+1.58)#4 | 0.055%(+1.64)#76 |
| 77. | Hamburg Borough | 1.68% | 0.12%(+1.56)#5 | 0.055%(+1.62)#77 |
| 78. | Cedarville | 1.66% | 0.076%(+1.58)#5 | 0.055%(+1.61)#78 |
| 79. | Marshall | 1.62% | 0.072%(+1.54)#4 | 0.055%(+1.56)#79 |
| 80. | Eagle Nest | 1.61% | 0.041%(+1.57)#1 | 0.055%(+1.55)#80 |
| 81. | Edwards | 1.59% | 0.067%(+1.53)#2 | 0.055%(+1.54)#81 |
| 82. | The Crossings | 1.57% | 0.15%(+1.42)#10 | 0.055%(+1.51)#82 |
| 83. | Calabash | 1.56% | 0.042%(+1.51)#3 | 0.055%(+1.50)#83 |
| 84. | Lynnville | 1.55% | 0.034%(+1.52)#2 | 0.055%(+1.50)#84 |
| 85. | Pleasant Run Farm | 1.52% | 0.020%(+1.50)#2 | 0.055%(+1.46)#85 |
| 86. | Corrales | 1.51% | 0.041%(+1.47)#2 | 0.055%(+1.45)#86 |
| 87. | Greenbrier | 1.49% | 0.019%(+1.48)#1 | 0.055%(+1.44)#87 |
| 88. | Cochituate | 1.47% | 0.057%(+1.41)#3 | 0.055%(+1.42)#88 |
| 89. | Riverside | 1.39% | 0.099%(+1.29)#4 | 0.055%(+1.33)#89 |
| 90. | Leesylvania | 1.38% | 0.072%(+1.31)#5 | 0.055%(+1.32)#90 |
| 91. | Tivoli | 1.37% | 0.10%(+1.27)#14 | 0.055%(+1.32)#91 |
| 92. | Chatham Borough | 1.37% | 0.12%(+1.25)#6 | 0.055%(+1.31)#92 |
| 93. | Miami Springs | 1.35% | 0.15%(+1.20)#11 | 0.055%(+1.29)#93 |
| 94. | Edgewater Borough | 1.34% | 0.12%(+1.22)#7 | 0.055%(+1.29)#94 |
| 95. | Succasunna | 1.32% | 0.12%(+1.21)#8 | 0.055%(+1.27)#95 |
| 96. | White Plains | 1.32% | 0.10%(+1.22)#15 | 0.055%(+1.26)#96 |
| 97. | Riva | 1.32% | 0.074%(+1.24)#2 | 0.055%(+1.26)#97 |
| 98. | Pinecrest | 1.30% | 0.15%(+1.15)#12 | 0.055%(+1.25)#98 |
| 99. | Woodland Hills | 1.29% | 0.010%(+1.28)#1 | 0.055%(+1.23)#99 |
| 100. | Bay Harbor Islands | 1.28% | 0.15%(+1.13)#13 | 0.055%(+1.23)#100 |
Common Questions
What are the Top 10 Cities with the Highest Percentage of Chilean Population in the United States?
Top 10 Cities with the Highest Percentage of Chilean Population in the United States are:
#1
24.47%
#2
21.27%
#3
8.81%
#4
6.60%
#5
5.99%
#6
5.68%
#7
5.40%
#8
5.40%
#9
4.98%
#10
4.81%
What city has the Highest Percentage of Chilean Population in the United States?
Landess has the Highest Percentage of Chilean Population in the United States with 24.47%.
What is the Percentage of Chilean Population in the United States?
Percentage of Chilean Population in the United States is 0.055%.