Cities with the Highest Percentage of Chilean Population in Michigan

RELATED REPORTS & OPTIONS

Chilean
Population
Families and Households
Female Fertility
Female Fertility (Unmarried)
Race (Community Size)
Race (Percentage)
Ancestry (Community Size)
AfghanAfricanAlaska NativeAlaskan AthabascanAlbanianAleutAlsatianAmericanApacheArabArapahoArgentineanArmenianAssyrian / Chaldean / SyriacAustralianAustrianBahamianBangladeshiBarbadianBasqueBelgianBelizeanBermudanBhutaneseBlackfeetBolivianBrazilianBritishBritish West IndianBulgarianBurmeseCajunCambodianCanadianCape VerdeanCarpatho RusynCelticCentral AmericanCentral American IndianCherokeeCheyenneChickasawChileanChineseChippewaChoctawColombianColvilleComancheCosta RicanCreeCreekCroatianCrowCubanCypriotCzechCzechoslovakianDanishDelawareDominicanDutchDutch West IndianEastern EuropeanEcuadorianEgyptianEnglishEstonianEthiopianEuropeanFijianFilipinoFinnishFrenchFrench American IndianFrench CanadianGermanGerman RussianGhanaianGreekGuamanian / ChamorroGuatemalanGuyaneseHaitianHmongHonduranHopiHoumaHungarianIcelanderIndian (Asian)IndonesianInupiatIranianIraqiIrishIroquoisIsraeliItalianJamaicanJapaneseJordanianKenyanKiowaKoreanLaotianLatvianLebaneseLiberianLithuanianLumbeeLuxembourgerMacedonianMalaysianMalteseMarshalleseMenomineeMexicanMexican American IndianMongolianMoroccanNative HawaiianNavajoNepaleseNew ZealanderNicaraguanNigerianNorthern EuropeanNorwegianOkinawanOsageOttawaPaiutePakistaniPalestinianPanamanianParaguayanPennsylvania GermanPeruvianPimaPolishPortuguesePotawatomiPuebloPuerto RicanPuget Sound SalishRomanianRussianSalvadoranSamoanScandinavianScotch-IrishScottishSeminoleSenegaleseSerbianShoshoneSierra LeoneanSiouxSlavicSlovakSloveneSomaliSouth AfricanSouth AmericanSouth American IndianSoviet UnionSpaniardSpanishSpanish AmericanSpanish American IndianSri LankanSubsaharan AfricanSudaneseSwedishSwissSyrianTaiwaneseThaiTlingit-HaidaTohono O'OdhamTonganTrinidadian and TobagonianTsimshianTurkishU.S. Virgin IslanderUgandanUkrainianUruguayanUteVenezuelanVietnameseWelshWest IndianYakamaYaquiYugoslavianYumanYup'ikZimbabwean
Ancestry (Percentage)
AfghanAfricanAlaska NativeAlaskan AthabascanAlbanianAleutAlsatianAmericanApacheArabArapahoArgentineanArmenianAssyrian / Chaldean / SyriacAustralianAustrianBahamianBangladeshiBarbadianBasqueBelgianBelizeanBermudanBhutaneseBlackfeetBolivianBrazilianBritishBritish West IndianBulgarianBurmeseCajunCambodianCanadianCape VerdeanCarpatho RusynCelticCentral AmericanCentral American IndianCherokeeCheyenneChickasawChileanChineseChippewaChoctawColombianColvilleComancheCosta RicanCreeCreekCroatianCrowCubanCypriotCzechCzechoslovakianDanishDelawareDominicanDutchDutch West IndianEastern EuropeanEcuadorianEgyptianEnglishEstonianEthiopianEuropeanFijianFilipinoFinnishFrenchFrench American IndianFrench CanadianGermanGerman RussianGhanaianGreekGuamanian / ChamorroGuatemalanGuyaneseHaitianHmongHonduranHopiHoumaHungarianIcelanderIndian (Asian)IndonesianInupiatIranianIraqiIrishIroquoisIsraeliItalianJamaicanJapaneseJordanianKenyanKiowaKoreanLaotianLatvianLebaneseLiberianLithuanianLumbeeLuxembourgerMacedonianMalaysianMalteseMarshalleseMenomineeMexicanMexican American IndianMongolianMoroccanNative HawaiianNavajoNepaleseNew ZealanderNicaraguanNigerianNorthern EuropeanNorwegianOkinawanOsageOttawaPaiutePakistaniPalestinianPanamanianParaguayanPennsylvania GermanPeruvianPimaPolishPortuguesePotawatomiPuebloPuerto RicanPuget Sound SalishRomanianRussianSalvadoranSamoanScandinavianScotch-IrishScottishSeminoleSenegaleseSerbianShoshoneSierra LeoneanSiouxSlavicSlovakSloveneSomaliSouth AfricanSouth AmericanSouth American IndianSoviet UnionSpaniardSpanishSpanish AmericanSpanish American IndianSri LankanSubsaharan AfricanSudaneseSwedishSwissSyrianTaiwaneseThaiTlingit-HaidaTohono O'OdhamTonganTrinidadian and TobagonianTsimshianTurkishU.S. Virgin IslanderUgandanUkrainianUruguayanUteVenezuelanVietnameseWelshWest IndianYakamaYaquiYugoslavianYumanYup'ikZimbabwean
Immigrant Origin (Total)
AfghanistanAfricaAlbaniaArgentinaArmeniaAsiaAustraliaAustriaAzoresBahamasBangladeshBarbadosBelarusBelgiumBelizeBoliviaBosnia and HerzegovinaBrazilBulgariaBurma / MyanmarCabo VerdeCambodiaCameroonCanadaCaribbeanCentral AmericaChileChinaColombiaCongoCosta RicaCroatiaCubaCzechoslovakiaDenmarkDominicaDominican RepublicEastern AfricaEastern AsiaEastern EuropeEcuadorEgyptEl SalvadorEnglandEritreaEthiopiaEuropeFijiFranceGermanyGhanaGreeceGrenadaGuatemalaGuyanaHaitiHondurasHong KongHungaryIndiaIndonesiaIranIraqIrelandIsraelItalyJamaicaJapanJordanKazakhstanKenyaKoreaKuwaitLaosLatin AmericaLatviaLebanonLiberiaLithuaniaMalaysiaMexicoMicronesiaMiddle AfricaMoldovaMoroccoNepalNetherlandsNicaraguaNigeriaNorth MacedoniaNorthern AfricaNorthern EuropeNorwayOceaniaPakistanPanamaPeruPhilippinesPolandPortugalRomaniaRussiaSaudi ArabiaScotlandSenegalSerbiaSierra LeoneSingaporeSomaliaSouth AfricaSouth AmericaSouth Central AsiaSouth Eastern AsiaSouthern EuropeSpainSri LankaSt. Vincent and the GrenadinesSudanSwedenSwitzerlandSyriaTaiwanThailandTrinidad and TobagoTurkeyUgandaUkraineUruguayUzbekistanVenezuelaVietnamWest IndiesWestern AfricaWestern AsiaWestern EuropeYemenZaireZimbabwe
Immigrant Origin (Percentage)
AfghanistanAfricaAlbaniaArgentinaArmeniaAsiaAustraliaAustriaAzoresBahamasBangladeshBarbadosBelarusBelgiumBelizeBoliviaBosnia and HerzegovinaBrazilBulgariaBurma / MyanmarCabo VerdeCambodiaCameroonCanadaCaribbeanCentral AmericaChileChinaColombiaCongoCosta RicaCroatiaCubaCzechoslovakiaDenmarkDominicaDominican RepublicEastern AfricaEastern AsiaEastern EuropeEcuadorEgyptEl SalvadorEnglandEritreaEthiopiaEuropeFijiFranceGermanyGhanaGreeceGrenadaGuatemalaGuyanaHaitiHondurasHong KongHungaryIndiaIndonesiaIranIraqIrelandIsraelItalyJamaicaJapanJordanKazakhstanKenyaKoreaKuwaitLaosLatin AmericaLatviaLebanonLiberiaLithuaniaMalaysiaMexicoMicronesiaMiddle AfricaMoldovaMoroccoNepalNetherlandsNicaraguaNigeriaNorth MacedoniaNorthern AfricaNorthern EuropeNorwayOceaniaPakistanPanamaPeruPhilippinesPolandPortugalRomaniaRussiaSaudi ArabiaScotlandSenegalSerbiaSierra LeoneSingaporeSomaliaSouth AfricaSouth AmericaSouth Central AsiaSouth Eastern AsiaSouthern EuropeSpainSri LankaSt. Vincent and the GrenadinesSudanSwedenSwitzerlandSyriaTaiwanThailandTrinidad and TobagoTurkeyUgandaUkraineUruguayUzbekistanVenezuelaVietnamWest IndiesWestern AfricaWestern AsiaWestern EuropeYemenZaireZimbabwe
Income
Income (Families)
Income (Households)
Poverty
Poverty (Families)
Unemployment
Employment Occupations
Employment Industries
Employer Class
Commute Time
Commute Means
School Enrollment
Education by Degree Field
Occupancy
Finances
Physical Characteristics
Michigan
Compare Cities
Comparison Subject

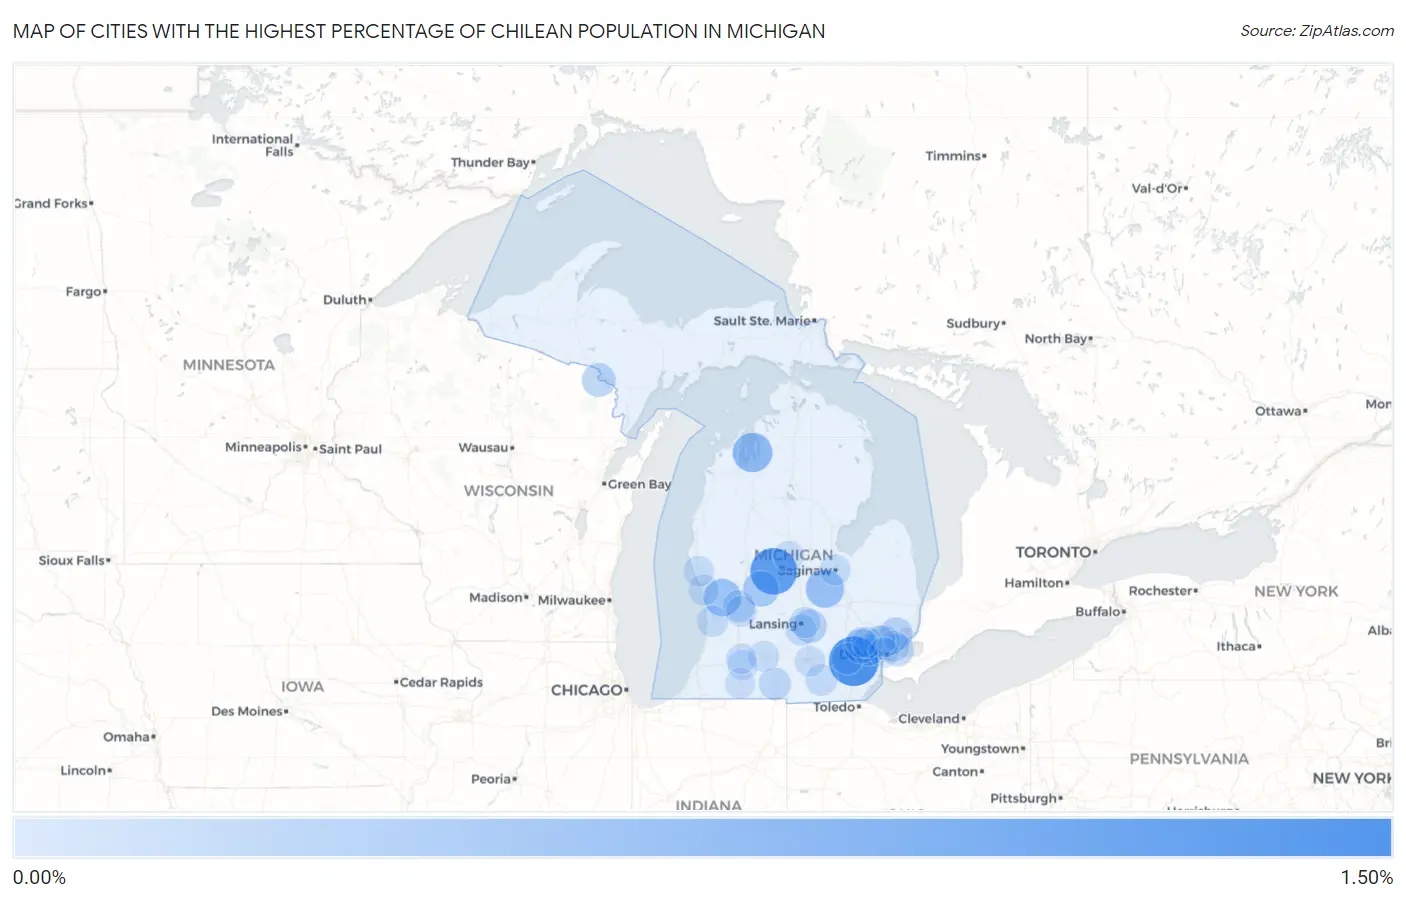
Map of Cities with the Highest Percentage of Chilean Population in Michigan

0.00%
1.50%
Cities with the Highest Percentage of Chilean Population in Michigan Map

Cities with the Highest Percentage of Chilean Population in Michigan

City Chilean vs State vs National
1.Ypsilanti1.20%0.017%(+1.18)#10.055%(+1.14)#115
2.Edmore1.02%0.017%(+1.00)#20.055%(+0.962)#149
3.Elk Rapids0.57%0.017%(+0.557)#30.055%(+0.519)#295
4.Chesaning0.49%0.017%(+0.473)#40.055%(+0.435)#348
5.Coopersville0.44%0.017%(+0.421)#50.055%(+0.382)#385
6.Greenville0.34%0.017%(+0.322)#60.055%(+0.283)#502
7.Northville0.26%0.017%(+0.246)#70.055%(+0.208)#624
8.Kingsford0.21%0.017%(+0.198)#80.055%(+0.159)#737
9.Okemos0.20%0.017%(+0.183)#90.055%(+0.144)#768
10.Mount Clemens0.17%0.017%(+0.156)#100.055%(+0.117)#855
11.Grosse Pointe Farms0.16%0.017%(+0.143)#110.055%(+0.105)#899
12.Coldwater0.13%0.017%(+0.115)#120.055%(+0.076)#1,000
13.Madison Heights0.13%0.017%(+0.110)#130.055%(+0.071)#1,030
14.Grand Rapids0.12%0.017%(+0.107)#140.055%(+0.069)#1,037
15.Onsted0.087%0.017%(+0.071)#150.055%(+0.032)#1,251
16.Livonia0.079%0.017%(+0.062)#160.055%(+0.024)#1,298
17.Ann Arbor0.076%0.017%(+0.060)#170.055%(+0.021)#1,317
18.Holland0.070%0.017%(+0.054)#180.055%(+0.015)#1,365
19.Holt0.067%0.017%(+0.050)#190.055%(+0.012)#1,390
20.Harper Woods0.065%0.017%(+0.049)#200.055%(+0.010)#1,406
21.East Lansing0.055%0.017%(+0.038)#210.055%(-0.000)#1,509
22.Kentwood0.054%0.017%(+0.037)#220.055%(-0.002)#1,523
23.Royal Oak0.053%0.017%(+0.037)#230.055%(-0.002)#1,526
24.Farmington Hills0.053%0.017%(+0.036)#240.055%(-0.003)#1,536
25.Saginaw0.052%0.017%(+0.035)#250.055%(-0.003)#1,545
26.Norton Shores0.048%0.017%(+0.031)#260.055%(-0.007)#1,581
27.Battle Creek0.042%0.017%(+0.025)#270.055%(-0.013)#1,633
28.Whitehall0.034%0.017%(+0.017)#280.055%(-0.021)#1,699
29.Mount Pleasant0.032%0.017%(+0.015)#290.055%(-0.023)#1,718
30.Jackson0.032%0.017%(+0.015)#300.055%(-0.023)#1,719
31.Three Rivers0.025%0.017%(+0.009)#310.055%(-0.030)#1,797
32.Portage0.020%0.017%(+0.004)#320.055%(-0.035)#1,850
33.Kalamazoo0.019%0.017%(+0.002)#330.055%(-0.036)#1,860
34.Novi0.017%0.017%(+0.000)#340.055%(-0.038)#1,882
35.Detroit0.0019%0.017%(-0.015)#350.055%(-0.053)#2,006

Common Questions

What are the Top 10 Cities with the Highest Percentage of Chilean Population in Michigan?
Top 10 Cities with the Highest Percentage of Chilean Population in Michigan are:
#1
1.20%
#2
1.02%
#3
0.57%
#4
0.49%
#5
0.44%
#6
0.34%
#7
0.26%
#8
0.21%
#9
0.20%
#10
0.17%
What city has the Highest Percentage of Chilean Population in Michigan?
Ypsilanti has the Highest Percentage of Chilean Population in Michigan with 1.20%.
What is the Percentage of Chilean Population in the State of Michigan?
Percentage of Chilean Population in Michigan is 0.017%.
What is the Percentage of Chilean Population in the United States?
Percentage of Chilean Population in the United States is 0.055%.