Cities with the Largest Serbian Community in Illinois
RELATED REPORTS & OPTIONS
Serbian
Illinois
Compare Cities
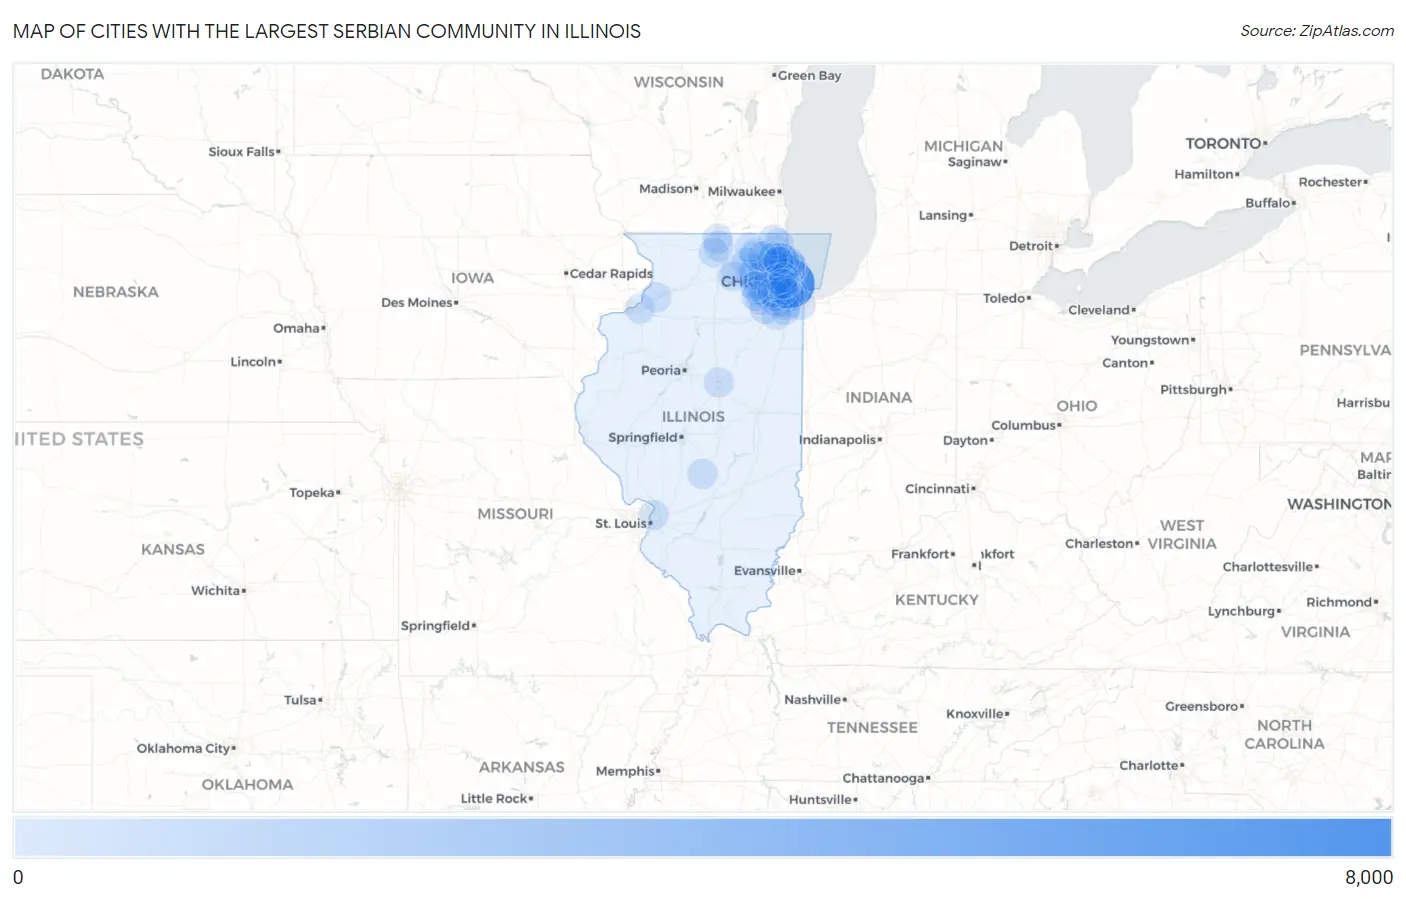
Map of Cities with the Largest Serbian Community in Illinois
0
8,000
Cities with the Largest Serbian Community in Illinois
| City | Serbian | vs State | vs National | |
| 1. | Chicago | 6,865 | 25,407(27.02%)#1 | 194,511(3.53%)#1 |
| 2. | Naperville | 626 | 25,407(2.46%)#2 | 194,511(0.32%)#20 |
| 3. | Downers Grove | 563 | 25,407(2.22%)#3 | 194,511(0.29%)#26 |
| 4. | Park Ridge | 483 | 25,407(1.90%)#4 | 194,511(0.25%)#30 |
| 5. | Brookfield | 480 | 25,407(1.89%)#5 | 194,511(0.25%)#31 |
| 6. | Carol Stream | 471 | 25,407(1.85%)#6 | 194,511(0.24%)#32 |
| 7. | Hoffman Estates | 462 | 25,407(1.82%)#7 | 194,511(0.24%)#34 |
| 8. | Addison | 410 | 25,407(1.61%)#8 | 194,511(0.21%)#46 |
| 9. | Des Plaines | 389 | 25,407(1.53%)#9 | 194,511(0.20%)#52 |
| 10. | Elgin | 365 | 25,407(1.44%)#10 | 194,511(0.19%)#59 |
| 11. | Mount Prospect | 302 | 25,407(1.19%)#11 | 194,511(0.16%)#75 |
| 12. | Lyons | 301 | 25,407(1.18%)#12 | 194,511(0.15%)#76 |
| 13. | Elk Grove Village | 297 | 25,407(1.17%)#13 | 194,511(0.15%)#77 |
| 14. | La Grange | 285 | 25,407(1.12%)#14 | 194,511(0.15%)#79 |
| 15. | Niles | 274 | 25,407(1.08%)#15 | 194,511(0.14%)#83 |
| 16. | Orland Park | 273 | 25,407(1.07%)#16 | 194,511(0.14%)#85 |
| 17. | Prospect Heights | 270 | 25,407(1.06%)#17 | 194,511(0.14%)#88 |
| 18. | Norridge | 256 | 25,407(1.01%)#18 | 194,511(0.13%)#97 |
| 19. | Loves Park | 250 | 25,407(0.98%)#19 | 194,511(0.13%)#101 |
| 20. | Skokie | 247 | 25,407(0.97%)#20 | 194,511(0.13%)#102 |
| 21. | Darien | 246 | 25,407(0.97%)#21 | 194,511(0.13%)#104 |
| 22. | Streamwood | 234 | 25,407(0.92%)#22 | 194,511(0.12%)#110 |
| 23. | Joliet | 233 | 25,407(0.92%)#23 | 194,511(0.12%)#111 |
| 24. | Bensenville | 216 | 25,407(0.85%)#24 | 194,511(0.11%)#118 |
| 25. | Lansing | 208 | 25,407(0.82%)#25 | 194,511(0.11%)#127 |
| 26. | Schaumburg | 206 | 25,407(0.81%)#26 | 194,511(0.11%)#129 |
| 27. | Burr Ridge | 205 | 25,407(0.81%)#27 | 194,511(0.11%)#131 |
| 28. | Arlington Heights | 197 | 25,407(0.78%)#28 | 194,511(0.10%)#143 |
| 29. | Wood Dale | 197 | 25,407(0.78%)#29 | 194,511(0.10%)#144 |
| 30. | Indian Head Park | 192 | 25,407(0.76%)#30 | 194,511(0.10%)#152 |
| 31. | Nokomis | 189 | 25,407(0.74%)#31 | 194,511(0.10%)#155 |
| 32. | Harwood Heights | 169 | 25,407(0.67%)#32 | 194,511(0.09%)#181 |
| 33. | Bolingbrook | 165 | 25,407(0.65%)#33 | 194,511(0.08%)#189 |
| 34. | Evanston | 164 | 25,407(0.65%)#34 | 194,511(0.08%)#190 |
| 35. | Aurora | 162 | 25,407(0.64%)#35 | 194,511(0.08%)#192 |
| 36. | Glenview | 160 | 25,407(0.63%)#36 | 194,511(0.08%)#194 |
| 37. | Westchester | 159 | 25,407(0.63%)#37 | 194,511(0.08%)#197 |
| 38. | Lincolnwood | 152 | 25,407(0.60%)#38 | 194,511(0.08%)#208 |
| 39. | Wheaton | 150 | 25,407(0.59%)#39 | 194,511(0.08%)#215 |
| 40. | Northbrook | 147 | 25,407(0.58%)#40 | 194,511(0.08%)#218 |
| 41. | Itasca | 133 | 25,407(0.52%)#41 | 194,511(0.07%)#243 |
| 42. | Countryside | 133 | 25,407(0.52%)#42 | 194,511(0.07%)#244 |
| 43. | Morton Grove | 129 | 25,407(0.51%)#43 | 194,511(0.07%)#254 |
| 44. | Libertyville | 129 | 25,407(0.51%)#44 | 194,511(0.07%)#255 |
| 45. | Plainfield | 122 | 25,407(0.48%)#45 | 194,511(0.06%)#270 |
| 46. | Tinley Park | 120 | 25,407(0.47%)#46 | 194,511(0.06%)#275 |
| 47. | Wilmette | 115 | 25,407(0.45%)#47 | 194,511(0.06%)#287 |
| 48. | Oak Park | 114 | 25,407(0.45%)#48 | 194,511(0.06%)#290 |
| 49. | Winnetka | 110 | 25,407(0.43%)#49 | 194,511(0.06%)#308 |
| 50. | Western Springs | 109 | 25,407(0.43%)#50 | 194,511(0.06%)#310 |
| 51. | Homer Glen | 106 | 25,407(0.42%)#51 | 194,511(0.05%)#316 |
| 52. | Evergreen Park | 105 | 25,407(0.41%)#52 | 194,511(0.05%)#322 |
| 53. | North Riverside | 103 | 25,407(0.41%)#53 | 194,511(0.05%)#330 |
| 54. | Palos Hills | 100 | 25,407(0.39%)#54 | 194,511(0.05%)#339 |
| 55. | Batavia | 96 | 25,407(0.38%)#55 | 194,511(0.05%)#349 |
| 56. | Lombard | 90 | 25,407(0.35%)#56 | 194,511(0.05%)#374 |
| 57. | Hinsdale | 83 | 25,407(0.33%)#57 | 194,511(0.04%)#409 |
| 58. | Rosemont | 77 | 25,407(0.30%)#58 | 194,511(0.04%)#438 |
| 59. | Roscoe | 76 | 25,407(0.30%)#59 | 194,511(0.04%)#444 |
| 60. | Sycamore | 75 | 25,407(0.30%)#60 | 194,511(0.04%)#453 |
| 61. | Bartlett | 74 | 25,407(0.29%)#61 | 194,511(0.04%)#458 |
| 62. | Palatine | 73 | 25,407(0.29%)#62 | 194,511(0.04%)#460 |
| 63. | Crystal Lake | 73 | 25,407(0.29%)#63 | 194,511(0.04%)#462 |
| 64. | Riverside | 72 | 25,407(0.28%)#64 | 194,511(0.04%)#469 |
| 65. | Rockford | 71 | 25,407(0.28%)#65 | 194,511(0.04%)#472 |
| 66. | Buffalo Grove | 69 | 25,407(0.27%)#66 | 194,511(0.04%)#492 |
| 67. | Granite City | 68 | 25,407(0.27%)#67 | 194,511(0.03%)#501 |
| 68. | Westmont | 68 | 25,407(0.27%)#68 | 194,511(0.03%)#502 |
| 69. | Bloomingdale | 68 | 25,407(0.27%)#69 | 194,511(0.03%)#503 |
| 70. | Lake In The Hills | 67 | 25,407(0.26%)#70 | 194,511(0.03%)#510 |
| 71. | Rolling Meadows | 67 | 25,407(0.26%)#71 | 194,511(0.03%)#511 |
| 72. | Gurnee | 66 | 25,407(0.26%)#72 | 194,511(0.03%)#519 |
| 73. | Deerfield | 66 | 25,407(0.26%)#73 | 194,511(0.03%)#520 |
| 74. | Alsip | 66 | 25,407(0.26%)#74 | 194,511(0.03%)#521 |
| 75. | Long Grove | 64 | 25,407(0.25%)#75 | 194,511(0.03%)#535 |
| 76. | Frankfort | 62 | 25,407(0.24%)#76 | 194,511(0.03%)#555 |
| 77. | Lemont | 61 | 25,407(0.24%)#77 | 194,511(0.03%)#565 |
| 78. | Campton Hills | 61 | 25,407(0.24%)#78 | 194,511(0.03%)#567 |
| 79. | Lindenhurst | 60 | 25,407(0.24%)#79 | 194,511(0.03%)#579 |
| 80. | Lockport Heights | 59 | 25,407(0.23%)#80 | 194,511(0.03%)#598 |
| 81. | Oswego | 58 | 25,407(0.23%)#81 | 194,511(0.03%)#601 |
| 82. | Riverwoods | 57 | 25,407(0.22%)#82 | 194,511(0.03%)#615 |
| 83. | Normal | 56 | 25,407(0.22%)#83 | 194,511(0.03%)#619 |
| 84. | Dekalb | 56 | 25,407(0.22%)#84 | 194,511(0.03%)#620 |
| 85. | Villa Park | 55 | 25,407(0.22%)#85 | 194,511(0.03%)#632 |
| 86. | Erie | 55 | 25,407(0.22%)#86 | 194,511(0.03%)#634 |
| 87. | Woodridge | 52 | 25,407(0.20%)#87 | 194,511(0.03%)#666 |
| 88. | Elmhurst | 51 | 25,407(0.20%)#88 | 194,511(0.03%)#677 |
| 89. | Hampshire | 50 | 25,407(0.20%)#89 | 194,511(0.03%)#692 |
| 90. | River Grove | 49 | 25,407(0.19%)#90 | 194,511(0.03%)#706 |
| 91. | Kildeer | 49 | 25,407(0.19%)#91 | 194,511(0.03%)#709 |
| 92. | Justice | 48 | 25,407(0.19%)#92 | 194,511(0.02%)#721 |
| 93. | North Aurora | 47 | 25,407(0.18%)#93 | 194,511(0.02%)#736 |
| 94. | Manhattan | 43 | 25,407(0.17%)#94 | 194,511(0.02%)#793 |
| 95. | Oak Lawn | 42 | 25,407(0.17%)#95 | 194,511(0.02%)#804 |
| 96. | East Moline | 41 | 25,407(0.16%)#96 | 194,511(0.02%)#831 |
| 97. | Woodstock | 40 | 25,407(0.16%)#97 | 194,511(0.02%)#848 |
| 98. | Fox River Grove | 40 | 25,407(0.16%)#98 | 194,511(0.02%)#857 |
| 99. | Wheeling | 39 | 25,407(0.15%)#99 | 194,511(0.02%)#861 |
| 100. | La Grange Park | 39 | 25,407(0.15%)#100 | 194,511(0.02%)#865 |
Common Questions
What are the Top 10 Cities with the Largest Serbian Community in Illinois?
Top 10 Cities with the Largest Serbian Community in Illinois are:
#1
6,865
#2
626
#3
563
#4
483
#5
480
#6
471
#7
462
#8
410
#9
389
#10
365
What city has the Largest Serbian Community in Illinois?
Chicago has the Largest Serbian Community in Illinois with 6,865.
What is the Total Serbian Population in the State of Illinois?
Total Serbian Population in Illinois is 25,407.
What is the Total Serbian Population in the United States?
Total Serbian Population in the United States is 194,511.