Cities with the Highest Male Poverty Level in Utah
RELATED REPORTS & OPTIONS
Highest Poverty | Male
Utah
Compare Cities
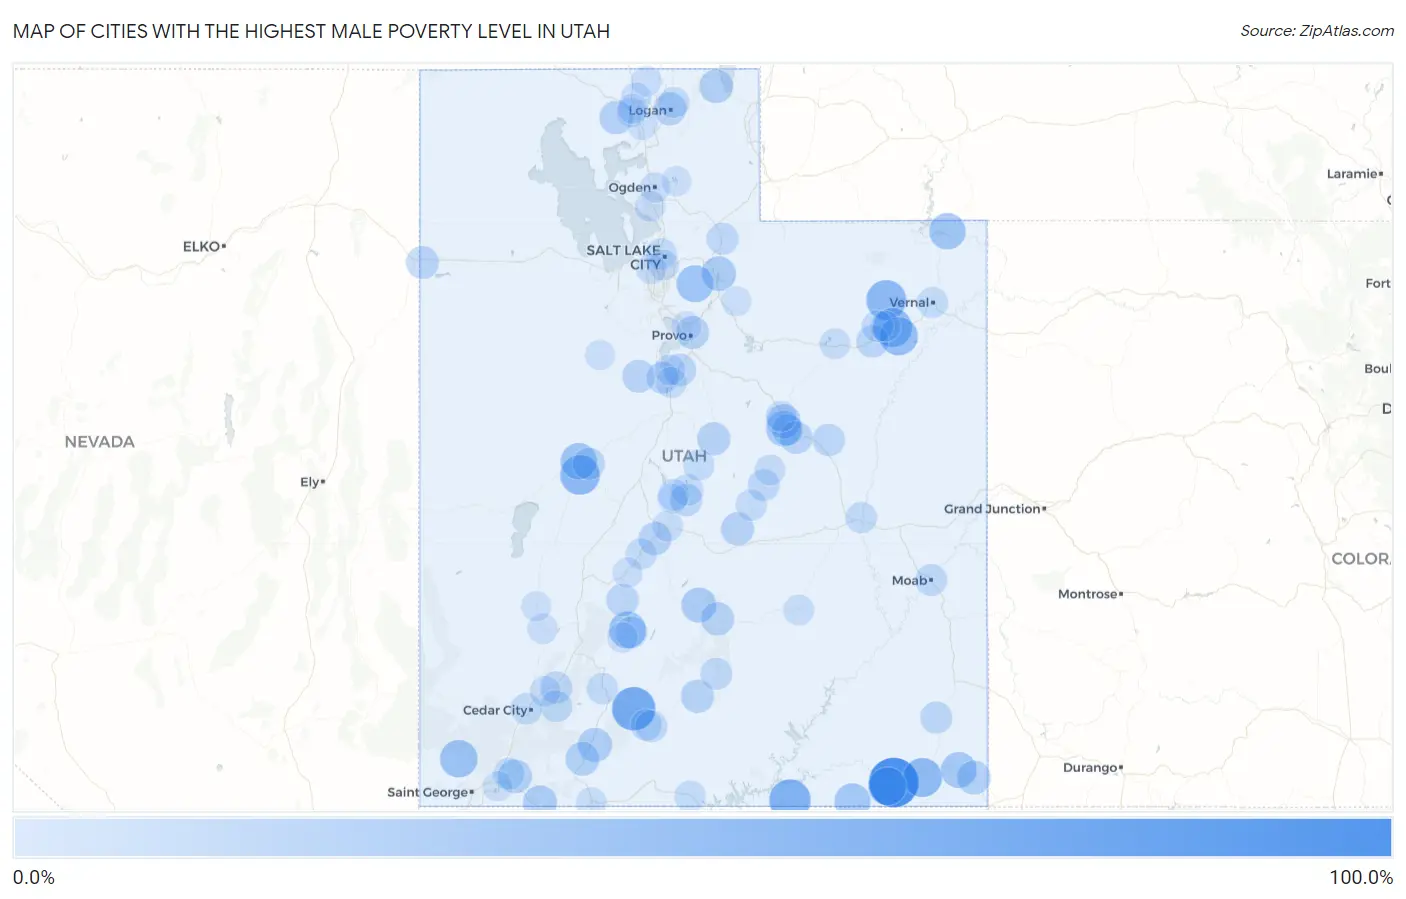
Map of Cities with the Highest Male Poverty Level in Utah
0.0%
100.0%
Cities with the Highest Male Poverty Level in Utah
| City | Male Poverty | vs State | vs National | |
| 1. | Mexican Hat | 100.0% | 7.7%(+92.3)#1 | 11.3%(+88.7)#93 |
| 2. | Bryce Canyon City | 70.4% | 7.7%(+62.7)#2 | 11.3%(+59.0)#309 |
| 3. | Navajo Mountain | 61.4% | 7.7%(+53.7)#3 | 11.3%(+50.1)#464 |
| 4. | Whiterocks | 53.6% | 7.7%(+45.9)#4 | 11.3%(+42.3)#711 |
| 5. | Oasis | 52.6% | 7.7%(+44.9)#5 | 11.3%(+41.3)#751 |
| 6. | Fort Duchesne | 50.5% | 7.7%(+42.8)#6 | 11.3%(+39.2)#845 |
| 7. | Tselakai Dezza | 50.0% | 7.7%(+42.3)#7 | 11.3%(+38.7)#872 |
| 8. | Randlett | 45.7% | 7.7%(+38.0)#8 | 11.3%(+34.4)#1,121 |
| 9. | Halchita | 45.5% | 7.7%(+37.7)#9 | 11.3%(+34.1)#1,131 |
| 10. | Veyo | 42.8% | 7.7%(+35.1)#10 | 11.3%(+31.4)#1,315 |
| 11. | Junction | 40.3% | 7.7%(+32.6)#11 | 11.3%(+29.0)#1,551 |
| 12. | Alta | 39.6% | 7.7%(+31.9)#12 | 11.3%(+28.3)#1,607 |
| 13. | Sutherland | 38.4% | 7.7%(+30.6)#13 | 11.3%(+27.0)#1,752 |
| 14. | Dutch John | 37.5% | 7.7%(+29.8)#14 | 11.3%(+26.2)#1,848 |
| 15. | Oljato Monument Valley | 35.3% | 7.7%(+27.6)#15 | 11.3%(+24.0)#2,106 |
| 16. | Montezuma Creek | 34.9% | 7.7%(+27.2)#16 | 11.3%(+23.5)#2,169 |
| 17. | Sundance | 33.3% | 7.7%(+25.6)#17 | 11.3%(+22.0)#2,395 |
| 18. | West Wood | 33.1% | 7.7%(+25.4)#18 | 11.3%(+21.8)#2,419 |
| 19. | Lyman | 31.0% | 7.7%(+23.3)#19 | 11.3%(+19.7)#2,789 |
| 20. | Hideout | 30.1% | 7.7%(+22.4)#20 | 11.3%(+18.8)#2,943 |
| 21. | Alton | 27.6% | 7.7%(+19.9)#21 | 11.3%(+16.3)#3,541 |
| 22. | Spring Glen | 27.4% | 7.7%(+19.7)#22 | 11.3%(+16.1)#3,585 |
| 23. | Hildale | 27.3% | 7.7%(+19.6)#23 | 11.3%(+16.0)#3,618 |
| 24. | Glendale | 26.7% | 7.7%(+19.0)#24 | 11.3%(+15.3)#3,787 |
| 25. | Aneth | 26.5% | 7.7%(+18.7)#25 | 11.3%(+15.1)#3,848 |
| 26. | Garden | 26.1% | 7.7%(+18.4)#26 | 11.3%(+14.7)#3,972 |
| 27. | Virgin | 25.6% | 7.7%(+17.9)#27 | 11.3%(+14.3)#4,096 |
| 28. | Thatcher | 24.7% | 7.7%(+17.0)#28 | 11.3%(+13.3)#4,447 |
| 29. | Torrey | 23.8% | 7.7%(+16.1)#29 | 11.3%(+12.5)#4,771 |
| 30. | Escalante | 23.6% | 7.7%(+15.9)#30 | 11.3%(+12.3)#4,858 |
| 31. | Emery | 23.0% | 7.7%(+15.3)#31 | 11.3%(+11.7)#5,070 |
| 32. | Sigurd | 22.7% | 7.7%(+15.0)#32 | 11.3%(+11.4)#5,195 |
| 33. | Mount Pleasant | 22.7% | 7.7%(+15.0)#33 | 11.3%(+11.4)#5,218 |
| 34. | Logan | 22.7% | 7.7%(+14.9)#34 | 11.3%(+11.3)#5,239 |
| 35. | Provo | 22.5% | 7.7%(+14.8)#35 | 11.3%(+11.2)#5,308 |
| 36. | Eureka | 21.8% | 7.7%(+14.1)#36 | 11.3%(+10.5)#5,645 |
| 37. | Wendover | 21.7% | 7.7%(+14.0)#37 | 11.3%(+10.4)#5,699 |
| 38. | Wellington | 21.5% | 7.7%(+13.8)#38 | 11.3%(+10.2)#5,786 |
| 39. | Myton | 20.7% | 7.7%(+13.0)#39 | 11.3%(+9.35)#6,169 |
| 40. | Spring Lake | 20.3% | 7.7%(+12.5)#40 | 11.3%(+8.92)#6,388 |
| 41. | Marysvale | 19.8% | 7.7%(+12.1)#41 | 11.3%(+8.48)#6,612 |
| 42. | East Carbon | 19.5% | 7.7%(+11.8)#42 | 11.3%(+8.16)#6,802 |
| 43. | Mayfield | 19.2% | 7.7%(+11.5)#43 | 11.3%(+7.87)#6,969 |
| 44. | Goshen | 18.8% | 7.7%(+11.0)#44 | 11.3%(+7.41)#7,237 |
| 45. | Parowan | 18.6% | 7.7%(+10.9)#45 | 11.3%(+7.24)#7,364 |
| 46. | Delta | 18.2% | 7.7%(+10.5)#46 | 11.3%(+6.89)#7,569 |
| 47. | Blanding | 18.1% | 7.7%(+10.4)#47 | 11.3%(+6.76)#7,661 |
| 48. | Boulder | 17.9% | 7.7%(+10.2)#48 | 11.3%(+6.54)#7,814 |
| 49. | Moab | 17.8% | 7.7%(+10.1)#49 | 11.3%(+6.46)#7,882 |
| 50. | Hoytsville | 17.7% | 7.7%(+10.0)#50 | 11.3%(+6.41)#7,914 |
| 51. | Henrieville | 17.7% | 7.7%(+10.00)#51 | 11.3%(+6.37)#7,946 |
| 52. | Castle Dale | 17.7% | 7.7%(+9.97)#52 | 11.3%(+6.35)#7,960 |
| 53. | Kingston | 17.1% | 7.7%(+9.37)#53 | 11.3%(+5.74)#8,373 |
| 54. | Brian Head | 16.7% | 7.7%(+8.95)#54 | 11.3%(+5.33)#8,652 |
| 55. | Roosevelt | 16.2% | 7.7%(+8.53)#55 | 11.3%(+4.90)#8,947 |
| 56. | Sterling | 16.0% | 7.7%(+8.30)#56 | 11.3%(+4.68)#9,118 |
| 57. | Gunnison | 15.9% | 7.7%(+8.23)#57 | 11.3%(+4.60)#9,172 |
| 58. | La Verkin | 15.6% | 7.7%(+7.86)#58 | 11.3%(+4.23)#9,471 |
| 59. | Cannonville | 15.4% | 7.7%(+7.73)#59 | 11.3%(+4.10)#9,584 |
| 60. | Price | 15.4% | 7.7%(+7.72)#60 | 11.3%(+4.09)#9,592 |
| 61. | Panguitch | 15.3% | 7.7%(+7.60)#61 | 11.3%(+3.98)#9,669 |
| 62. | Cedar City | 15.3% | 7.7%(+7.54)#62 | 11.3%(+3.92)#9,711 |
| 63. | Green River | 14.9% | 7.7%(+7.20)#63 | 11.3%(+3.58)#9,967 |
| 64. | Ferron | 14.6% | 7.7%(+6.84)#64 | 11.3%(+3.21)#10,271 |
| 65. | Ephraim | 14.5% | 7.7%(+6.76)#65 | 11.3%(+3.13)#10,339 |
| 66. | Big Water | 14.3% | 7.7%(+6.64)#66 | 11.3%(+3.01)#10,435 |
| 67. | Vernal | 14.1% | 7.7%(+6.42)#67 | 11.3%(+2.79)#10,651 |
| 68. | Richfield | 13.7% | 7.7%(+5.95)#68 | 11.3%(+2.32)#11,043 |
| 69. | North Logan | 13.5% | 7.7%(+5.77)#69 | 11.3%(+2.14)#11,223 |
| 70. | Hobble Creek | 13.5% | 7.7%(+5.75)#70 | 11.3%(+2.12)#11,241 |
| 71. | Salt Lake City | 13.4% | 7.7%(+5.73)#71 | 11.3%(+2.10)#11,264 |
| 72. | Summit | 13.3% | 7.7%(+5.57)#72 | 11.3%(+1.94)#11,420 |
| 73. | Rocky Ridge | 13.2% | 7.7%(+5.50)#73 | 11.3%(+1.88)#11,484 |
| 74. | Helper | 13.0% | 7.7%(+5.31)#74 | 11.3%(+1.68)#11,673 |
| 75. | Duchesne | 12.8% | 7.7%(+5.13)#75 | 11.3%(+1.50)#11,881 |
| 76. | Huntington | 12.7% | 7.7%(+4.94)#76 | 11.3%(+1.31)#12,049 |
| 77. | Genola | 12.6% | 7.7%(+4.86)#77 | 11.3%(+1.23)#12,125 |
| 78. | Salina | 12.3% | 7.7%(+4.59)#78 | 11.3%(+0.960)#12,404 |
| 79. | Hanksville | 12.2% | 7.7%(+4.46)#79 | 11.3%(+0.832)#12,528 |
| 80. | South Salt Lake | 12.1% | 7.7%(+4.38)#80 | 11.3%(+0.754)#12,617 |
| 81. | Kanab | 11.9% | 7.7%(+4.16)#81 | 11.3%(+0.533)#12,865 |
| 82. | Clearfield | 11.3% | 7.7%(+3.57)#82 | 11.3%(-0.052)#13,534 |
| 83. | Clarkston | 11.1% | 7.7%(+3.43)#83 | 11.3%(-0.201)#13,697 |
| 84. | Ogden | 10.9% | 7.7%(+3.21)#84 | 11.3%(-0.417)#13,948 |
| 85. | Minersville | 10.9% | 7.7%(+3.19)#85 | 11.3%(-0.437)#13,973 |
| 86. | Ballard | 10.9% | 7.7%(+3.15)#86 | 11.3%(-0.477)#14,039 |
| 87. | Circleville | 10.7% | 7.7%(+3.00)#87 | 11.3%(-0.627)#14,187 |
| 88. | Riverside | 10.6% | 7.7%(+2.86)#88 | 11.3%(-0.763)#14,328 |
| 89. | West Valley City | 10.5% | 7.7%(+2.81)#89 | 11.3%(-0.817)#14,396 |
| 90. | Joseph | 10.4% | 7.7%(+2.71)#90 | 11.3%(-0.919)#14,504 |
| 91. | Honeyville | 10.2% | 7.7%(+2.45)#91 | 11.3%(-1.17)#14,794 |
| 92. | Milford | 10.1% | 7.7%(+2.41)#92 | 11.3%(-1.22)#14,854 |
| 93. | Tremonton | 10.0% | 7.7%(+2.32)#93 | 11.3%(-1.30)#14,952 |
| 94. | Huntsville | 9.9% | 7.7%(+2.17)#94 | 11.3%(-1.46)#15,131 |
| 95. | Centerfield | 9.8% | 7.7%(+2.12)#95 | 11.3%(-1.51)#15,192 |
| 96. | Timber Lakes | 9.8% | 7.7%(+2.08)#96 | 11.3%(-1.55)#15,249 |
| 97. | Vernon | 9.8% | 7.7%(+2.04)#97 | 11.3%(-1.59)#15,286 |
| 98. | Hurricane | 9.7% | 7.7%(+2.02)#98 | 11.3%(-1.60)#15,312 |
| 99. | Orem | 9.7% | 7.7%(+1.96)#99 | 11.3%(-1.66)#15,361 |
| 100. | Garland | 9.6% | 7.7%(+1.89)#100 | 11.3%(-1.74)#15,445 |
Common Questions
What are the Top 10 Cities with the Highest Male Poverty Level in Utah?
Top 10 Cities with the Highest Male Poverty Level in Utah are:
#1
100.0%
#2
70.4%
#3
61.4%
#4
53.6%
#5
52.6%
#6
50.5%
#7
50.0%
#8
45.7%
#9
45.5%
#10
42.8%
What city has the Highest Male Poverty Level in Utah?
Mexican Hat has the Highest Male Poverty Level in Utah with 100.0%.
What is the Poverty Level Among Males in the State of Utah?
Poverty Level Among Males in Utah is 7.7%.
What is the Poverty Level Among Males in the United States?
Poverty Level Among Males in the United States is 11.3%.