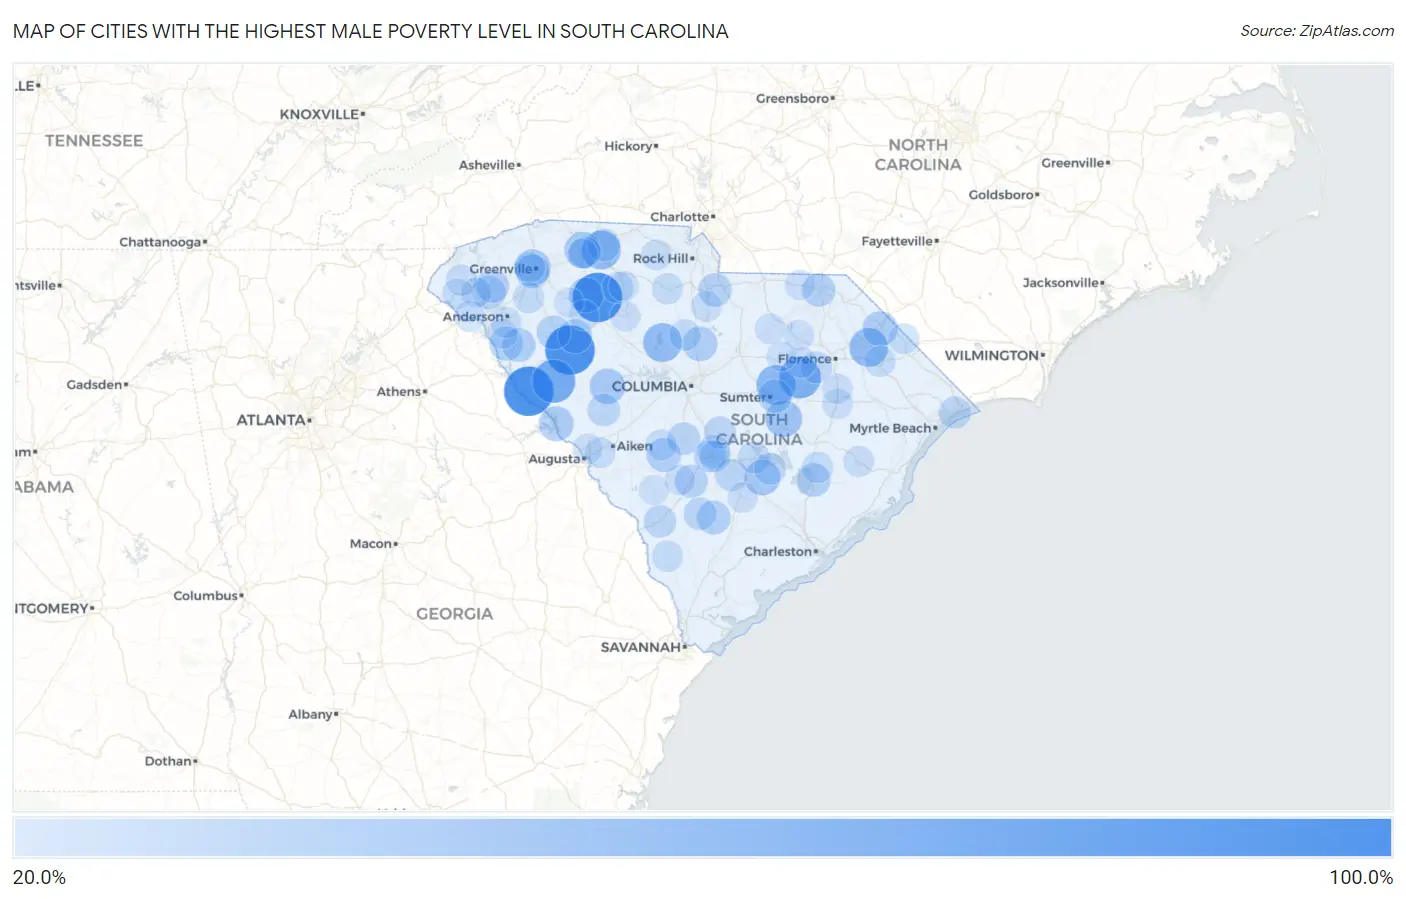
Cities with the Highest Male Poverty Level in South Carolina
RELATED REPORTS & OPTIONS
Highest Poverty | Male
South Carolina
Compare Cities
Map of Cities with the Highest Male Poverty Level in South Carolina
0.0%
100.0%
Cities with the Highest Male Poverty Level in South Carolina
| City | Male Poverty | vs State | vs National | |
| 1. | Clemson University | 100.0% | 13.0%(+87.0)#1 | 11.3%(+88.7)#1 |
| 2. | Willington | 100.0% | 13.0%(+87.0)#2 | 11.3%(+88.7)#43 |
| 3. | Coronaca | 100.0% | 13.0%(+87.0)#3 | 11.3%(+88.7)#79 |
| 4. | Cross Anchor | 100.0% | 13.0%(+87.0)#4 | 11.3%(+88.7)#90 |
| 5. | Olympia | 77.0% | 13.0%(+64.0)#5 | 11.3%(+65.6)#222 |
| 6. | Bradley | 75.2% | 13.0%(+62.2)#6 | 11.3%(+63.9)#240 |
| 7. | Lynchburg | 70.4% | 13.0%(+57.4)#7 | 11.3%(+59.1)#307 |
| 8. | Arthurtown | 65.1% | 13.0%(+52.1)#8 | 11.3%(+53.8)#388 |
| 9. | Oswego | 62.7% | 13.0%(+49.6)#9 | 11.3%(+51.3)#428 |
| 10. | Clifton | 59.5% | 13.0%(+46.5)#10 | 11.3%(+48.2)#519 |
| 11. | Jenkinsville | 58.8% | 13.0%(+45.8)#11 | 11.3%(+47.5)#544 |
| 12. | Sellers | 58.5% | 13.0%(+45.5)#12 | 11.3%(+47.2)#552 |
| 13. | Daviston | 56.0% | 13.0%(+43.0)#13 | 11.3%(+44.7)#625 |
| 14. | Little Rock | 54.8% | 13.0%(+41.8)#14 | 11.3%(+43.5)#673 |
| 15. | Zion | 52.9% | 13.0%(+39.9)#15 | 11.3%(+41.6)#736 |
| 16. | Alcolu | 51.3% | 13.0%(+38.3)#16 | 11.3%(+40.0)#803 |
| 17. | City View | 49.6% | 13.0%(+36.6)#17 | 11.3%(+38.3)#901 |
| 18. | Southern Shops | 49.0% | 13.0%(+36.0)#18 | 11.3%(+37.7)#926 |
| 19. | Holly Hill | 47.7% | 13.0%(+34.6)#19 | 11.3%(+36.3)#999 |
| 20. | Saluda | 46.6% | 13.0%(+33.6)#20 | 11.3%(+35.3)#1,061 |
| 21. | Cash | 46.4% | 13.0%(+33.4)#21 | 11.3%(+35.1)#1,079 |
| 22. | Dillon | 44.7% | 13.0%(+31.7)#22 | 11.3%(+33.4)#1,167 |
| 23. | Enoree | 44.7% | 13.0%(+31.6)#23 | 11.3%(+33.3)#1,177 |
| 24. | Modoc | 44.1% | 13.0%(+31.0)#24 | 11.3%(+32.7)#1,216 |
| 25. | Ridgeway | 43.5% | 13.0%(+30.5)#25 | 11.3%(+32.2)#1,249 |
| 26. | Waterloo | 41.7% | 13.0%(+28.6)#26 | 11.3%(+30.3)#1,403 |
| 27. | Springfield | 41.2% | 13.0%(+28.2)#27 | 11.3%(+29.9)#1,446 |
| 28. | Iva | 41.1% | 13.0%(+28.0)#28 | 11.3%(+29.7)#1,470 |
| 29. | Centenary | 41.0% | 13.0%(+28.0)#29 | 11.3%(+29.7)#1,471 |
| 30. | Ware Shoals | 40.9% | 13.0%(+27.9)#30 | 11.3%(+29.6)#1,484 |
| 31. | Williams | 40.8% | 13.0%(+27.7)#31 | 11.3%(+29.4)#1,503 |
| 32. | Judson | 40.7% | 13.0%(+27.7)#32 | 11.3%(+29.4)#1,511 |
| 33. | Antreville | 40.2% | 13.0%(+27.1)#33 | 11.3%(+28.8)#1,557 |
| 34. | Irwin | 39.8% | 13.0%(+26.7)#34 | 11.3%(+28.4)#1,595 |
| 35. | Clemson | 39.6% | 13.0%(+26.6)#35 | 11.3%(+28.3)#1,608 |
| 36. | Bonneau | 39.2% | 13.0%(+26.1)#36 | 11.3%(+27.8)#1,649 |
| 37. | East Sumter | 39.2% | 13.0%(+26.1)#37 | 11.3%(+27.8)#1,652 |
| 38. | Lobeco | 39.1% | 13.0%(+26.0)#38 | 11.3%(+27.7)#1,664 |
| 39. | Dovesville | 39.0% | 13.0%(+25.9)#39 | 11.3%(+27.6)#1,673 |
| 40. | Cheraw | 38.8% | 13.0%(+25.7)#40 | 11.3%(+27.4)#1,697 |
| 41. | Central | 38.2% | 13.0%(+25.1)#41 | 11.3%(+26.8)#1,765 |
| 42. | Bamberg | 37.8% | 13.0%(+24.8)#42 | 11.3%(+26.5)#1,802 |
| 43. | Drayton | 37.0% | 13.0%(+24.0)#43 | 11.3%(+25.7)#1,903 |
| 44. | North | 37.0% | 13.0%(+24.0)#44 | 11.3%(+25.7)#1,906 |
| 45. | Cowpens | 36.3% | 13.0%(+23.3)#45 | 11.3%(+25.0)#1,986 |
| 46. | Allendale | 36.3% | 13.0%(+23.2)#46 | 11.3%(+24.9)#1,994 |
| 47. | Johnston | 36.1% | 13.0%(+23.1)#47 | 11.3%(+24.8)#2,010 |
| 48. | Lodge | 36.0% | 13.0%(+23.0)#48 | 11.3%(+24.7)#2,025 |
| 49. | Brookdale | 35.9% | 13.0%(+22.8)#49 | 11.3%(+24.5)#2,043 |
| 50. | Homewood | 35.6% | 13.0%(+22.5)#50 | 11.3%(+24.2)#2,075 |
| 51. | Orangeburg | 35.4% | 13.0%(+22.3)#51 | 11.3%(+24.0)#2,100 |
| 52. | Bowman | 35.3% | 13.0%(+22.3)#52 | 11.3%(+24.0)#2,108 |
| 53. | Atlantic Beach | 34.7% | 13.0%(+21.7)#53 | 11.3%(+23.4)#2,192 |
| 54. | St Matthews | 34.6% | 13.0%(+21.6)#54 | 11.3%(+23.3)#2,208 |
| 55. | Saxon | 34.0% | 13.0%(+20.9)#55 | 11.3%(+22.6)#2,293 |
| 56. | Santee | 33.8% | 13.0%(+20.7)#56 | 11.3%(+22.4)#2,313 |
| 57. | Unity | 33.8% | 13.0%(+20.7)#57 | 11.3%(+22.4)#2,319 |
| 58. | Timmonsville | 33.4% | 13.0%(+20.4)#58 | 11.3%(+22.1)#2,361 |
| 59. | Eutawville | 33.2% | 13.0%(+20.1)#59 | 11.3%(+21.8)#2,416 |
| 60. | Wilkinson Heights | 32.1% | 13.0%(+19.0)#60 | 11.3%(+20.7)#2,587 |
| 61. | Pelzer | 31.8% | 13.0%(+18.8)#61 | 11.3%(+20.5)#2,636 |
| 62. | St Stephen | 31.7% | 13.0%(+18.7)#62 | 11.3%(+20.4)#2,661 |
| 63. | Winnsboro | 31.7% | 13.0%(+18.7)#63 | 11.3%(+20.4)#2,665 |
| 64. | Buffalo | 31.4% | 13.0%(+18.4)#64 | 11.3%(+20.1)#2,713 |
| 65. | Gayle Mill | 31.2% | 13.0%(+18.2)#65 | 11.3%(+19.9)#2,745 |
| 66. | Estill | 31.2% | 13.0%(+18.2)#66 | 11.3%(+19.9)#2,750 |
| 67. | Manville | 31.0% | 13.0%(+17.9)#67 | 11.3%(+19.6)#2,793 |
| 68. | Marion | 30.9% | 13.0%(+17.9)#68 | 11.3%(+19.6)#2,801 |
| 69. | Lake View | 30.7% | 13.0%(+17.7)#69 | 11.3%(+19.4)#2,844 |
| 70. | Fair Play | 30.6% | 13.0%(+17.5)#70 | 11.3%(+19.2)#2,862 |
| 71. | Hamer | 30.5% | 13.0%(+17.5)#71 | 11.3%(+19.2)#2,870 |
| 72. | Salley | 30.5% | 13.0%(+17.4)#72 | 11.3%(+19.1)#2,873 |
| 73. | Walhalla | 30.2% | 13.0%(+17.2)#73 | 11.3%(+18.9)#2,937 |
| 74. | Westminster | 30.1% | 13.0%(+17.1)#74 | 11.3%(+18.8)#2,947 |
| 75. | Langley | 30.0% | 13.0%(+17.0)#75 | 11.3%(+18.7)#2,970 |
| 76. | Homeland Park | 30.0% | 13.0%(+16.9)#76 | 11.3%(+18.6)#2,992 |
| 77. | Great Falls | 29.9% | 13.0%(+16.8)#77 | 11.3%(+18.5)#3,008 |
| 78. | Sharon | 29.6% | 13.0%(+16.5)#78 | 11.3%(+18.2)#3,066 |
| 79. | Andrews | 29.5% | 13.0%(+16.5)#79 | 11.3%(+18.2)#3,088 |
| 80. | Dunbar | 29.2% | 13.0%(+16.2)#80 | 11.3%(+17.9)#3,153 |
| 81. | Denmark | 29.0% | 13.0%(+16.0)#81 | 11.3%(+17.7)#3,197 |
| 82. | Floydale | 28.9% | 13.0%(+15.9)#82 | 11.3%(+17.6)#3,228 |
| 83. | Lake City | 28.9% | 13.0%(+15.9)#83 | 11.3%(+17.6)#3,229 |
| 84. | Bethune | 28.9% | 13.0%(+15.8)#84 | 11.3%(+17.5)#3,235 |
| 85. | St George | 28.6% | 13.0%(+15.6)#85 | 11.3%(+17.2)#3,295 |
| 86. | Hartsville | 28.6% | 13.0%(+15.5)#86 | 11.3%(+17.2)#3,297 |
| 87. | Coward | 28.6% | 13.0%(+15.5)#87 | 11.3%(+17.2)#3,302 |
| 88. | Chesterfield | 28.5% | 13.0%(+15.4)#88 | 11.3%(+17.1)#3,334 |
| 89. | Lamar | 28.4% | 13.0%(+15.3)#89 | 11.3%(+17.0)#3,360 |
| 90. | Whitmire | 28.3% | 13.0%(+15.3)#90 | 11.3%(+17.0)#3,367 |
| 91. | Starr | 28.1% | 13.0%(+15.0)#91 | 11.3%(+16.7)#3,422 |
| 92. | Utica | 27.9% | 13.0%(+14.9)#92 | 11.3%(+16.6)#3,459 |
| 93. | Union | 27.9% | 13.0%(+14.9)#93 | 11.3%(+16.6)#3,467 |
| 94. | Belvedere | 27.9% | 13.0%(+14.8)#94 | 11.3%(+16.5)#3,473 |
| 95. | Barnwell | 27.8% | 13.0%(+14.8)#95 | 11.3%(+16.5)#3,483 |
| 96. | Parker | 27.8% | 13.0%(+14.7)#96 | 11.3%(+16.4)#3,502 |
| 97. | Watts Mills | 27.7% | 13.0%(+14.7)#97 | 11.3%(+16.4)#3,523 |
| 98. | Bishopville | 27.6% | 13.0%(+14.5)#98 | 11.3%(+16.2)#3,555 |
| 99. | Gray Court | 27.4% | 13.0%(+14.3)#99 | 11.3%(+16.0)#3,595 |
| 100. | Arcadia | 27.3% | 13.0%(+14.2)#100 | 11.3%(+15.9)#3,639 |
Common Questions
What are the Top 10 Cities with the Highest Male Poverty Level in South Carolina?
Top 10 Cities with the Highest Male Poverty Level in South Carolina are:
#1
100.0%
#2
100.0%
#3
100.0%
#4
75.2%
#5
70.4%
#6
62.7%
#7
59.5%
#8
58.8%
#9
58.5%
#10
51.3%
What city has the Highest Male Poverty Level in South Carolina?
Willington has the Highest Male Poverty Level in South Carolina with 100.0%.
What is the Poverty Level Among Males in the State of South Carolina?
Poverty Level Among Males in South Carolina is 13.0%.
What is the Poverty Level Among Males in the United States?
Poverty Level Among Males in the United States is 11.3%.