Cities with the Highest Male Poverty Level in Maryland
RELATED REPORTS & OPTIONS
Highest Poverty | Male
Maryland
Compare Cities
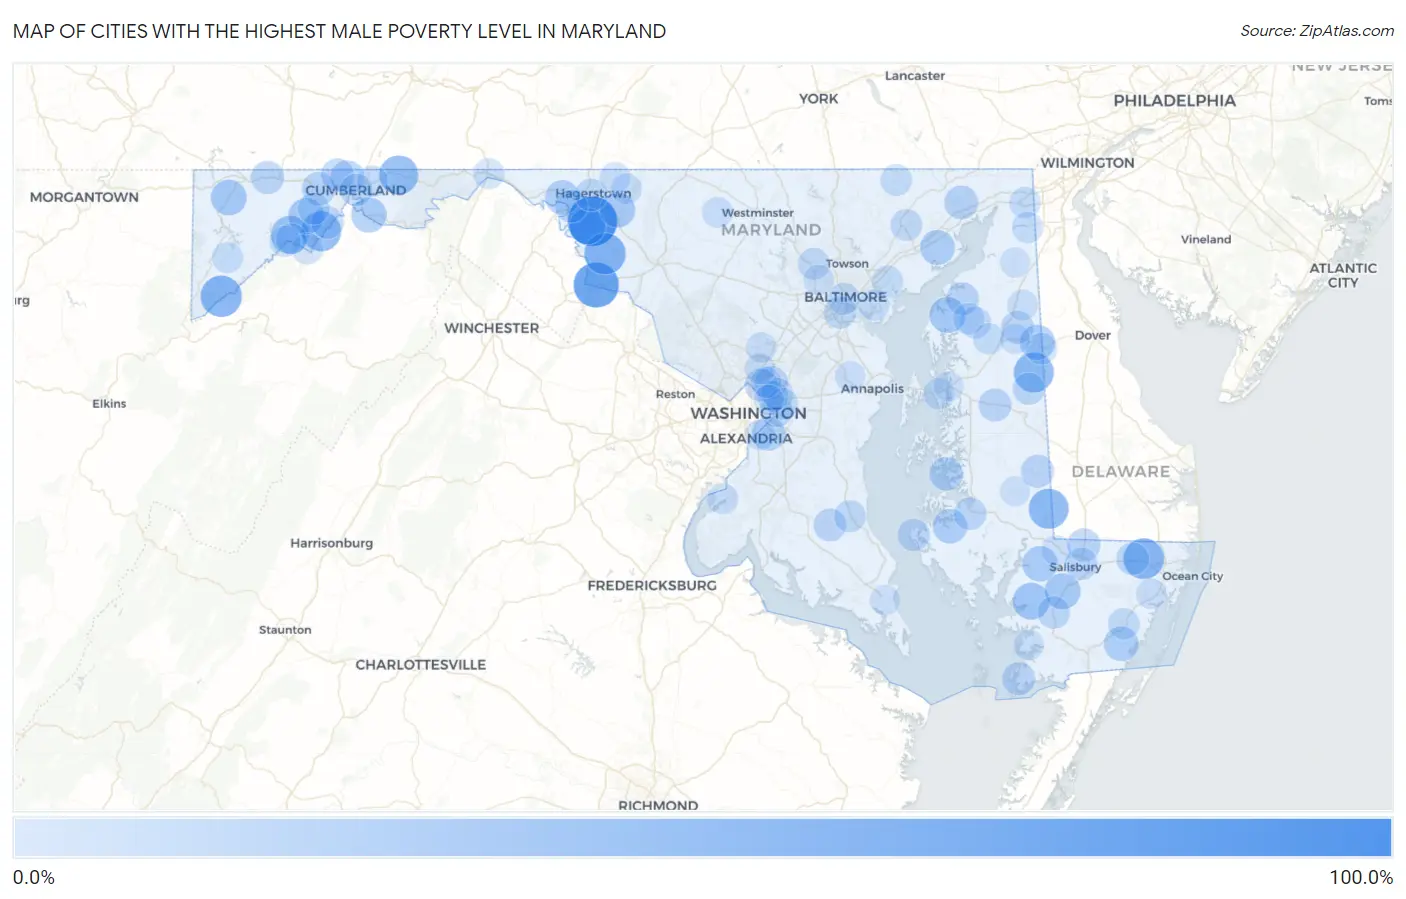
Map of Cities with the Highest Male Poverty Level in Maryland
0.0%
100.0%
Cities with the Highest Male Poverty Level in Maryland
| City | Male Poverty | vs State | vs National | |
| 1. | Breathedsville | 82.2% | 8.2%(+74.0)#1 | 11.3%(+70.9)#183 |
| 2. | Sandy Hook | 65.9% | 8.2%(+57.7)#2 | 11.3%(+54.6)#372 |
| 3. | Rohrersville | 52.1% | 8.2%(+43.9)#3 | 11.3%(+40.8)#766 |
| 4. | Gorman | 51.8% | 8.2%(+43.5)#4 | 11.3%(+40.4)#784 |
| 5. | Whaleyville | 50.0% | 8.2%(+41.8)#5 | 11.3%(+38.7)#869 |
| 6. | Goldsboro | 47.3% | 8.2%(+39.1)#6 | 11.3%(+35.9)#1,024 |
| 7. | Galestown | 46.9% | 8.2%(+38.6)#7 | 11.3%(+35.5)#1,048 |
| 8. | Danville | 46.1% | 8.2%(+37.9)#8 | 11.3%(+34.8)#1,097 |
| 9. | Flintstone | 43.8% | 8.2%(+35.6)#9 | 11.3%(+32.5)#1,233 |
| 10. | Franklin | 40.7% | 8.2%(+32.5)#10 | 11.3%(+29.4)#1,508 |
| 11. | Mount Vernon | 35.7% | 8.2%(+27.5)#11 | 11.3%(+24.4)#2,059 |
| 12. | Tilghmanton | 33.7% | 8.2%(+25.5)#12 | 11.3%(+22.3)#2,332 |
| 13. | Lonaconing | 33.1% | 8.2%(+24.9)#13 | 11.3%(+21.8)#2,420 |
| 14. | Ten Mile Creek | 32.8% | 8.2%(+24.5)#14 | 11.3%(+21.4)#2,483 |
| 15. | Eden | 32.4% | 8.2%(+24.1)#15 | 11.3%(+21.0)#2,536 |
| 16. | Fairlee | 32.3% | 8.2%(+24.0)#16 | 11.3%(+20.9)#2,557 |
| 17. | Accident | 32.1% | 8.2%(+23.9)#17 | 11.3%(+20.8)#2,577 |
| 18. | Bagtown | 30.5% | 8.2%(+22.3)#18 | 11.3%(+19.1)#2,875 |
| 19. | Quantico | 30.4% | 8.2%(+22.2)#19 | 11.3%(+19.1)#2,884 |
| 20. | Templeville | 30.0% | 8.2%(+21.8)#20 | 11.3%(+18.7)#2,978 |
| 21. | Spring Gap | 29.6% | 8.2%(+21.4)#21 | 11.3%(+18.3)#3,056 |
| 22. | Perryman | 28.5% | 8.2%(+20.2)#22 | 11.3%(+17.1)#3,338 |
| 23. | Girdletree | 27.7% | 8.2%(+19.4)#23 | 11.3%(+16.3)#3,530 |
| 24. | Pinesburg | 27.6% | 8.2%(+19.3)#24 | 11.3%(+16.2)#3,554 |
| 25. | Church Creek | 27.1% | 8.2%(+18.9)#25 | 11.3%(+15.7)#3,675 |
| 26. | Still Pond | 25.9% | 8.2%(+17.7)#26 | 11.3%(+14.6)#4,017 |
| 27. | Corriganville | 25.5% | 8.2%(+17.3)#27 | 11.3%(+14.2)#4,132 |
| 28. | Marlow Heights | 25.1% | 8.2%(+16.9)#28 | 11.3%(+13.8)#4,275 |
| 29. | Oxford | 24.8% | 8.2%(+16.5)#29 | 11.3%(+13.4)#4,414 |
| 30. | Port Deposit | 24.6% | 8.2%(+16.4)#30 | 11.3%(+13.2)#4,488 |
| 31. | Frostburg | 23.9% | 8.2%(+15.6)#31 | 11.3%(+12.5)#4,744 |
| 32. | Grantsville | 22.9% | 8.2%(+14.7)#32 | 11.3%(+11.6)#5,112 |
| 33. | College Park | 22.9% | 8.2%(+14.7)#33 | 11.3%(+11.6)#5,117 |
| 34. | Delmar | 22.7% | 8.2%(+14.5)#34 | 11.3%(+11.4)#5,192 |
| 35. | Federalsburg | 22.3% | 8.2%(+14.1)#35 | 11.3%(+10.9)#5,408 |
| 36. | Barrelville | 22.2% | 8.2%(+14.0)#36 | 11.3%(+10.9)#5,446 |
| 37. | Crisfield | 22.1% | 8.2%(+13.8)#37 | 11.3%(+10.7)#5,516 |
| 38. | Queen Anne | 21.8% | 8.2%(+13.6)#38 | 11.3%(+10.5)#5,641 |
| 39. | Benedict | 21.7% | 8.2%(+13.5)#39 | 11.3%(+10.4)#5,683 |
| 40. | Langley Park | 21.5% | 8.2%(+13.3)#40 | 11.3%(+10.1)#5,793 |
| 41. | Sudlersville | 21.4% | 8.2%(+13.2)#41 | 11.3%(+10.1)#5,818 |
| 42. | Butlertown | 21.1% | 8.2%(+12.9)#42 | 11.3%(+9.80)#5,954 |
| 43. | Williamsport | 21.1% | 8.2%(+12.9)#43 | 11.3%(+9.77)#5,972 |
| 44. | Hagerstown | 21.0% | 8.2%(+12.8)#44 | 11.3%(+9.64)#6,035 |
| 45. | Cambridge | 20.7% | 8.2%(+12.5)#45 | 11.3%(+9.41)#6,146 |
| 46. | Willards | 20.7% | 8.2%(+12.4)#46 | 11.3%(+9.34)#6,178 |
| 47. | Rawlings | 20.3% | 8.2%(+12.1)#47 | 11.3%(+8.94)#6,380 |
| 48. | Princess Anne | 20.1% | 8.2%(+11.9)#48 | 11.3%(+8.77)#6,457 |
| 49. | Salisbury | 20.0% | 8.2%(+11.8)#49 | 11.3%(+8.70)#6,481 |
| 50. | Cumberland | 20.0% | 8.2%(+11.8)#50 | 11.3%(+8.68)#6,485 |
| 51. | Taylors Island | 20.0% | 8.2%(+11.8)#51 | 11.3%(+8.66)#6,523 |
| 52. | Baltimore Highlands | 19.6% | 8.2%(+11.4)#52 | 11.3%(+8.24)#6,756 |
| 53. | Fairmount Heights | 19.3% | 8.2%(+11.0)#53 | 11.3%(+7.94)#6,918 |
| 54. | Greensboro | 18.9% | 8.2%(+10.7)#54 | 11.3%(+7.58)#7,126 |
| 55. | Prince Frederick | 18.7% | 8.2%(+10.5)#55 | 11.3%(+7.37)#7,273 |
| 56. | Baltimore | 18.6% | 8.2%(+10.3)#56 | 11.3%(+7.21)#7,383 |
| 57. | Midland | 18.0% | 8.2%(+9.79)#57 | 11.3%(+6.67)#7,730 |
| 58. | Kingstown | 18.0% | 8.2%(+9.73)#58 | 11.3%(+6.62)#7,765 |
| 59. | Garrison | 17.9% | 8.2%(+9.65)#59 | 11.3%(+6.54)#7,819 |
| 60. | Bel Air | 17.7% | 8.2%(+9.49)#60 | 11.3%(+6.38)#7,935 |
| 61. | East Riverdale | 17.6% | 8.2%(+9.39)#61 | 11.3%(+6.28)#8,009 |
| 62. | Snow Hill | 17.5% | 8.2%(+9.31)#62 | 11.3%(+6.20)#8,057 |
| 63. | Pylesville | 17.5% | 8.2%(+9.30)#63 | 11.3%(+6.19)#8,059 |
| 64. | Marydel | 17.5% | 8.2%(+9.27)#64 | 11.3%(+6.16)#8,085 |
| 65. | Landover | 17.5% | 8.2%(+9.24)#65 | 11.3%(+6.13)#8,106 |
| 66. | Chestertown | 16.9% | 8.2%(+8.66)#66 | 11.3%(+5.55)#8,478 |
| 67. | Middle River | 16.7% | 8.2%(+8.42)#67 | 11.3%(+5.31)#8,677 |
| 68. | Edmonston | 16.6% | 8.2%(+8.40)#68 | 11.3%(+5.29)#8,688 |
| 69. | Elkton | 16.6% | 8.2%(+8.33)#69 | 11.3%(+5.22)#8,734 |
| 70. | Chesapeake City | 16.3% | 8.2%(+8.06)#70 | 11.3%(+4.95)#8,906 |
| 71. | Pleasant Grove | 16.2% | 8.2%(+7.99)#71 | 11.3%(+4.87)#8,963 |
| 72. | Church Hill | 16.2% | 8.2%(+7.97)#72 | 11.3%(+4.85)#8,980 |
| 73. | Grasonville | 16.1% | 8.2%(+7.85)#73 | 11.3%(+4.73)#9,066 |
| 74. | Mccoole | 16.0% | 8.2%(+7.74)#74 | 11.3%(+4.63)#9,148 |
| 75. | Bloomington | 15.9% | 8.2%(+7.64)#75 | 11.3%(+4.53)#9,216 |
| 76. | Deer Park | 15.7% | 8.2%(+7.49)#76 | 11.3%(+4.38)#9,324 |
| 77. | Dundalk | 15.3% | 8.2%(+7.09)#77 | 11.3%(+3.98)#9,665 |
| 78. | Hancock | 15.1% | 8.2%(+6.89)#78 | 11.3%(+3.77)#9,815 |
| 79. | Indian Head | 15.1% | 8.2%(+6.88)#79 | 11.3%(+3.76)#9,826 |
| 80. | Leitersburg | 15.0% | 8.2%(+6.80)#80 | 11.3%(+3.69)#9,877 |
| 81. | Smithsburg | 14.8% | 8.2%(+6.57)#81 | 11.3%(+3.45)#10,058 |
| 82. | Union Bridge | 14.6% | 8.2%(+6.41)#82 | 11.3%(+3.30)#10,196 |
| 83. | Adelphi | 14.4% | 8.2%(+6.18)#83 | 11.3%(+3.06)#10,386 |
| 84. | White Oak | 14.3% | 8.2%(+6.10)#84 | 11.3%(+2.99)#10,453 |
| 85. | Millington | 14.2% | 8.2%(+6.01)#85 | 11.3%(+2.90)#10,555 |
| 86. | Westernport | 14.2% | 8.2%(+5.98)#86 | 11.3%(+2.87)#10,582 |
| 87. | Spencerville | 14.1% | 8.2%(+5.83)#87 | 11.3%(+2.71)#10,725 |
| 88. | Glassmanor | 13.8% | 8.2%(+5.53)#88 | 11.3%(+2.42)#10,966 |
| 89. | Crownsville | 13.7% | 8.2%(+5.52)#89 | 11.3%(+2.40)#10,983 |
| 90. | Lochearn | 13.3% | 8.2%(+5.05)#90 | 11.3%(+1.94)#11,422 |
| 91. | Woodlawn Cdp Baltimore County | 13.3% | 8.2%(+5.03)#91 | 11.3%(+1.92)#11,438 |
| 92. | Newark | 13.1% | 8.2%(+4.89)#92 | 11.3%(+1.77)#11,587 |
| 93. | Fairmount | 13.1% | 8.2%(+4.87)#93 | 11.3%(+1.75)#11,604 |
| 94. | Lexington Park | 12.9% | 8.2%(+4.63)#94 | 11.3%(+1.51)#11,868 |
| 95. | Barclay | 12.7% | 8.2%(+4.43)#95 | 11.3%(+1.32)#12,043 |
| 96. | Hurlock | 12.6% | 8.2%(+4.40)#96 | 11.3%(+1.29)#12,070 |
| 97. | Cottage City | 12.6% | 8.2%(+4.39)#97 | 11.3%(+1.28)#12,078 |
| 98. | Hebron | 12.6% | 8.2%(+4.32)#98 | 11.3%(+1.21)#12,143 |
| 99. | Queenstown | 12.5% | 8.2%(+4.23)#99 | 11.3%(+1.12)#12,265 |
| 100. | Cecilton | 12.4% | 8.2%(+4.18)#100 | 11.3%(+1.06)#12,306 |
Common Questions
What are the Top 10 Cities with the Highest Male Poverty Level in Maryland?
Top 10 Cities with the Highest Male Poverty Level in Maryland are:
#1
82.2%
#2
65.9%
#3
52.1%
#4
51.8%
#5
50.0%
#6
47.3%
#7
46.9%
#8
46.1%
#9
43.8%
#10
40.7%
What city has the Highest Male Poverty Level in Maryland?
Breathedsville has the Highest Male Poverty Level in Maryland with 82.2%.
What is the Poverty Level Among Males in the State of Maryland?
Poverty Level Among Males in Maryland is 8.2%.
What is the Poverty Level Among Males in the United States?
Poverty Level Among Males in the United States is 11.3%.